UMTRI-2015-24 MARCH 2016
C
HILD
P
OSTURE AND
B
ELT
F
IT IN
S
ECOND
R
OW
V
EHICLE
S
EATS
K
ATHLEEN
D.
K
LINICH
,
S
HEILA
E
BERT
,
i Technical Report Documentation Page
1. Report No.
UMTRI-2015-35 2. Government Accession No. 3. Recipient's Catalog No.
4. Title and Subtitle
Child Posture and Belt Fit in Second-Row Vehicle Seats 5. Report Date March 2016
6. Performing Organization Code
7. Author(s)
Klinich, Kathleen D., Ebert, Sheila M., and Reed, Matthew P. 8. Performing Organization Report No.
9. Performing Organization Name and Address
University of Michigan Transportation Research Institute 2901 Baxter Rd.
Ann Arbor MI 48109
10. Work Unit No. (TRAIS)
11. Contract or Grant No.
12. Sponsoring Agency Name and Address
National Highway Traffic Safety Administration 13. Type of Report and Period Covered Final, April 2010-March 2016
14. Sponsoring Agency Code
15. Supplementary Notes
16. Abstract
Posture and belt fit were measured for 40 children ages 5 to 12 years across two phases of testing involving six vehicles and six boosters, including one integrated booster. The three-dimensional locations of landmarks on the children, belt, and seat were recorded in each condition. Belt anchorage locations and other vehicle dimensions were recorded to characterize the seating environments. Lap belt fit was quantified by the location of the edge of the belt relative to the anterior-superior iliac spine landmark on the pelvis. Shoulder belt fit was measured as the lateral distance of the belt from the occupant centerline at the height of the suprasternale landmark. Lap belt fit without a booster was generally poor, with the belt lying fully above the pelvis for most children in most conditions. Belt positioning boosters improved lap belt fit in all conditions and improved shoulder belt fit for many combinations of children and vehicle. Taller children generally experienced better belt fit, but the effects were small compared to the benefits of using a booster. Belt fit scores were correlated with predictions based on previous laboratory studies using child stature and vehicle geometry as inputs. Mean belt fit scores were well correlated across conditions with predictions based on ATD measurements.
17. Key Word
vehicle occupants, children, posture, belt fit, rear seats 18. Distribution Statement
19. Security Classif. (of this report) 20. Security Classif. (of this page) 21. No. of Pages
49
22. Price
ii
METRIC CONVERSION CHART
APPROXIMATE CONVERSIONS TO SI UNITS
SYMBOL WHEN YOU KNOW MULTIPLY
BY TO FIND SYMBOL
LENGTH
In inches 25.4 millimeters mm
Ft feet 0.305 meters m
Yd yards 0.914 meters m
Mi miles 1.61 kilometers km
AREA
in2 square inches 645.2 square millimeters mm2
ft2 square feet 0.093 square meters m2
yd2 square yard 0.836 square meters m2
Ac acres 0.405 hectares ha
mi2 square miles 2.59 square kilometers km2
VOLUME fl oz fluid
ounces 29.57 milliliters mL
gal gallons 3.785 liters L
ft3 cubic
feet 0.028 cubic meters m
3
yd3 cubic
yards 0.765 cubic meters m 3
NOTE: volumes greater than 1000 L shall be shown in m3
MASS
oz ounces 28.35 grams g
lb pounds 0.454 kilograms kg
T short
tons (2000 lb)
0.907 megagrams
(or "metric ton")
Mg (or "t")
TEMPERATURE (exact degrees)
oF Fahrenheit 5 (F-32)/9
or (F-32)/1.8 Celsius
oC
FORCE and PRESSURE or STRESS
lbf pound force 4.45 newtons N
lbf/in2 pound force
per square inch
iii
LENGTH
mm millimeters 0.039 inches in
m meters 3.28 feet ft
m meters 1.09 yards yd
km kilometers 0.621 miles mi
AREA mm2 square
millimeters 0.0016 square inches in 2
m2 square meters 10.764 square
feet ft 2
m2 square meters 1.195 square
yards yd 2
ha hectares 2.47 acres ac
km2 square
kilometers 0.386 square miles mi 2
VOLUME
mL milliliters 0.034 fluid ounces fl oz
L liters 0.264 gallons gal
m3 cubic meters 35.314 cubic feet ft3
m3 cubic meters 1.307 cubic yards yd3
MASS
g grams 0.035 ounces oz
kg kilograms 2.202 pounds lb
Mg (or "t") megagrams (or
"metric ton") 1.103 short tons (2000 lb) T
TEMPERATURE (exact degrees)
oC Celsius 1.8C+32 Fahrenheit oF
FORCE and PRESSURE or STRESS
N Newtons 0.225 pound force lbf
kPa Kilopascals 0.145 pound force per
square inch lbf/in 2
*SI is the symbol for the International System of Units. Appropriate rounding should be made to comply with Section 4 of ASTM E380.
iv
ACKNOWLEDGMENTS
v
TABLE OF CONTENTS
Metric Conversion Chart... ii
ACKNOWLEDGMENTS ... iv
List of Figures ... vi
List of Tables ... viii
INTRODUCTION ... 1
METHODS ... 2
Vehicles... 2
Boosters... 4
Vehicle Test Matrix ... 6
Subject Recruitment ... 7
Participant Body Dimensions ... 7
Laboratory Test Conditions ... 10
Vehicle Measurements ... 11
Calculations... 15
Measurement of Vehicle Belt Fit Using 6YO ATD ... 17
RESULTS ... 18
Effects of Seat Cushion Length on Posture ... 18
In-Vehicle Posture ... 22
Qualitative ... 22
Belt Fit: Variation with Test Condition ... 24
Belt Fit: Variation with Vehicle and Subject Anthropometry ... 33
Posture: Variation with Vehicle ... 34
Comparison of Predicted and Observed Child Belt Fit ... 35
ATD Belt Fit in Vehicle and Booster Conditions ... 37
Relationships Between Child and ATD Belt Fit ... 39
DISCUSSION ... 41
REFERENCES ... 43
vi
LIST OF FIGURES
Figure 1. Vehicles used in Phase I testing. ... 2
Figure 2. Vehicles used in phase II testing. ... 3
Figure 3. Traverse has an add-on “comfort guide” for the rear seat positions, which is a piece of elastic from the pillar to a plastic sleeve that that the shoulder belt slides through. ... 3
Figure 4. Boosters used in Phase I testing: Generations (left), Frontier (center), Turbo Booster (right). ... 5
Figure 5. Boosters used in Phase II: ProBooster (left), Alpha Omega (left center), Volvo Integrated Low (right center), Volvo Integrated High (right). ... 5
Figure 6. Participant weight and stature distribution. ... 7
Figure 7. Measuring bispinous breadth as part of standard anthropometry. ... 8
Figure 8. Locating and marking spinous process landmarks prior to hardseat measurement. ... 9
Figure 9. Measuring body landmark locations in the hardseat. ... 9
Figure 10. Landmarks recorded for each participant in the hardseat. ... 10
Figure 11. Subject choosing posture and donning belt in reconfigurable vehicle seat mockup. ... 11
Figure 12. Adjusting booster seat to fit each child. ... 13
Figure 13. Typical sequence of in-vehicle test measurements. ... 13
Figure 14. Points used to characterize lap belt location with respect to the pelvis and manubrium. ... 14
Figure 15. Shoulder belt score. ... 15
Figure 16. Calculating lap belt score. ... 16
Figure 17. Calculating D-ring angle in YZ plane. ... 16
Figure 18. Belt fit obtained with 6YO ATD in Nissan Altima (top) and Dodge Caravan (bottom) using new ATD positioning/belt fit measurement procedures. ... 17
Figure 19. Qualitative variation in posture with cushion length for one subject. ... 19
Figure 20. Variation in mean lap belt score with cushion length. ... 20
Figure 21. Variation in effective lap belt angle with cushion length. ... 20
Figure 22. Variation in hip fore-aft location relative to seat H-point with cushion length. 21 Figure 23. Variation in eye height relative to seat H-point with cushion length. ... 21
Figure 24. An 11YO subject, stature 1400 mm, seated in Dodge Caravan with and without a booster. ... 22
Figure 25. An 11YO participant with stature 1400 mm seated in Nissan Altima with and without a booster. ... 23
Figure 26. An 11YO subject with stature 1400 mm seated in Chevy Traverse with and without a booster. ... 23
Figure 27. 9YO subject with stature 1297 seated in Volvo in integrated booster with high, low, and stowed positions. ... 24
Figure 28. 6YO subject with stature 1131 seated in Volvo with the integrated booster in the high, low, and stowed positions. ... 24
vii
Figure 30. Shoulder belt score box plots for each vehicle condition without booster. ... 25 Figure 31. Lap belt score box plots for each booster condition and vehicle. ... 27 Figure 32. Mean lap belt score by vehicle and booster. Top figure shows boxplots of
mean lap belt score for booster conditions and a line for no-booster conditions. Bottom figure shows individual lines for each booster condition. Data are shown for seat position C1 only for Mnv1 and Suv1... 29 Figure 33. Shoulder belt score box plots for each booster condition and vehicle. ... 31 Figure 34. Shoulder belt score by vehicle and booster. Top figure shows boxplots of
shoulder belt score for booster conditions and a line for no-booster conditions. Bottom figure shows individual lines for each booster condition. Data are from C1 only for Mnv1 and Suv1. ... 32 Figure 35. Hip and head CG location with respect to seat H-point for no-booster
condition across vehicles... 34 Figure 36. Angle of hip-to-head-CG vector with respect to vertical for the no-booster
condition across vehicles... 35 Figure 37. Observed mean lap belt score as a function of predicted lap belt score for
no-booster conditions. Solid line is linear regression. Dashed line is 1:1. ... 36 Figure 38. Observed mean lap belt score as a function of predicted shoulder belt score
for no-booster conditions. Solid line is linear regression. Dashed line is 1:1. . 37 Figure 39. Observed mean child lap belt score as a function of 6YO ATD lap belt score.
Each combination of vehicle and booster (triangle) and no-booster conditions (circles) are shown. Black line is linear regression. Red and blue lines are prediction models from Reed et al. (2008) for booster and no-booster
viii
LIST OF TABLES
Table 1. Vehicle Seat Details ... 4
Table 2. Vehicle Belt Details ... 4
Table 3. Boosters ... 4
Table 4. Allocation of Participants by Vehicle and Booster/Seat Configuration ... 6
Table 5. Standard Anthropometric Measures... 8
Table 6. Recorded Points ... 12
Table 7. Mean Lap Belt Scores from ATD Belt Fit Measurements*... 38
1
INTRODUCTION
In a series of laboratory studies, researchers at the University of Michigan Transportation Research Institute (UMTRI) have quantified the belt fit that children experience across a range of booster configurations (Reed et al. 2005a, Reed et al. 2008, Reed et al. 2009). Important conclusions from these laboratory studies include:
• The belt fit provided by belt-positioning boosters differs substantially across booster models.
• On average, larger children experience better belt fit than smaller children when sitting without a booster, but children the size of a typical three-year-old experience better lap belt fit in a booster than a typical twelve-year-old sitting without a booster. • Shorter seat cushion lengths are associated with less-slouched postures and better lap
belt fit.
UMTRI research has also shown that the seat cushions in rear seats are generally much longer than the thighs of children under age 12 (Reed and Huang 2006). Longer seat cushions are associated with more-slouched postures for both adults and children (Reed et al. 2005b, Reed et al. 2008).
The objectives of the current study were:
• Gather data to quantify the posture and belt fit that children experience in vehicle second-row seats with and without belt-positioning boosters.
• Gather data to improve quantification of the effects of seat cushion length on child posture and belt fit.
2
METHODS
Vehicles
Six vehicles were chosen for testing. Half of subjects were tested in three vehicles each. Figure 1 shows the vehicles used in the first phase of testing, while Figure 2 shows those tested in Phase II. The vehicles were chosen to span a range of size and body style. Additional requirements included a readily accessible second-row seat and rental availability in Ann Arbor. One vehicle (Volvo) was provided by the manufacturer. The minivan and the large SUV were equipped with second-row captain’s chairs that could be adjusted fore-aft. Because the outboard belt anchorage locations were fixed to the
vehicle, changes in seat position affected belt angles. Consequently, these seats were tested in two fore-aft positions. The Volvo XC60 was equipped with a two-position integrated booster (see Figure 5). Along with the booster-stowed condition, this vehicle provided three test conditions. The Traverse was equipped with a shoulder belt router pictured in Figure 3.
[image:11.612.95.428.316.672.2]N is sa n A ltim a D od ge C ar av an C he vy T ra ve rs e
3
H
onda
C
ivi
c
For
d T
aur
us
V
ol
vo X
C
[image:12.612.95.445.68.408.2]60
[image:12.612.234.378.451.575.2]Figure 2.Vehicles used in phase II testing.
Figure 3.Traverse has an add-on “comfort guide” for the rear seat positions, which is a piece of elastic from the pillar to a plastic sleeve that that the shoulder belt slides
through.
4
Table 1. Vehicle Seat Details
Condition Vehicle Position Seat Type Seat Seat Back Angle (˚)
Seat Cushion
Angle (˚) (mm) H30
Cushion Length
(mm) surface Seat Pas1C1 Altima NA Bench 28 14 330 474 Leather Mnv1C1 Caravan Aft Captain 23 18 300 470 Cloth Mnv1C2 Caravan Fore Captain 23 18 316 470 Cloth Suv1C1 Traverse Aft Bench 23 17 295 425 Cloth Suv1C2 Traverse Fore Bench 23 17 297 425 Cloth Pas2C1 Civic NA Bench 27 16 320 463 Cloth Pas3C1 Taurus NA Bench 28 18 310 475 Cloth Suv2C1 Volvo NA Integrated 29 15 340 454 Leather
Table 2. Vehicle Belt Details
ID
H-pt to Anchor XZ Angle Rel.
Horizontal (˚) Anchor Y Distance Rel. Seat Centerline (mm)
D-ring to H-pt. Angles Rel. Vertical
(˚) Buckle Information D-Ring Condition OB IB OB IB XZ YZ Location Stalk
Pas1C1 53 45 245 148 38 22 Bight Webbing +Guide Mnv1C1 55 51 282 220 31 24 Lateral Rigid Low Mnv1C2 45 51 282 220 34 20 Lateral Rigid High Suv1C1 69 51 300 169 var. var. Bight Rigid +Guide Suv1C2 53 51 300 169 28 22 Bight Rigid -Guide Pas2C1 52 42 226 182 43 23 Bight Webbing NA Pas3C1 34 42 353 154 32 22 Fwd. Bight Webbing NA Suv2C1 73 59 237 220 42 26 Bight In seat NA
Boosters
Six boosters were selected for testing in this study. The boosters were chosen from those used in previous studies to provide a wide range of belt-fit performance. Details about each booster are listed in Table 3. Figure 4 shows the boosters used in Phase 1 and Figure 5 shows the Phase-2 boosters.
Table 3. Boosters
Booster
Number: B12H B12L B32H B34H B35H B36H B37L B37H
Model Booster Turbo Booster Turbo Omega Alpha Generations Frontier 85 ProBooster Stage 1 Stage 2 Manufacturer Graco Graco Safety 1st Evenflo Britax Recaro Volvo Volvo
Configuration Back High Back Low High Back Back High High Back High Back Back Low Back Low
Type Booster Only Booster Only Combo Combo Combo Booster Only Integrated Booster Integrated Booster Child Weight
limit (lb) 30-100 40-100 40-100 30-100 40-120 30-120 49-79 33-55 Child Stature
5
Figure 4.Boosters used in Phase I testing: Generations (left), Frontier (center), and the Turbo Booster (right).
Figure 5.Boosters used in Phase II: ProBooster (left), Alpha Omega (left center), Volvo Integrated at the “Low” position (right center), and the Volvo Integrated at the “High”
6
Vehicle Test Matrix
Testing was conducted in two phases to achieve a wide range of booster/vehicle combinations. Table 4 lists the allocation of participants by phase, vehicle, and booster/seat configuration.
Table 4. Allocation of Participants by Vehicle and Booster/Seat Configuration
PHASE 1 PHASE 2
Vehicle: Altima Nissan Pas1 Dodge Caravan Mnv1 Chevy Traverse Suv1 Honda Civic Pas2 Ford Taurus Pas3 Volvo XC60 Suv2 Vehicle Condition Level: C1 C2 C1 C2
B oo ste r C on ditio ns
TurboBooster BB (B12L) 10 10 10 10 10 10 10 Alpha Omega (B32H) 10 10 10 10 10 10 Frontier 85 (B35H) 10 10 10 10 10 10 TurboBooster HB (B12H) 10 10 10 10 10 10 Generations (B24H) 10 10 10 10 10 10 ProBooster (B26H) 10 10 10 10 10 10
No booster 20* 20* 10 20* 10 20* 20* 20*
Integrated Low (B37L) 20**
Integrated High (B27H) 20**
*Two repetitions per participant,
**Two repetitions for half of the participants
Grey and white = blocked “groups” 1 and 2 respectively
7
Subject Recruitment
For this study, 20 boys and 20 girls aged 5 to 12 whose stature and weight span the range of the Hybrid III 6YO and 10YO ATDs were recruited. The weight-by-stature
[image:16.612.110.465.209.428.2]distribution of subjects for each phase and group are shown in Figure 6. All test procedures were approved by an Institutional Review Board at the University of Michigan (HUM00008969).
Figure 6.Participant weight and stature distribution.
Participant Body Dimensions
Each participant wore loose-fitting clothing provided by the experimenters that was open in the back to facilitate access. Initial testing included the standard anthropometric measures listed in Table 5. Figure 7 shows an example of the type of calipers used in anthropometric measurement. 15 20 25 30 35 40 45
1000 1100 1200 1300 1400 1500
W eig ht (k g) Stature (mm) Phase 1 Group 1
8
Table 5. Standard Anthropometric Measures
Stature Hip Breadth
Weight Shoulder Elbow Length Head Length Elbow Fingertip Length Erect Sitting Height Buttock-Knee Length Shoulder Height Buttock-Popliteal Length Acromion Height Chest Depth
Knee Height Abdomen Depth Popliteal Height Chest Width Bideltoid Breadth Abdomen Width Bi-acromial Breadth Popliteal Depth
Bispinous Breadth Waist circumference, seated
Figure 7.Measuring bispinous breadth as part of standard anthropometry. Key landmarks were marked on each subject using washable marker as shown in Figure 8. Body landmark locations were recorded using a FARO Arm coordinate digitizer (FARO Technologies, Lake Mary, FL) as each participant sat in laboratory hardseat, shown in Figure 9, which provides access to posterior landmarks on the spine and pelvis. Figure 10 shows the landmarks that were recorded in the hardseat.
9
[image:18.612.228.387.72.288.2]Figure 8.Locating and marking spinous process landmarks prior to hardseat measurement.
10
Figure 10.Landmarks recorded for each participant in the hardseat.
Laboratory Test Conditions
11
Figure 11.Subject choosing posture and donning belt in reconfigurable vehicle seat mockup.
Vehicle Measurements
12
Table 6. Recorded Points
Torso Belt Points Dring Pivot Dring (or guide) Fore Dring (or guide) Aft
Torso Belt Relative to Child Clavicle Outboard
Clavicle Inboard Leaves Shoulder
Suprasternale Height Outboard Suprasternale Height Inboard Sternum Top
Sternum Bottom
Lap Belt Points Latchplate Fore/Aft Buckle-latchplate opening Buckle/seat plane fore and aft Outboard anchor/seat contact
Lap Belt Points Relative to Child, Left and Right
Hip Contact Fore and Aft Child ASIS Fore, Mid, Aft
Child Landmarks Left and Right Acromion
Suprapatella Infrapatella
Femoral Condyle, Lateral Femoral Condyle, Medial ASIS
Child Landmarks D-ring Side (Outboard)
Infraorbitale at pupil Ectoorbitale Tragion Clavicle, Medial Clavicle, Lateral
Humeral Epicondyle, Lateral Wrist
Malleolus Lateral Heel
Ball of Foot Toe
Child Landmarks Centerline Suprasternale
Substernale Glabella
Booster
Shell Reference Points (3) ** Headrest Reference Points (3)**
Vehicle Reference Points (3) **
Streams of Continuous Points
Sagittal stream at ASIS lateral position from substernale height to mid thigh (left and right)
Stream along top of shoulder (outboard)
** Digitized with and without child on booster
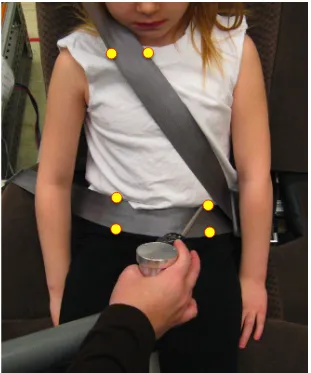
Prior to testing, each booster seat was adjusted outside the vehicle to fit each participant according to child restraint manufacturers’ directions as shown in Figure 12. Figure 13 shows a typical sequence of in-vehicle measurement, where the adjusted booster location is measured before the child enters the vehicle, the child sits in the booster and dons the seat belt, measurements with the belt in place are taken, and then additional body landmarks are recorded with the belt taken off. A close-up of the points used to
13
Figure 12.Adjusting booster seat to fit each child.
14
15
Calculations
A method of quantifying lap belt and shoulder belt position was developed in previous UMTRI research studies (Reed et al. 2005a, Reed et al. 2008, Reed et al. 2009). Shoulder belt score, illustrated in Figure 15, is defined as the lateral measurement between the suprasternale and the nearest point on the shoulder belt at the height of the suprasternale. Negative values indicate the belt passes to the right (buckle side) of the suprasternale landmark.
Figure 15.Shoulder belt score.
Calculation of lap belt score is shown in Figure 16. Using a spline fit along the stream taken at the lateral ASIS location, the distance from the projection of the ASIS to the top of the lap belt is the lap belt score. Positive values indicate that the belt lies below the ASIS, while negative scores indicate that the top of the belt lies above the ASIS towards the abdomen.
16
Figure 16.Calculating lap belt score.
Figure 17.Calculating D-ring angle in YZ plane.
H-Point
D-Ring Angle (front view)
17
Measurement of Vehicle Belt Fit Using 6YO ATD
A critical component of this research task is to establish the relationships between vehicle belt fit, as measured by belt fit on the 6YO Hybrid-III ATD, and child belt fit under the same conditions. Previous procedures used to install the ATD and measure belt fit in boosters are inadequate, because children seated without a booster tend to slump
considerably. To address this need, a new ATD positioning procedure was developed for situations in which children are seated without a booster (Reed et al. 2011).
Figure 18 shows the results of applying this procedure in two vehicles. The ATD pelvis does not contact the seat back and the lap portion of the belt is routed over the abdomen. The torso is propped up slightly to eliminate head contact with the seat back (Reed et al. 2011).
18
RESULTS
Effects of Seat Cushion Length on Posture
19
325 mm 360 mm
400 mm 435 mm
[image:28.612.127.492.64.653.2]471 mm 504 mm
20
[image:29.612.124.468.418.667.2]Figure 20.Variation in mean lap belt score with cushion length.
21
Figure 22.Variation in hip fore-aft location relative to seat H-point with cushion length.
[image:30.612.125.470.387.648.2]22
In-Vehicle Posture
QualitativeFigure 24 through Figure 26 show images of a 1400-mm-tall child sitting in the rear seat of three vehicles with and without an add-on booster. In the Caravan, the child’s feet rested on the floor while sitting on the vehicle seat, but were above the floor when sitting on the booster. The outboard lap belt angles were visibly different across the three vehicles.
Figure 26 and Figure 27 show two children sitting in the Volvo with the integrated booster stowed and at the two height settings. The images show an apparent increase in lap belt angle relative to horizontal at higher booster settings.
23
Figure 25.An 11YO participant with stature 1400 mm seated in Nissan Altima with and without a booster.
24
Figure 27.9YO subject with stature 1297 seated in Volvo in integrated booster with high, low, and stowed positions.
Figure 28.6YO subject with stature 1131 seated in Volvo with the integrated booster in the high, low, and stowed positions.
Belt Fit: Variation with Test Condition
25
Figure 29.Lap belt score box plots for each vehicle without booster. C1 and C2 are pooled for Mnv1 and Suv1.
Shoulder-belt score box plots are shown in Figure 29. Seat positions C1 and C2
produced different scores for Suv1, so C1 and C2 are shown separately. On average, the minivan and three passenger vehicles produce belt shoulder belt fits that cross close to the child’s suprasternale without using a booster. SUV1 shoulder belts cross further
outboard on the child’s shoulder, while SUV2 shoulder belts cross further inboard.
[image:34.612.126.457.459.678.2]26
27
M
ean
L
ap
B
el
t S
co
re (
m
m
); H
ig
her
is
B
et
ter
Pas
1
Pas
2
Pas
3
M
nv1
SUV1
SUV2
[image:36.612.101.525.67.695.2]28
Figure 32 shows the distribution of mean lap belt score across vehicles and boosters. The boosters show a fairly consistent rank across vehicles, with booster B12 generally having the best scores. However, the vehicle also has an effect, with better median scores in Pas2 and Pas3 for booster conditions than in Mnv1, Pas1, and Suv1. All booster
29
Figure 32.Mean lap belt score by vehicle and booster. Top figure shows boxplots of mean lap belt score for booster conditions and a line for no-booster conditions. Bottom
30
Figure 33 shows boxplots of shoulder belt scores by booster and vehicle. The data show that boosters differ fairly widely in the distribution of shoulder belt scores, and the differences between the boosters are similar across vehicles. Figure 34 shows box and line plots for mean shoulder belt scores across booster and vehicle conditions. In all vehicles, the shoulder belt score was much lower with no booster, with a mean value of 1.5 mm indicating that the inner edge of the shoulder belt passed over the suprasternale landmark, on average. In contrast, the mean score for all booster conditions was 37 mm, indicating that the belt was substantially further outboard. The line plot shows that the rank order of shoulder belt score across boosters was similar across vehicles,
31
Shoul
de
r B
el
t S
cor
e (
m
m
)
Pas
1
Pas
2
Pas
3
M
nv1
SUV1
SUV2
[image:40.612.99.532.68.692.2]Booster>> B00N B12H B12L B32H B34H B35H B36H B37H B37L
32
Figure 34.Shoulder belt score by vehicle and booster. Top figure shows boxplots of shoulder belt score for booster conditions and a line for no-booster conditions. Bottom figure shows individual lines for each booster condition. Data are from C1
33
Belt Fit: Variation with Vehicle and Subject Anthropometry Lap Belt Fit
In the no-booster condition, mean lap belt score was significantly related to stature (p<0.001) across vehicles, but the relationship was weak:
Mean LBS (mm) = -74 + 0.053 Stature, R2=0.12, RMSE = 17.2, p<0.001
On average, taller children experienced better lap belt fit. Across the approximately 400 mm range of stature in the dataset, mean lap belt score differed by 21 mm, on average, or about half of the belt width. Mean lap belt score in the no-booster condition was significantly poorer in Pas1 compared with the other vehicles (p<0.001), but no other between-vehicle comparisons were significant in this condition.
ANOVA showed no significant interactions between boosters and vehicles for mean lap belt score. That is, differences across boosters in mean lap belt score were not
significantly affected by the vehicle in which the booster was placed. Lap belt fit was significantly better than the average across vehicles in Pas2, Pas3, and Suv2 (p<0.001), and significantly worse than the average across boosters in B32H, B34H, and B35H (p<0.001). Lap belt fit in the integrated booster levels (B37H and B37L) was not significantly different from the mean.
Shoulder Belt Fit
In the no-booster condition, the mean shoulder belt score was significantly lower in Suv2 than in the other vehicles; no other significant differences across vehicles were observed. Shoulder belt score was significantly related to stature:
Shoulder Belt Score, No Booster (mm) = -100 + 0.078 Stature, R2=0.12, RMSE = 25.4,
p<0.001
but the relationship was fairly weak. On average, shoulder belt score was higher for taller children (belt further outboard on the shoulder), with the approximate stature range in the data of 400 mm corresponding to a mean difference in shoulder belt score of 31 mm. After accounting for stature, no other anthropometric variables were significantly related to shoulder belt score in the no-booster condition.
In the no-booster condition, shoulder belt scores were significantly higher (indicating more-outboard belt placement on the child’s shoulder) than the average across vehicles in Suv1.
Across the booster conditions, shoulder belt scores were significantly but weakly related to stature:
Shoulder Belt Score, Booster (mm) = -42.8 + 0.052 Stature, R2=0.07, RMSE = 21.4,
34
After accounting for stature, no other anthropometric variables had significant effects. Shoulder belt scores were significantly higher in booster conditions B32H and B35H and significantly lower in B34H. No significant interactions between booster and vehicle were observed.
Posture: Variation with Vehicle
In the no-booster condition, child posture varied significantly across vehicles. Figure 35 shows box plots of the fore-aft locations of the children’s hip joint center locations (mean of left and right) and head CG locations. On average, hip locations are forward of seat H-point, but a substantial amount of variability is observed within vehicle. The relationship between hip and head CG, expressed as a torso recline angle, is also significantly
[image:43.612.125.459.262.484.2]different among vehicles, as shown in Figure 36.
35
Figure 36.Angle of hip-to-head-CG vector with respect to vertical for the no-booster condition across vehicles.
Comparison of Predicted and Observed Child Belt Fit
One goal of the current study was to assess the extent to which belt-fit predictions based on laboratory studies match in-vehicle data. The regression models used for this analysis were obtained in Reed et al. (2008), a laboratory study of forty-four boys and girls ages 5 to 12 in a wide range of vehicle seat and booster conditions. For the no-booster
conditions, a regression analysis gave
Lap Belt Score, No Booster (mm) = -93.8 + 0.0388 Stature + 0.455 LBA, R2adj = 0.34, RMSE = 11.5
and
Shoulder Belt Score, No Booster (mm) = -144.9 + 0.0824 Stature + 2.731 DRingYZAngle, R2adj = 0.31, RMSE = 25.3
The seat cushion length in these conditions was 471 mm, measured using the same techniques that were applied in the current study. Shortening the seat cushion to 400 mm improved lap belt fit by an average of 4 mm.
Figure 37 shows a plot of predicted lap belt score versus the mean observed score for no-booster conditions across vehicles. The correlation is 0.35, showing a statistically
36
to have a smaller range than the observed because the regression model used for
[image:45.612.160.438.161.412.2]prediction captured only about a third of the variance measured in the lab study. That is, in both the lab and in-vehicle studies, most of the variance in lap belt score for no-booster conditions is not accounted for by body size or the belt angle (or any other available predictors).
37
Figure 38.Observed mean lap belt score as a function of predicted shoulder belt score for no-booster conditions. Solid line is linear regression. Dashed line is 1:1.
ATD Belt Fit in Vehicle and Booster Conditions
Reed et al. (2008) demonstrated significant relationships between belt fit measured using the 6YO and 10YO Hybrid-III ATDs and belt fit measured on children. In the current study, belt fit was measured with the 6YO ATD in both booster and no-booster
38
Table 7. Mean Lap Belt Scores from ATD Belt Fit Measurements*
Booster Vehicle
Mnv1 Pas1 Pas2 Pas3 Suv1 Suv2
B00N -8 -19 -46 -37 -9 -12
B00N
(10YO*) -5 -9 NA -12 -16 -4
B12H NA NA -3 19 NA 12
B12L 23 26 24 21 NA 8
B32H -2 -2 -6 -3 -2 1
B34H -3 4 -14 -2 0 10
B35H 8 7 24 -10 14 1
B36H 15 14 0 17 17 20
B37H NA NA NA NA NA 27
B37L NA NA NA NA NA 14
* 6YO except where noted; 10YO data gathered only in no-booster condition
Table 8. Mean Shoulder Belt Scores from ATD Belt Fit Measurements*
Booster Vehicle
Mnv1 Pas1 Pas2 Pas3 Suv1 Suv2
B00N 55 38 40 -1 47 64
B00N
(10YO*) 42 26 NA 14 -15 67
B12H NA NA -17 -17 NA -18
B12L -15 11 -29 10 NA 31
B32H -43 -47 -48 -65 -36 -58
B34H 37 35 32 25 31 45
B35H -4 7 -25 -7 -28 -13
B36H -18 -3 4 -17 3 1
B37H NA NA NA NA NA -14
B37L NA NA NA NA NA 5
39
[image:48.612.172.434.234.464.2]Relationships Between Child and ATD Belt Fit
Figure 39 shows a plot of the observed mean child lap belt score across conditions as a function of the score predicted from 6YO ATD belt fit scores based on the relationships in Reed et al. (2008). The correlation is 0.69. The plot also shows the regression lines from Reed et al. (2008) for booster and no-booster conditions. The lap belt scores are consistently higher than predicted by an average of 15 mm. Note that this is the same discrepancy noted in the prediction of lap belt score from occupant stature and vehicle lap belt angle.
Figure 39.Observed mean child lap belt score as a function of 6YO ATD lap belt score. Each combination of vehicle and booster (triangle) and no-booster conditions (circles)
40
Figure 40.Observed mean child shoulder belt score as a function of 6YO ATD shoulder belt score. Each combination of vehicle and booster (triangle) and no-booster conditions (circles) are shown. Black line is linear regression. Red and blue lines are
41
DISCUSSION
Summary
This study is the first to quantify belt fit for children in a large range of in-vehicle
conditions with and without belt-positioning boosters. Boosters improved the average lap belt fit in all vehicles tested. However, the improvement in lap belt fit varied widely among boosters.
Although taller children on average experience better lap belt fit than shorter children, the effect is small compared to the improvement achieved by using a booster. In this study, an integrated booster seat produced belt fit comparable to the belt-fit observed with the add-on boosters that produced the best lap belt fit.
The trends in posture and belt fit among child volunteers were generally comparable to those observed in previous laboratory studies. In particular, longer seat cushions were associated with more slouched postures, with hip positions more forward on the seat and lower head positions.
The associations between belt fit and potential predictors, such as stature and belt anchorage locations, were similar to those observed in the previous laboratory studies. The most important difference concerned lap belt scores, which were systematically higher (better) by about 15 mm in the current study compared with Reed et al. (2008). Although we have not been able to definitively identify the reason for this difference, we believe that it is attributable to the use of three-dimensional, rather than planar,
calculations for belt locations relative to the pelvis.
Limitations
This study had several limitations. Subjects were seated in each condition for only a short period of time in stationary vehicles. Postures would likely vary over longer time periods and in vehicles drive on-road. The study captures “in-position” postures and belt fit; the current results do not consider the effect on child posture from vehicle maneuvers, sleeping, or fidgeting. Results are based on only six vehicles (one with integrated
booster) and six add-on boosters, and may vary for other vehicles and booster seats. The lap belt fit would be expected to be somewhat worse if the children wore clothing that was thicker than the standardized test garments used in this study.
Conclusions
42
2. All boosters improved belt fit, but the level of improvement differed markedly across boosters. The best-performing boosters produced similar belt fit regardless of the vehicle configuration.
3. An integrated booster in one vehicle produced belt fit comparable to the best-performing add-on boosters.
4. Child body size was only weakly associated with belt fit — even the largest children experienced improved belt fit when using boosters.
43
REFERENCES
Reed, M.P., Ebert-Hamilton, S.M., Manary, M.A., Klinich, K.D., and Schneider, L.W. (2005a). A new database of child anthropometry and seated posture for automotive safety applications. SAE Transactions: Journal of Passenger Cars - Mechanical Systems,
114:2222-2235
Reed, M.P., Ebert-Hamilton, S.M., and Schneider, L.W. (2005b). Development of ATD installation procedures based on rear-seat occupant postures. Stapp Car Crash Journal, 49: 381-421.
Reed, M.P., Ebert-Hamilton, S.M., Klinich, K.D., Manary, M.A., and Rupp, J.D. (2008a). Assessing Child Belt Fit, Volume I: Effects of Vehicle Seat and Belt Geometry on Belt Fit for Children with and without Belt Positioning Booster Seats. Technical Report UMTRI-2008-49-1. University of Michigan Transportation Research Institute, Ann Arbor, MI.
Reed, M.P., Ebert, S.M., Sherwood, C.P., Klinich, K.D., and Manary, M.A. (2009). Evaluation of the static belt fit provided by belt-positioning boosters. Accident Analysis and Prevention, 41:598-607.
44
[image:53.612.89.524.117.551.2]APPENDIX A: INSTRUCTIONS FOR EACH BOOSTER
Table A1 High Back Turbo Booster Instructions
MANUAL INSTRUCTIONS
TurboBooster Item Action
Component
Adjustments To ensure the correct head support height is obtained, the bottom of the headrest MUST be even with the top of child's shoulders as and the shoulder belt must be positioned in the red zone. If the belt lays across child's neck, head or face, readjust head support height.
Shoulder Belt Belt must pass underneath the armrests. Position shoulder belt through the shoulder belt guide. Fasten buckle and pull up on the shoulder belt to tighten. If the belt lays across child's neck, head or face, readjust support height.
Lap Belt Lap portion of lap/shoulder belt MUST be low and snug on hips, just touching thighs. The lap belt portion MUST pass under the armrests and be positioned low on the hips.
IN LAB INSTRUCTIONS
Adjust headrest so that it looks like this image.
Check belt fit at mid settings. Shoulder belt must be in router. Lap belt must be under armrests.
Shoulder belt must be under inboard armrest. If child does not try to tighten belt, ask them to do so. If lap belt has more than 2 inches of slack, ask the child to tighten it again.
Script:
• On your right side the lap belt goes under the armrest.
• On your left side both the lap and shoulder belt goes under the armrest.
45
Table A2 Backless Turbo Booster Instructions
MANUAL INSTRUCTIONS
TurboBooster Item Action
Component Adjustments
Shoulder Belt The shoulder belt MUST lay across the child's shoulders in red zone as shown. IF shoulder belt lays outside this zone, the shoulder belt positioning clip MUST be used.
Lap Belt The lap belt position MUST pass under the armrest and be positioned low on the hips. The belt MUST NOT be twisted.
IN LAB INSTRUCTIONS
Lap belt must be under armrests.
Shoulder belt must be under inboard armrest. Do not use the shoulder belt clip.
If child does not try to tighten belt, ask them to do so. If lap belt has more than 2 inches of slack, ask the child to tighten it again.
If the child cannot tighten the belt on their own, help – but let the child select the final tightness.
Script:
• On your right side the lap belt goes under the armrest.
46
Table A3 Generations Instructions MANUAL INSTRUCTIONS
Generations Item Action
Component Adjustments
Place the shoulder belt in the belt guide and adjust the headrest so its bottom is near, but above, the top of your child’s shoulders. NOTE: If the vehicle’s shoulder belt naturally crosses midway between your child’s shoulder and neck, you do not need to use the belt guide.
Shoulder Belt
The shoulder belt must cross midway between child's shoulder and neck. The shoulder belt MUST NOT cross the child’s neck or fall off the child’s shoulder. If you can not adjust the shoulder belt to properly lay midway between the child’s shoulder and neck, try another seating location or do not use the booster seat.
Lap Belt Placed low and snug across the child's hips, beneath the armrests, and fastened into the buckle. IN LAB INSTRUCTIONS
Adjust headrest so that it looks like this image.
Check belt fit at mid settings.
Shoulder belt must cross midway between child’s shoulder and neck.
Lap belt must be under armrests.
Shoulder belt must be under inboard armrest. If child does not try to tighten belt, ask them to do so.
If lap belt has more than 2 inches of slack, ask the child to tighten it again.
Script:
47
Table A4 Frontier 85 Instructions MANUAL INSTRUCTIONS
Frontier 85 Item Action
Component Adjustments
Adjust the head restraint so the shoulder belt guides position the vehicle belt at or just above the child's shoulders. The child's ears should be below the top of the head restraint.
Shoulder Belt Shoulder part of belt is routed through upper belt guide at or above the child's shoulder and does not contact the child's neck.
Lap Belt
Lap part of the vehicle belt must be routed low across the child's hips.
IN LAB INSTRUCTIONS
Adjust head rest so that it looks like this image.
Check belt fit at mid settings. Shoulder belt must be in router. Lap belt must be under arm rests.
Shoulder belt must be under inboard arm rest. If child does not try to tighten belt, ask them to do so.
If lap belt has more than 2 inches of slack, ask the child to tighten it again.
Script:
• On your right side the lap belt goes under the armrest.
• On your left side both the lap and shoulder belt go under the armrest.
48
Table A5 ProBooster Instructions MANUAL INSTRUCTIONS
ProBOOSTER Item Action
Component Adjustments
Your child's head must be centered vertically between the top and bottom of the head restraint. The red shoulder belt guide must be above the child's shoulder to allow for correct vehicle belt positioning.
Shoulder Belt
Route the lower portion of the vehicle belt closest to the vehicle buckle under the arm rest. Position the top portion of the shoulder belt into the red shoulder belt routing guide near the child’s ear. The shoulder belt should be flat against the child’s chest and collarbone. The shoulder portion of the vehicle seat belt system should NEVER be located across the child’s neck.
Lap Belt
Position the lap portion of the vehicle seat belt system through the red lower lap belt guides. Fasten the vehicle seat belt to the vehicle buckle. The vehicle buckle should be below the red lap belt guide. The lap belt should be positioned flat across the child’s lap or thigh area. It should not be lying against the child’s abdomen or ‘belly’. NEVER use a buckle that is too long and interferes with the red lap belt guide. IN LAB INSTRUCTIONS
Adjust head rest so that it looks like this image.
Check belt fit at mid settings. Shoulder belt must be in router. Lap belt must be under arm rests.
Shoulder belt must be under inboard arm rest. If child does not try to tighten belt, ask them to do so. If lap belt has more than 2 inches of slack, ask the child to tighten it again.
Script:
• On your right side the lap belt goes under the armrest.
• On your left side both the lap and shoulder belt go under the armrest.
49
Table A6 Alpha Omega Instructions MANUAL INSTRUCTIONS
Alpha Omega Elite Item Action
Component Adjustments
To help position the shoulder belt, you may need to secure the shoulder belt through one of the notches in the shoulder belt-positioning guide.
Shoulder Belt The shoulder belt should lay snugly across the center of the child's shoulders and across the chest (not on the face or neck).
Lap Belt Lap belt should cross the child's thighs.
IN LAB INSTRUCTIONS
Check belt fit at mid settings. Lap belt must be under arm rests.
Shoulder belt must be under inboard arm rest. If child does not try to tighten belt, ask them to do so.
If lap belt has more than 2 inches of slack, ask the child to tighten it again.
Script: