A Monthly Double-Blind Peer Reviewed Refereed Open Access International e-Journal - Included in the International Serial Directories International Research Journal of Natural and Applied Sciences (IRJNAS)
Website: www.aarf.asia. Email: [email protected] , [email protected] Page 47
FORMULATION OF FIG BASED FUNCTIONAL FOOD PRODUCTS AND
CHANGES DURING STORAGE
Anita Kumari*, Y S Dhaliwal and Anupama Sandal
Department of Food Science and Nutrition, College of Home Science, CSK Himachal Pradesh Krishi Vishvavidalaya, Palampur - 176 062, India.
ABSTRACT
The present investigation was undertaken with aim to analyze physico- chemical, nutritional,
proximate, mineral and functional constituent’s present in fig fruit and to develop functional
food products from highly nutritious indigenous fruit fig (Ficus palmate) of Himachal Pradesh.
The fruit contain good amounts of vitamin C, pectin and mineral content. The beverages like RTS
beverage squash and syrup was prepared from this fruit. Fig based ladoo were also prepared
with supplementation of amaranths in different proportions of fig powder : amaranths. The TSS,
acidity and reducing sugars increased while pH, ascorbic acid and total sugars decreased with
the increase of storage intervals. The prepared products were evaluated organoleptically to a
panel of 10 members at different storage intervals and the products were acceptable even up to
storage interval of 9 months at ambient conditions. The colour, taste, flavour and consistency of
all the products were found to be good.
A Monthly Double-Blind Peer Reviewed Refereed Open Access International e-Journal - Included in the International Serial Directories International Research Journal of Natural and Applied Sciences (IRJNAS)
Website: www.aarf.asia. Email: [email protected] , [email protected] Page 48 month of July- August. Fruits are usually slight sweet in taste. Locally the fruit is frequently used in dehydrated form and for curry and pickle preparation. By keeping in view the significance of
pectin and minerals. Attempts have been made to utilize this fruit for the formulation of functional beverages and ladoo supplemented with amaranths in different proportions of fig powder to amaranths
Materials and Methods
The fruitwas procured from Kangra district of Himachal Pradesh while amaranth was procured from local market. The fruits were sorted, graded and washed under running tap water to remove adhering dirt etc. The fruit was analyzed for their physico-chemical analysis. The specific parameters viz fruit colour, flesh colour and shape were assessed by visual appearance. Physical methods viz., length and breadth of the fruit were assessed by using vernier caliper. The weight of the fruit was assessed by electronic weighing balance. The TSS and pH content was measured by hand refractometer and pH meter, respectively. The moisture, protein, fat, ash and fibre and sugars were estimated by (AOAC 1990). The carbohydrates were determined as (NIN 1983).
Total carbohydrates (%) = 100- (moisture %+ protein %+ fat % + fibre % + ash %)
A Monthly Double-Blind Peer Reviewed Refereed Open Access International e-Journal - Included in the International Serial Directories International Research Journal of Natural and Applied Sciences (IRJNAS)
Website: www.aarf.asia. Email: [email protected] , [email protected] Page 49 Sample preparation: The procured fruits were washed thoroughly under running tap water. The fruits were cut into small pieces and steamed for 4 minutes. The boiled material was cooled to room temperature and grounded into a domestic grinder to obtain homogeneous pulp. The pulp
was sieved with the help of muslin cloth. 1.0g sodium benzoate was added to 1 litre of pulp and stored in pre-sterilized glass bottles for preparation of functional beverages. The fruits were dried to make fig powder for the preparation of ladoo. The functional beverages were prepared as per the FPO specifications. The prepared beverages were heated to 850C, poured in to sterilized 200ml bottles, sealed with crown cork and heat processed by dipping in boiling water for 20 minutes at 85 0C. The beverages were assessed for their nutritional analysis as per the methods (Ranganna, 2007). The 9 point Hedonic scale (Larmond, 1977) was employed for the sensory evaluation of prepared products. The prepared products were evaluated organoleptically for colour, taste, flavour, texture/consistency and overall acceptability to a panel of 10 judges by using 9 point Hedonic scale.
Result and Discussion
The specific parameters of Ficus palmate fruit shows that the fruit and flesh colour was observed as violet and deep pink with coniele shape. The fruit had fuzzy skin and slight sweet in taste. The flesh firmness was soft and gritty. The mean values for length, breadth and weight were recorded as 2.08 (cm), 2.02 (cm) and 3.52 (g), respectively. The specific gravity of the fruit was 0.84 g/ml. The mean values for TSS (0B), pH, acidity (%), total sugar, reducing sugar and non-reducing sugars were reported as 19.00, 3.16, 0.76, 16.36, 10.46 and 5.90 respectively. The data on proximate composition reveal that moisture, fat, fibre, ash, protein and total carbohydrate contents were reported as 79.18, 0.46, 1.41, 0.83, 2.27and 15.85 per cent, respectively. The
dietary fibre constituents viz., NDF, ADF and hemi-cellulose contents were noted as 11.20, 6.26 and 4.93 per cent. The results of the present investigation are in aggrement with Gopalan et al
A Monthly Double-Blind Peer Reviewed Refereed Open Access International e-Journal - Included in the International Serial Directories International Research Journal of Natural and Applied Sciences (IRJNAS)
Website: www.aarf.asia. Email: [email protected] , [email protected] Page 50 Table 2 shows functional constituents vitamin C, b- carotene, vitamin A, anthocyannin and pectin contents were noted as 3.73mg/100g, 168.34mg/100g, 280.56 (I.A), 5.10 and 2.86 per cent, respectively. The data on mineral content shows that the fruit had highest content of
potassium (326.66 mg/100g) while the mean values for calcium, phosphorous, magnesium and iron were 88.86, 34.17, 0.79 and 2.79 mg/100g, respectively.
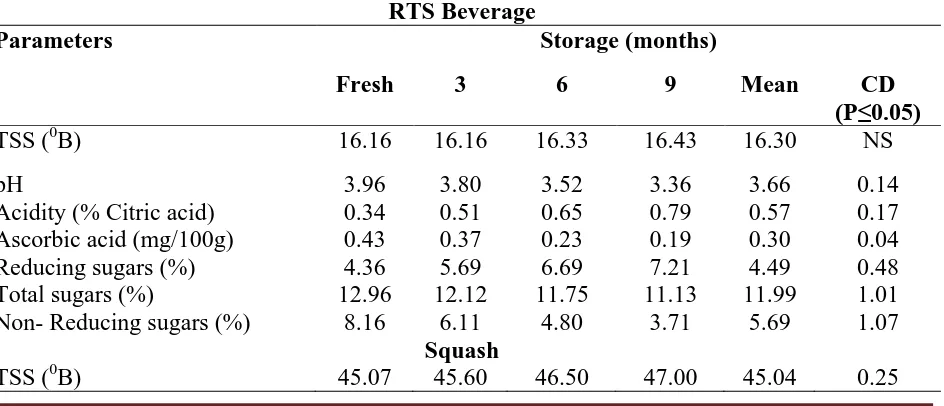
Quality evaluation of fig based value added products i RTS beverage
The TSS of RTS beverage varied non-significantly from 16.16 to 16.430B when compared with each other. A slight elevation was seen in the TSS value of RTS beverage during 6 to 9 month of storage interval. The slight increase in TSS during storage might be due to the solubilization of solids present in the juice and another reason might be due to conversion of polysaccharides in to simple sugar. The present findings are in conformity with the findings of Das et al. (2009). The data with respect to pH and acidity content reveal that the pH content significantly decreased during storage from 3.96 to 3.36 while acidity increases significantly from 0.34 to 0.79 (% citric acid). The mean values for pH and acidity were reported as 3.66 and 0.57 per cent, respectively. A decrease in pH values might be due to conversion of protein into amino acids which leads to increase in acidity, breakdown of pectin into pectic acid and ascorbic acid to dehydro ascorbic acid whereas, an increase in acidity may be due to formation of organic acid by ascorbic acid degradation. Shivani (2011), Das et al. (2009), Krishnaveni et al. (2001) and Roy et al. (1997) reported similar observations for pH and acidity in nectarine, jamun, jack fruit and mango based RTS beverages, respectively. The data on ascorbic acid content shows declining trend from 0.43 to 0.19 mg/100g at the initial day of storage and the values varied
A Monthly Double-Blind Peer Reviewed Refereed Open Access International e-Journal - Included in the International Serial Directories International Research Journal of Natural and Applied Sciences (IRJNAS)
Website: www.aarf.asia. Email: [email protected] , [email protected] Page 51 the reducing sugars might be due to the hydrolysis of non-reducing sugars into reducing sugar. Similar observations were recorded by Rao et al. (1997) and Shivani (2011). A slight increase in the total sugars might be due to hydrolysis of polysaccrides like pectin and starch into simple
sugars. The results are in confirmation with Krishnaveni et al. (2001) for jack fruit based RTS beverage.
ii Squash
The data reveals that the TSS values differed significantly with the increase in storage period. The mean value for TSS was recorded as 45.04. Das (2009) studied storage stability of jamun, squash and found an increase in TSS from 48.00 to 50.28oB from initial day of storage to 60 days of storage. The pH content decreased with the increase of storage intervals and the values for fresh, 3, 6 and 9 months were reported as 3.00, 2.97, 2.93 and 2.78, respectively. The decrease in pH may be due to certain chemical reaction taking place during storage such as maillard reaction, thus leading to the production of organic acid. Similar trend was noted by Sethi (1993) and Shivani (2011) in litchi and nectarine squash during storage of 6 months. The values for acidity during storage had non-significant effect with initial value recorded as 1.15 which increased to 1.36 per cent as citric acid during storage of 9 months. The results are in confirmation with Roy et al. (1997), Das (2009) and Shivani (2011). The ascorbic acid content varied non-significantly up to 6 months of storage when compared with the values of fresh. After 6 months of storage, there was a significant reduction in ascorbic acid content. The ascorbic acid content for fresh was reported as 1.02 which decreased to 0.73 mg/100g at 9 month of storage. Das (2009) while working on storage stability of jamun squash observed a decrease in ascorbic acid content from 17.60 to 15.20 mg/100g during 6 months of storage.. A significant difference
A Monthly Double-Blind Peer Reviewed Refereed Open Access International e-Journal - Included in the International Serial Directories International Research Journal of Natural and Applied Sciences (IRJNAS)
Website: www.aarf.asia. Email: [email protected] , [email protected] Page 52 The decrease in non reducing sugars might be due to hydrolysis of non-reducing sugars to reducing sugars during storage while slight elevation in total sugars might be due to hydrolysis of polysaccrides like pectin and starch into simple sugars. Similar observations were made by
Shivani (2011), Sethi (1993) and Roy et al. (1997). iii Syrup
The data on TSS content showed that storage had non-significant effect on TSS. The TSS ranged from 65.06 to 65.26oB. A slight increase in TSS was reported by Walia (2010). However Das (2009) reported initial value for TSS as 65oB which increased to 65.88oB during 6 months of storage. The pH content for fig syrup decreased with the increase of storage months. The pH values for fresh, 3, 6 and 9 months were varied significantly with reported values as 2.05, 2.09, 1.89 and 1.82, respectively. However, the data on acidity (% citric acid) revealed that the per cent acidity increased from 2.26 to 2.47, the values for fresh and 3 month varied non-significantly and thereafter a significant difference was noticed. The mean ascorbic acid content for fig based syrup at fresh was noted as 1.07 mg/100 g which gradually decreased to 0.75 mg/100g during 9 month of storage period. The results are in line with Walia (2010) and Kotecha and Kadam (2003) who observed an increase in acidity and decrease in ascorbic acid content during storage. According to Das (2009) the acidity increased and ascorbic acid content decreased from 1.20 to 1.37 per cent and 20.0 to 19.0 mg/100 g, respectively. The per cent mean values for reducing, total and non-reducing sugars were reported as 41.32, 58.93 and 16.71 per cent, respectively. The findings are in accordance with Walia (2010). As far as total and non reducing sugars are concerned, it is evident from the table that the values for total and non-reducing sugars decreased from 61.51 to 55.99 and 21.69 to 11.26 per cent, respectively. Similar
findings have been reported by Walia (2010) and Kotecha and Kadam (2003) in bamboo and tamarind syrup, respectively.
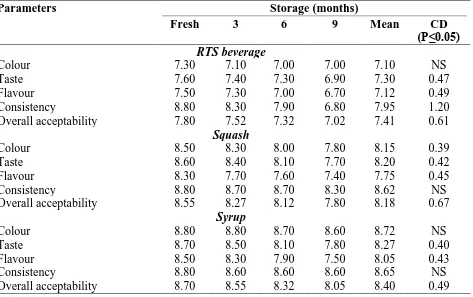
Organoleptic evaluation of the functional beverages
A Monthly Double-Blind Peer Reviewed Refereed Open Access International e-Journal - Included in the International Serial Directories International Research Journal of Natural and Applied Sciences (IRJNAS)
Website: www.aarf.asia. Email: [email protected] , [email protected] Page 53 a significant change in colour was observed. Decrease in scores for colour might be due to certain chemical reaction which might have taken place during storage. A significant decrease in scores for, taste, flavor and consistency was observed during storage of all beverages. The
decrease in scores for taste and flavor might be due to degradation of volatile substances. Shivani (2011) observed a gradual decrease in organoleptic scores for nectarine squash whereas Sethi (1993) reported that litchi squash was found to be organoleptically acceptability up to 4 months of storage at room temperature and 6 months of storage at low temperature. Walia (2010) reported similar observations in bamboo syrup while Kotecha and Kadam (2003) reported that overall acceptability scores for tamarind syrup stored for 180 days decreased from 8.17 to 7.11. The overall acceptability of RTS beverage, squash and syrup decreased from 7.80 to 7.41, 8.55 to 8.18 and 8.70 to 8.40, respectively.
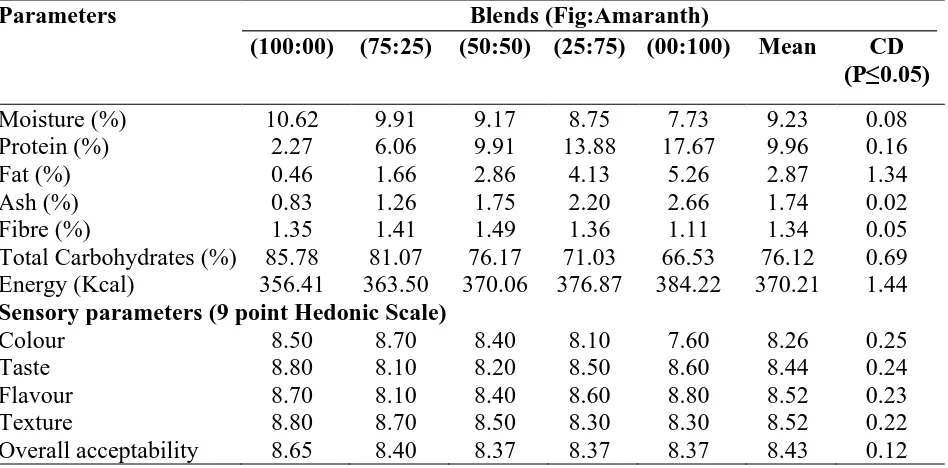
iv Ladoo
Data presented in Table 5 shows effect of blending on nutritional and sensory scores of fig amaranth based ladoo. From the results obtained, it has been observed that the values for different parameters for all the blends varied significantly. The data on per cent moisture content reveal that highest per cent moisture was reported in 100:00 (10.62), followed by 75, 50, 25 and 100 per cent blending of amaranth with reported values as 9.91, 9.17, 8.75 and 7.73 per cent, respectively. Sood (2011) reported similar trend in different concentrations of amaranth-chenopodium based ladoo. The blending of amaranth resulted in an increase in protein, fat and ash content. The mean values corresponding to protein, fat and ash content were 9.96, 2.87 and 1.74 per cent, respectively. Sood (2006) observed similar observation in amaranth-chenopodium based ladoo. The fibre content was reported highest in ladoo when prepared in proportions of
50:50 (1.49 %). The results with respect to carbohydrate content reveal that as the concentration of amaranth increases, the per cent total carbohydrate content decreases. The maximum carbohydrate content was found in pure fig based ladoo (85.78 %). However, the maximum total energy content was reported in control amaranth ladoo (384.22 Kcal/100g) and the minimum calorie content was found in pure fig ladoo (356.51 Kcal/100g).
A Monthly Double-Blind Peer Reviewed Refereed Open Access International e-Journal - Included in the International Serial Directories International Research Journal of Natural and Applied Sciences (IRJNAS)
Website: www.aarf.asia. Email: [email protected] , [email protected] Page 54 proportion. The maximum score for colour was observed for 75:25 (8.70). The maximum scores for taste were observed for pure fig based ladoo (8.80) and thereafter for control amaranth ladoo
(8.60). The scores for flavour and consistency ranged from 8.70 to 8.80 and 8.80 to 8.30 for
100:00 to 0:100 proportions of fig:amaranth. On a whole, the pure fig based ladoo was liked very much than other blending proportions. The overall acceptability of the product decreases with the increased concentrations of amaranth.
Table 1. Specific parameters of Fig (Fycus palmate)
Parameters Observations/ Mean values Specific parameters
Fruit colour Violet
Flesh colour Deep pink
Shape Coniele
Taste Slightly sweet
Flesh firmness Gritty and granular
Physical parameters
Length (cm) 2.08
Breadth (cm) 2.02
Weight (g) 3.52
Specific gravity (g/ml) 0.84
Nutritional parameters
TSS (0 B ) 19.0
pH 3.16
Acidity (% Citric acid) 0.76
Ascorbic acid (mg/100g) 16.36
Reducing sugars (%) 10.46
Total sugars (%) 5.90
Non- reducing sugars (%) 4.92
Proximate composition
Moisture (%) 79.18
Fat (%) 0.46
Fibre (%) 1.41
Ash (%) 0.83
Protein (%) 2.27
Total carbohydrates (%) 15.85
Other parameters
NDF (%) 11.20
ADF (%) 6.26
A Monthly Double-Blind Peer Reviewed Refereed Open Access International e-Journal - Included in the International Serial Directories International Research Journal of Natural and Applied Sciences (IRJNAS)
Website: www.aarf.asia. Email: [email protected] , [email protected] Page 55 Available Carbohydrates (%) 6.04
Unavailable Carbohydrates (%) 11.06
Total Energy (Kcal/100g) 82.04
Available Energy (Kcal/100g) 37.48 Anti- nutritional Parameters
Tannins (%) 0.32
Simple Phenols (%) 14.99
[image:9.612.69.446.243.411.2]Total Phenols (%) 15.31
Table 2: Functional constituents in fig fruit Functional constituents
Vitamin C (mg/100g) 3.73
B- Carotene (mg/100g) 168.34
Vitamin A (I.U) 280.56
Anthocyanin (mg/100g) 5.10
Pectin (%) 2.86
Minerals
Calcium (mg/100g) 88.86
Phosphorous (mg/100g) 34.17
Magnesium (mg/100g) 0.79
Iron (mg/100g) 2.79
Potassium (mg/100g) 326.66
Table 3. Effect of storage on the nutritional parameters of Beverages RTS Beverage
Parameters Storage (months)
Fresh 3 6 9 Mean CD (P≤0.05)
TSS (0B) 16.16 16.16 16.33 16.43 16.30 NS
pH 3.96 3.80 3.52 3.36 3.66 0.14
Acidity (% Citric acid) 0.34 0.51 0.65 0.79 0.57 0.17 Ascorbic acid (mg/100g) 0.43 0.37 0.23 0.19 0.30 0.04 Reducing sugars (%) 4.36 5.69 6.69 7.21 4.49 0.48 Total sugars (%) 12.96 12.12 11.75 11.13 11.99 1.01 Non- Reducing sugars (%) 8.16 6.11 4.80 3.71 5.69 1.07
Squash
[image:9.612.75.547.501.704.2]A Monthly Double-Blind Peer Reviewed Refereed Open Access International e-Journal - Included in the International Serial Directories International Research Journal of Natural and Applied Sciences (IRJNAS)
Website: www.aarf.asia. Email: [email protected] , [email protected] Page 56
pH 3.00 2.97 2.93 2.78 2.91 0.02
Acidity (% Citric acid) 1.15 1.24 1.32 1.36 1.27 NS Ascorbic acid (mg/100g) 1.02 0.93 0.89 0.73 0.89 0.15 Reducing sugars (%) 13.42 14.74 15.89 16.89 15.23 1.30 Total sugars (%) 40.02 39.48 38.66 36.42 38.64 0.84 Non- Reducing sugars (%) 25.96 23.49 21.62 18.53 22.40 2.84
Syrup
TSS (0B) 65.06 65.06 65.20 65.26 65.14 NS
pH 2.05 2.09 1.89 1.82 1.96 0.02
Acidity (% Citric acid) 2.26 2.34 2.39 2.47 2.36 0.12 Ascorbic acid (mg/100g) 1.07 1.02 0.89 0.75 0.93 0.11 Reducing sugars (%) 38.66 39.90 42.62 44.12 41.32 1.51 Total sugars (%) 61.51 60.51 57.71 55.99 58.93 2.08 Non- Reducing sugars (%) 21.69 19.58 14.33 11.26 16.71 2.14
Table 4. Effect of storage on sensory parameters (9 point hedonic Scale) of fig based products
Parameters Storage (months)
Fresh 3 6 9 Mean CD (P≤0.05)
RTS beverage
Colour 7.30 7.10 7.00 7.00 7.10 NS
Taste 7.60 7.40 7.30 6.90 7.30 0.47
Flavour 7.50 7.30 7.00 6.70 7.12 0.49
Consistency 8.80 8.30 7.90 6.80 7.95 1.20
Overall acceptability 7.80 7.52 7.32 7.02 7.41 0.61 Squash
Colour 8.50 8.30 8.00 7.80 8.15 0.39
Taste 8.60 8.40 8.10 7.70 8.20 0.42
Flavour 8.30 7.70 7.60 7.40 7.75 0.45
Consistency 8.80 8.70 8.70 8.30 8.62 NS
Overall acceptability 8.55 8.27 8.12 7.80 8.18 0.67 Syrup
Colour 8.80 8.80 8.70 8.60 8.72 NS
Taste 8.70 8.50 8.10 7.80 8.27 0.40
Flavour 8.50 8.30 7.90 7.50 8.05 0.43
Consistency 8.80 8.60 8.60 8.60 8.65 NS
[image:10.612.75.548.366.663.2]A Monthly Double-Blind Peer Reviewed Refereed Open Access International e-Journal - Included in the International Serial Directories International Research Journal of Natural and Applied Sciences (IRJNAS)
Website: www.aarf.asia. Email: [email protected] , [email protected] Page 57 Table 5. Effect of blending on nutritional and sensory parameters of fig amaranth based
ladoo
Parameters Blends (Fig:Amaranth)
(100:00) (75:25) (50:50) (25:75) (00:100) Mean CD (P≤0.05) Moisture (%) 10.62 9.91 9.17 8.75 7.73 9.23 0.08 Protein (%) 2.27 6.06 9.91 13.88 17.67 9.96 0.16
Fat (%) 0.46 1.66 2.86 4.13 5.26 2.87 1.34
Ash (%) 0.83 1.26 1.75 2.20 2.66 1.74 0.02
Fibre (%) 1.35 1.41 1.49 1.36 1.11 1.34 0.05
Total Carbohydrates (%) 85.78 81.07 76.17 71.03 66.53 76.12 0.69 Energy (Kcal) 356.41 363.50 370.06 376.87 384.22 370.21 1.44 Sensory parameters (9 point Hedonic Scale)
Colour 8.50 8.70 8.40 8.10 7.60 8.26 0.25
Taste 8.80 8.10 8.20 8.50 8.60 8.44 0.24
Flavour 8.70 8.10 8.40 8.60 8.80 8.52 0.23
Texture 8.80 8.70 8.50 8.30 8.30 8.52 0.22
Overall acceptability 8.65 8.40 8.37 8.37 8.37 8.43 0.12
References:
1. AOAC., (1990). Approved methods of association of official analytical chemists, Washington D.C, U.S.A, 11th edition, P- 240.
2. Das, J.N., (2009). Studies on storage stability of jamun beverages,. Indian Journal of Horticultur, 66 (4), 508-510.
3. Gopalan. C., Rama Sastri, B.V., & Balasubramanan. (2004). Nutritive value of Indian foods. National Institute of Nutrition, Indian Council of Medical Research.
4. Kotecha, P.M. & Kadam, S.S. (2003). Preparation of Ready- to- Serve beverage, syrup and concentrate from tamarind, Journal of Food Science and Technology, 40 (1), 76-79.
[image:11.612.73.547.131.365.2]A Monthly Double-Blind Peer Reviewed Refereed Open Access International e-Journal - Included in the International Serial Directories International Research Journal of Natural and Applied Sciences (IRJNAS)
Website: www.aarf.asia. Email: [email protected] , [email protected] Page 58 6. Larmond, E. (1977). Laboratory methods for sensory evaluation of foods Canada. Department of Agricultural Publications, 1637, Food Research Institute, Ottawa; Ontaria: 73.
7. Mekker, H.P.S., Blummel, M., Borowy, N.K., & Becker, K. (1993). Gravimetric determination of tannins and their correlation with chemical and protein precipitation methods, Journal of Science of Food and agriculture, 61, 161-165.
8. NIN. (1983). A manual of laboratory techniques, National Institute of Nutrition, Hyderabad.
9. Ranganna, S. (2007). Handbook of analysis and quality control for fruits and vegetables products, 3rdEdition, Tata Mcgraw – Hills, 25-45
10. Roy, A.K., Joshi, S., & Nath, N. (1997). Effect of homogenization on sensory quality and rheological characteristics of pulp and beverages from ripe ‘Dushehari’ mangoes.
Journal of Food Science and Technology. 34 (3), 212-217.
11. Saravana. Kumar. R., & Manimegalai, C. (2005). Studies on storage stability of whey- based papaya juice blended RTS beverage, Journal of Food Science and Technology, 42(2), 185- 188.
12. Sethi, V.(1993). Changes in physico-chemical characteristics of litchi squash during storage at different temperatures, Indian Journal of Horticulture, 50 (4), 327-332.
13.Shivani. (2011). Preparation and quality evaluation of nectarine (Prunus persica) based value added products, M.Sc. Thesis, CSK Himachal Pradesh Krishi Vishwavidyalaya, Palampur.
14.Sood, P. (2006). Physico-chemical and nutritional evaluation of wild fruits of Himachal
Pradesh, M.Sc. Thesis, CSK Himachal Pradesh Krishi Vishvavidyalaya, Palampur.
A Monthly Double-Blind Peer Reviewed Refereed Open Access International e-Journal - Included in the International Serial Directories International Research Journal of Natural and Applied Sciences (IRJNAS)
Website: www.aarf.asia. Email: [email protected] , [email protected] Page 59 16. Van Soest, P.J., & Wine, R.H. (1967). Use of Detergent in the analysis of fibrous foods, determination of plant cell wall constituents, Journal of association of official analytical chemistry, 50:50.