2019 International Conference on Computer Intelligent Systems and Network Remote Control (CISNRC 2019) ISBN: 978-1-60595-651-0
A Research on Theft Crime Based on SARIMA
Model and Improved X13-ARIMA-SEATS Model
Qi Zhang
ABSTRACT
This thesis takes the theft crime data of a city as the research object and analyses the time pattern of theft crime, hoping to be able to provide the public security organs certain decision-making reference for preventing and reducing the theft crime. SARIMA model and improved X13-ARIMA-SEATS model were established based on the time series data. The model with higher precision accuracy is selected to analyse the time pattern of theft crime. Through modelling, we can respectively determine the SARIMA prediction model and the improved X13-ARIMA-SEATS model. After that, two models are used for in-sample prediction. By comparing the prediction accuracy of the two models, it can be found that the prediction accuracy of X13 - ARIMA-SEATS Model is higher. Therefore, X13-ARIMA-SEATS Model is chosen to analyse the optimal time model for theft crime. Through this model, we can analyse the time pattern of theft crime data.
KEYWORDS
SARIMA model, Improved X13-ARIMA-SEATS model, Theft crime, Time pattern.
INTRODUCTION
Theft Crime, accounts for about 80% and leads the trend of that. The world's police in fighting crimes gradually change from the passive response to the active prevention. It is increasingly important for crime data storage, analysis and prediction. This establishes the foundation for our analysis and research of crime data. Theft crime has strong time pattern, and studying its time pattern is helpful to analyse and predict the crime of theft. At present, domestic research results on the time pattern of theft crimes mainly focus on the basic descriptive statistical level. Compared with foreign studies, our research is not deeply enough, but some
________________________________________
scholars use mathematical or statistical models to study the time pattern, such as analysing the time series data of theft crimes based on the X11 seasonal adjustment method[1]. There are many methods commonly used in seasonal time series analysis, including seasonal decomposition method, concentration degree method, circular distribution method, ARIMA model, SARIMA model[2], X12 seasonal adjustment method, X11-ARIMA model[3], X12-ARIMA model[4], X13-ARIMA model, as well as TRAMO SEATS model. paper makes analysis by both SARIMA model and X13-ARIMA-SEATS the effect of the mobile holidays (the Spring Festival, Tomb-sweeping Day, Dragon Boat Festival and Mid-Autumn Festival) has to be considered. PBC (department of investigation and statistics of the people's bank of China)
This X13-ARIMA-SEATS model is an improvement of the X12-ARIMA model. It a combination of X12-ARIMA model and the seasonal adjustment function of TRAMO SEATS model. As for Chinese data, developed the X12-ARIMA module with added Chinese Spring Festival effect based on EViews software, but it is only for internal using[5]. In this thesis, there are two methods, which are SARIMA model and X13-ARIMA-SEATS model, are used to compare and predict the data of theft crimes in r language[5].
DATA PREPROCESSING AND RESEARCH METHODS
DATA SOURCE AND PRE-PROCESSING
The theft crime data is from 2012 to 2018, according to the time shall be carried out in accordance with the in summary form monthly data from 2012 to 2018, with undergoing data cleaning and removing duplicate items. Specifically, because leap year and the length of month will have impact on the number of monthly theft cases, monthly data is divided by the number of days of that month, to show the average of crimes in each day during the month. Then assuming that there are 30 days per month, the average values are multiplied to 30, for the purpose of eliminating the influence of leap year effect and the length of month effect on the quite amount of theft cases.
RESEARCH METHODS
A.SARIMA model. The SARIMA is abbreviated as
( , , )( , , )s
φ
p( )B ΦP(Bs)(1−B) (1d −Bs D) Yt =θ
q( )B ΘQ( )Bε
t (1)t
Y in formula (1) represents the research of time series.
ε
t represents asequence of the random components in a time series.
B
means the backward shift operator; p and q are the order of autoregressive and moving average, d is the difference order, P and Q are the order of seasonal autoregressive and moving average, D is the seasonal difference order; S is the seasonal period.B. X13-ARIMA-SEATS Model. X13-ARIMA-SEATS model is the improvement of X12-ARIMA model, and it mainly includes X12 and regARIMA module. The X13 module uses the iterative moving average method to decompose the sequence into long-term trend, seasonal component and irregular component. The regARIMA module is mainly used to correct and remove the influences of various outliers, holidays and other factors to extend the sequence forward and backward. The model adjustment process is that, firstly, returning various regression factors, and getting rid of significant effects, and preceding the sequence extension by regARIMA module. Then use the X13 module to adjust seasonality. Each component in the data was adjusted and separated iteratively for many times. Finally, the three components were predicted separately and the total sequence was predicted based on the addition model.
RESULTS ANALYSIS OF SARIMA MODEL AND X13-ARIMA-SEATS MODEL
ANALYSIS OF DATA CHARACTERISTICS OF THEFT CRIME DATA
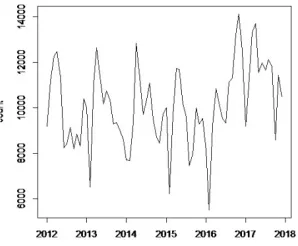
Figure 1. Statistical table of theft cases in a city from 2012 to 2017 (monthly statistics).
According to Figure 1, the characteristics of the data can be preliminarily judged. The data has certainly tendency and seasonal periodicity. First, the overall sequence shows an upward trend, but the trend is not obvious, which needs further verification. Secondly, the series has seasonal periodicity with year as the unit. From January to February of each year, it is in the low point of case
occurrence, and April is the peak. Next, the theft crime data (setting upyt;
regard “t” as the time series) will be analysed and predicted by SARIMA model and X13-ARIMA-SEATS model.
MODELLING OF SARIMA MODEL
STATIONARY TEST
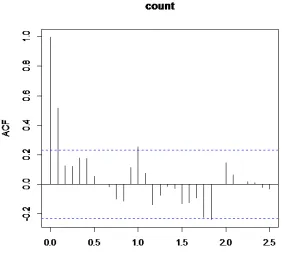
By observing the autocorrelation diagram and partial correlation diagram of
theft crime data (yt) (Figure 2).The autocorrelation has a certain feature of
Figure 2. Original data column autocorrelation diagram.
Figure 3. Autocorrelation diagram (left) and partial autocorrelation diagram (right) of the sequence after first-order difference and first-order 12-step difference.
MODEL ORDERING
After stationary test, the seasonal cycle length
s
=
12,
d
=
1,
D
=
1
. The Fig.3 [image:5.612.187.422.288.424.2]PARAMETER ESTIMATION AND MODEL TEST
After repeated debugging of modelling by the maximum likelihood estimation method in r language, all the models in the 9 groups have statistical significance in formula (2). But AIC=1041.51 in 12
(1,1, 2)(0,1,1)
ARIMA model is the
smallest. Therefore, this model is selected as the optimal model. The specific data expression is:
12 2 12
(1−B)(1−B )(1 0.738 )+ B yt =(1 0.429 )(1 0.571− B + B )(1 0.999+ B )εt
(2)
In formula (2), B is delay operate.
ε
t is residual error sequence. Foralternative models, t-statistic was used to test the significance of all parameters, and all are passed, and then Box-Ljung residual test was carried out. The results showed
p value
−
=
0.9459( 0.05)
>
.So through 12(1,1, 2)(0,1,1)
ARIMA , the residual of
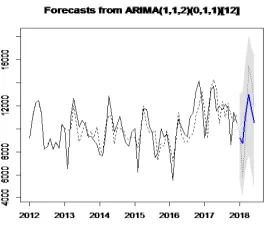
[image:6.612.235.369.422.537.2]the predicted column and the original sequence is white noise, so the model fitting is sufficient. This model can be used to predict the theft crime data from January to June in 2018. The actual value and the fitting value as well as the predicted value in the sample are shown in Figure 4. The average absolute percentage error of the prediction isMAPE=20.3%.
Figure 4. Comparison of predicted value, fitting value and actual value of the model.
MODELLING OF IMPROVED X13-ARIMA-SEATS MODEL
DATA PRE-PROCESSING
weekday effect, but the model in r language is based on the US calendar. Weekday effect and trading day effect impact on data is so slight that no need considering. The leap year effect and the length of month effect have been eliminated by averaging above; the fixed holiday effect is the component of seasonal factors in the month. So only the moving holiday calendar effects need to consider. Due to the time of the tomb-sweeping day, dragon-boat festival and Mid-autumn festival are too short to influence theft crime cases, so they can be neglected. So only the effect of the Spring Festival needs to consider. The X13-ARIMA-SEATS model was improved based on these factors. The first step is to eliminate the influence of Spring Festival factors on the data and then to do X13-ARIMA-SEATS process. Assuming that the impact of the Spring Festival reaches n days, including before the festival, during the festival and after the festival, and the influence on the number of
theft cases is equal in daily life. If Spring Festival affects n1 days in January
and n2 days in February, the variable values is n n1/ in January,n2/nin
February, and 0 in the other months (if affectsn3day in March, the value of the
variable isn3/n). By regressing the theft crime variable with Spring Festival
variable[5], t-statistics shows that the influence of Spring Festival factors on theft crime data is significant. Theft crime data excluding the influence of the
Spring Festival factors is set asyt.
RE-ADJUSTMENT RESULTS OF REGARIMA MODULE
According to the identification of X13-ARIMA-SEATS model, the data excluding Spring Festival doesn’t need logarithmic transformation and which is suitable for addition model. In other words, the theft crime data (excluding the
influence of Spring Festival) yt can be decomposed into the sum of trend
composition sequence ytT , seasonal composition sequence S t
y and irregular
composition sequenceytI. In regARIMA module, to eliminate the Spring Festival
effect the theft of data sequences to construct regARIMA module (ARIMA model combination regression).Through the model identification, it will recognize 11 outliers in total and according to the t statistic test of significance are passed. They are automatically removed and replaced. Building ARIMA model to
establish regression residual and ensureARIMA(1, 0, 0)(1, 0, 0)12 as the structural
model of residual after regression, the regARIMA mathematical expression is:
12
1-0.676 )(1 0.245 ) (B − B yt−10563.3)=εt
F statistics show that there is no seasonal component in the residual sequence of equation (3). RegARIMA module comes to the X11 seasonal adjustment stage after regARIMA expands the sequence.
X13 SEASONAL ADJUSTMENT RESULTS
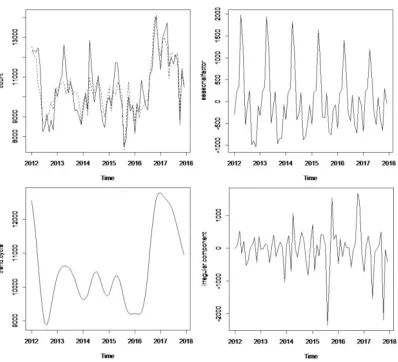
[image:8.612.198.397.469.650.2]Data from the X13 module are decomposed into three components: season, trend and irregularity (Figure 5). (1) The data are smoother after seasonal adjustment, which more clearly reflects the change of theft crimes in 2012-2017. According to the Q statistic test, the seasonal adjustment effect of X13-ARIMA-SEATS model is sufficient (Q=0.89<1). (2) Upper right in Fig. 5 shows that theft crimes without effect of the Spring Festival have certain seasonal characteristics. From February to May of each year is the peak, which reaches the peak in April, and the level from June to January of the next year is low, and a small peak appears in August and December respectively. Kruskal-wallis chi-square test and F statistic test show that the sequence has identifiable seasonality, but there is no moving seasonality. (3) The figure on the left bottom confirms further the changing trend of seasonal adjustment data. (4) The figure on the right bottom shows that the irregular component is the result of other factors, and its influence is not very great in most months.
Figure 5. Comparison of data before and after seasonal adjustment (upper left), seasonal composition (upper right), trend composition (bottom left)
TOTAL SEQUENCE PREDICTION BASED ON DECOMPOSED COMPONENTS
The modelling of trend, season and irregular components based on X13 decomposition is conducive to the rational analysis of the influence of trend, season and irregular factors. In view of the ARIMA model of short-term prediction accuracy is higher. We establish the ARIMA model to forecast of each component and through the model test and parameter estimation. The trend
component ( T t
y ), seasonal component (
y
tS) and irregular composition ( I ty )
prediction model are:
2 3 12 24
(1 )(1 2.414 )(1 2.135 )(1 0.675 )(1 0.82 )(1 0.489 ) T (1 0.262 )
t t
B B B B B B y Bε
− − + − + + = −
(1 12)(1 0.858 12) S (1 0.251 12)
t t
B B y B ε
− − = − (4)
12 24
(1 0.233 )(1 0.303 )
I
t t
y = + B + B ε
The parameter significance (t statistic) and the residual sequences (Box-Ljung) of the three models in formula (4) all passed the test. P-values were all greater than 0.05, which means the residual values of the three models were all white noise, so the fitting effect of the three models was good. The above three models can be used to predict the theft crime from January to June 2018 to get trend component, seasonal component and irregular component respectively predicted value. Then according to the additive model, theft crime in January to June 2018 (assuming 30 days per month) without the Spring Festival factor can be predicted. On the basis, the value which include Spring Festival factor can be calculated, and then revert to the actual days of month forecast. Thus the predicted value in January to June 2018 of theft crime can be calculated. By comparing the actual value with the predicted value, the average absolute
percentage error of the prediction is that MAPE=18.15%
COMPARATIVE ANALYSIS FROM PREDICTION RESULTS OF TWO MODELS
predict more accurately. Therefore, the improved X13-ARIMA-SEATS model is chosen as the trend extrapolation prediction model.
CONCLUSIONS AND PROSPECTS
Through the comparative study, the theft crime data of the city from 2012 to 2018 have the following laws:
Firstly, the number of theft crimes in the city has a certain upward trend, but the upward trend is not obvious. In the SARIMA model, that the first-order difference was needed to ensure the stability of the trend which indicated that the data had a certain tendency is found through autocorrelation graph and unit root test. However, in the seasonal adjustment of X13-ARIMA-SEATS model, there is no need to make first-order difference.
Secondly, the data of theft crimes in the city have identifiable seasonality. In the process of X13-ARIMA-SEATS, the data without the factors of the lunar New Year sequence exists in stable and recognized seasonality, but there is no mobile seasonality. Embodying in: the occurring of cases keep the high level from February to May each year, peaked in April; from June to January the following year remain at low levels; August and December appears two small peaks respectively. Public security mechanism should consider seasonal influence effect adequately when fighting theft crime.
Thirdly, the Spring Festival factors of in the theft crime data have a significant impact. Through the modelling regression of the original data and the Spring Festival variables, the influence of the Spring Festival factors on the theft crime data is significant, which is determined by the population characteristics of the city. The city has a large number of floating populations, and the leaving of floating populations leads to fewer theft crimes during the Spring Festival.
This thesis is only a preliminary exploration of the analysis of crime data by using the time series method. In the next step, the further study will be made in many directions. For example, we will analyse the time series of different types of crime data and crime data in different regions to find deeper laws behind the data. Using the new model to study the crime phenomenon; Spatial analysis of crime data and so on.
REFERENCES
2. Danhui Yi. Statistical Prediction: Methods and Applications (second edition). Renmin University of China Press, 2014, pp. 177-215.
3. Shuping Wang, Jianping Li, Gao lijun, Xu Weixuan. Analysis of Seasonal Fluctuation of Heating Oil Price Based on X-11-Arima Method. Combing Statistics &Management, Vol. 26(2007) No.1, pp. 62-67.
4. Findley D F, Monsell B C, Bell W R, et al. New Capabilities and Method of the X-12-ARIMA Seasonal -Adjustment Program. Journal of Business and Economic Statistics. Vol. 16(1998), No. 2, pp. 127-152.
5. Wenqiang Meng. Research on the Seasonal Adjusted of Inbound Tourism Data. Statistics & Decisions. (2017) No. 11, pp. 5-9.
6. Department of Investigation and Statistics of People's Bank of China. Time Series X-12-Arima Seasonal Adjustment Principles and Methods. Beijing: China Finance Press, 2006.
7. Yan Wang. Time Series Analysis-Based on R. Renmin University of China Press, 2014, pp. 29-41.