Graph Theoretic Modelling and Analysis of Industrial Automation: A
Case Study
Govil Khurana
1Sumit Sharma
2Dr. S.K. Mohapatra
3 1,2,3Thapar University, Patiala
Abstract— In this paper we are studying and developing the permanent function of the industrial automation using graph theoretical approach. The permanent function provides us with the numerical value of system with all its characteristic features. Any change any of the subsystems or there interaction will change the numerical value of the permanent function. The comparison of the changed numerical value with that of the original value will tell us whether the system will move towards better or not.
Key words: QFD, Network Interface Subsystem, MEMS
I. INTRODUCTION
It is very essential to recognize the structural components, network interface, control parameters and the physical process/application for development of the mathematical model of the industrial automation in a structured way. For this, total five systems have been recognized explicitly; physical process, sensors, network interface, actuators and controller subsystem. These are dependent on the product and the process of automation. The anticipated methodology is appropriate for modelling a specific industrial automation system and also for the consideration of any variation in structure. The following sections discuss the importance of the identified subsystems.
II. PHYSICAL PROCESS SUBSYSTEM
Manufacturing tools, equipments, processes and machines are involved in number of physical process subsystem. Industrial automation design and its specifications depend upon the physical process upto which extent it automates. Martin et al. (1990) made an attempt; In order to reach at a more or less automated manufacturing process optimally matching to an explicit manufacturing problem. In the beginning of the new challenges to design and leane; firms tried a lot to achieve a coherent system to interact between technology, organisation and to meet this challenge. Almannai et al. (2008) established an approach with the usage of both the Quality Function Development (QFD) and Failure Mode and Effects Analysis technique for the supportive management in order to address technology, organisation and people at the beginning stage of decision making in manufacturing automation.
A. Network Interface Subsystem
To make industrial automation system communicable between subsystems with earliest response time and marvellous flexibility in terms of hardware changeability network interface plays a major role. Replacement of traditional industrial network including some of the technologies like Ethernet switch, real-time operating system kernel etc., with modern network interface conforms the technical trend change to develop framework (hung et al. 2004).
B. Sensors Subsystem
Sensors produce signal with respect to some physical quantities which help in creating instructions and fluent feedback for the industrial automation system. Their design and specification are very important in respect to detection of quantity and the physical law it governs. Now days for the control applications, the role of sensors is increasing desperately. More acumen and less power consumption in the sensor, reduction through use of extremely integrated microelectronics and microsystems technologies, vigorous measurement methods and a smaller amount installation and wiring costs, enhanced performance (Reininger et al. 2006).
C. Actuators Subsystem
To move and control of mechanism the mechanical device used is an actuator. It consumes energy usually transported by air, electric current, or liquid, and transforms that into some kind of motion. For the characterization of actuator performance is judged in terms of force, power, current consumption, work output, and efficiency (Plante and Dubowsky 2007). Closed loop functional unit is formed by the sensors and actuators for improving the performance. The future is beyond imagination from sensors and actuators to micro electro mechanical systems (MEMS), to nanofabrication, smart materials and smart structures (Wen 1996).
D. Controllers Subsystem
Controller delivers an effective and stress-free way to control the categorisation of the actuators movement and the states Industrial Automation system (Swider et aI. 2005). As per the guidelines, the designing process involves 3 steps viz. activity analysis, functional design and implementation design for structuring and designing if the Industrial Automation system to better the requirements and capabilities of the controller. The designed controller can perform various functions like welding etc. Any new capabilities can be applied optionally. (Ferretti et al. 1996).
III. GRAPH THEORETIC MODEL OF THE INDUSTRIAL AUTOMATION SYSTEM
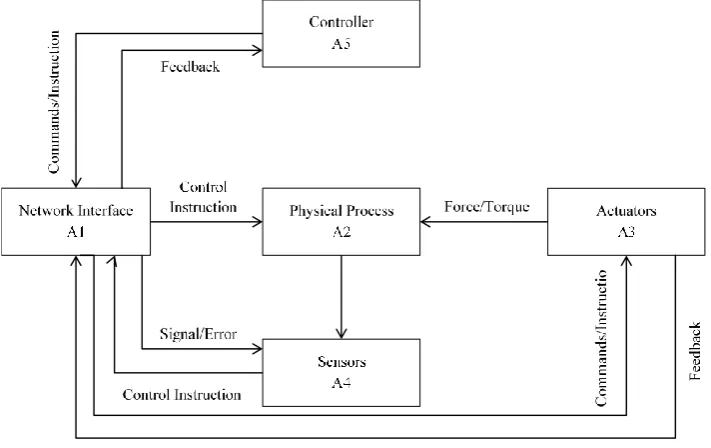
Figure 1 shows the schematic diagram of industrial automation system along with interactions between various subsystems. There are large numbers of applications of systems models using graph theory (Deo 2007) and such models have a solid mathematical background.
Fig. 1: Schematic diagram of industrial automation system The vertices (Ai) and the edges (mij) correspond to
subsystem and interaction/interdependency respectively. The graph developed for the system is directed graph with interactions specific to the edge direction. The graph is useful mathematical entity and helpful for visual analysis of the system.
Fig. 2: Structural diagram of industrial automation system
A. Matrix Representation for the Industrial Automation System Graph
The graph in the matrix form can be represented by many methods and incidence and adjacency matrices are two of them (Deo 2007). The adjacency matrix is more suitable for the algebraic results as it is a square matrix.
B. Adjacency matrix
The adjacency matrix with five nodes will be five order binary square matrix, A. The matrix is
C. Industrial automation system characteristic matrix
The above matrix only represents the connectivity and not the characteristics of the system. Hence industrial automation system characteristic matrix, B is developed.
The determinant of the matrix is
Det(B) = λ5 + λ3 – λ2 – λ (3)
D. Industrial Automation System Characteristic and Interdependence Variable Matrix
The characteristic matrix forms the basis of characterisation of the system but fails to distinguish different subsystem and their interactions. To overcome this limitation another matrix called industrial automation subsystem characteristic and interdependence variable matrix (IASSCIVM), C is developed.
For these purpose two square matrices, D & E are defined. D is a diagonal matrix representing different subsystems and E is an off diagonal matrix representing different levels of interactions.
The characteristic features of the subsystems and their interactions are distinctly represented by the above matrix.
The determinant of the matrix C is an invariant of the system. Det(C) = [A1A2A3A4A5] + [-A2A4A5L13 + A2A3A4L15 –
A2A3A5L14] + [– A3A5L124] + [-A5L1324]
E. Composite Performance Index and the Permanent Function
Composite score serves an important role in the total performance analysis. Its numerical value can be obtained by substituting appropriate values of the subsystems and their interactions in the Det(C). In this case because of the subtraction, some of the information may be lost.
The use of permanent matrix and permanent function (Jurkat and Ryser, 1966, Minc, 1966) is proposed to overcome this limitation.
F. Industrial Automation System Permanent Matrix
The negative sign from the IASSCIVM is removed to obtain the permanent function. The matrix developed is called the industrial automation system characteristic and interdependence variable permanent matrix (IAPSM), P.
G. Industrial Automation System Characteristic and Interdependence Variable Permanent Function
The permanent function has exactly same number and type of terms as in Det(C) with a difference in signs only. It is unique and complete structural representation of the system with advantage of using numerical value.
Per(P) = [A1A2A3A4A5] + [A2A4A5L13 + A2A3A4L15 + A2A3A5L14] + [A3A5L124] + [A5L1324]
Structural components of the function are 1) Subsystems
2) Dyads of two subsystems in the form of closed loop, Lij. 3) Closed loops of subsystems, Lijk, Lijkl, Lijklm.
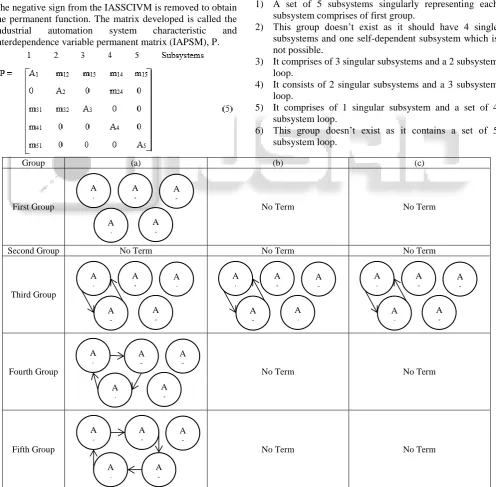
The composite score of the system is obtained by assigning the numerical value to each structural element in the permanent function. There will be (n+1) groups for the nth order permanent matrix.
The characteristic features of all the 6 groups in the matrix are summarised as below:
1) A set of 5 subsystems singularly representing each subsystem comprises of first group.
2) This group doesn’t exist as it should have 4 single subsystems and one self-dependent subsystem which is not possible.
3) It comprises of 3 singular subsystems and a 2 subsystem loop.
4) It consists of 2 singular subsystems and a 3 subsystem loop.
5) It comprises of 1 singular subsystem and a set of 4 subsystem loop.
6) This group doesn’t exist as it contains a set of 5 subsystem loop.
Group (a) (b) (c)
First Group No Term No Term
Second Group No Term No Term No Term
Third Group
Fourth Group No Term No Term
[image:3.595.51.548.266.753.2]Fifth Group No Term No Term
Fig. 3: Graphical representation of the permanent multinomial A
1
A 2
A 3
A 5 A
4
A 1
A 2
A 4
A 5 A
3
A 1
A 2
A 3
A 4 A
5
A 1
A 2
A 3
A 5 A
4
A 1
A 2
A 3
A 5 A
4
A 1
A 3
A 5
A 2 A
H. Assigning the Numerical Values
Based on different outputs, the numerical values of various subsystems and their interactions can be chosen by the experts in the field studying the behaviour of the system closely.
If the system is complex, then the values can be chosen by decomposing the subsystems further into sub-subsystems.
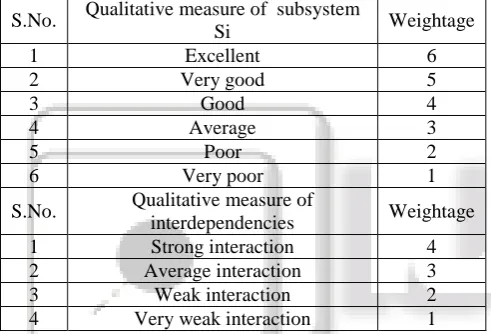
I. Quantification of Factors and Their Interdependencies
The several factors which are affecting the CIMS are acknowledged and listed in table 3.1. Also the subsystems are presented in the same table. Using the table permanent functions presented in each of subsystem Per(P) is evaluated. For this process, the variable function is selected from the lowest order of the table. To avoid complication, an appropriate numeric value is to be allocated at both levels. The numeric value depends on weightage of the subsystem to the total system. The below table 3.1 suggests that the value which is interdependent of the computer integrated manufacturing system.
S.No. Qualitative measure of subsystem
Si Weightage
1 Excellent 6
2 Very good 5
3 Good 4
4 Average 3
5 Poor 2
6 Very poor 1
S.No. Qualitative measure of
interdependencies Weightage
1 Strong interaction 4
2 Average interaction 3
3 Weak interaction 2
[image:4.595.45.291.301.468.2]4 Very weak interaction 1
Table 1: Qualitative measure of CIMS subsystems and their interdependencies
IV. CONCLUSION
By solving the above permanent matrix, a numerical value is obtained. This value tells us about the system characteristics. Now by varying any parameter, the subsystem and interactions values will be changed and the permanent matrix value will also be changed. The experts by comparing the changed value of the permanent matrix to the original value can determine whether the system will improve or not. The earlier processes available to see any change in the system by changing any parameters is to be done on the machine only which takes a lot of time and capital. But by using this technique we will be able to predict which way the system will go using numerical values provided by experts in the field without doing any physical process.
REFERENCES
[1] G. Cleveland, R. Schroeder and J. Anderson (1989), "A theory of production competence", Decision Sciences, Vol. 20, pp. 1987-2007.
[2] H.P. Wiendahl and R. Garfichs (1991) "Trends in computer-integrated manufacturing", Future Generation Computer Systems, Vol. 7, pp. 97-107.
[3] O.P. Gandhi, V.P. Agrawal and K.S. Shishodia, (1991), "Reliability analysis and evaluation of systems", Journal of Reliability Engineering and System Safety, Vol. 32, pp. 283-305.
[4] S. Vickrey, C. Droge and R. Markland (1993), "Production competence and business strategy: do they affect business performance?", Decision Sciences, Vol. 26, pp. 435-55.
[5] C. Voss and K. Blackmon (1994), "Practice performance relationships in UK manufacturing industry", First International Conference of the European Operations Management Association on Operations Strategy and Performance, Proceedings of the Conference Held at the Churchill College, Cambridge, pp. 1-6.
[6] P.T. Ward, G.K. Leong and K.K. Boyer (1994), "Manufacturing proactiveness and performance", Decision Sciences, Vol. 25 No. 3, pp. 337-58.
[7] S.B. Gershwin, (1994), Manufacturing Systems Engineering, Prentice-Hall, New York, NY.
[8] J.A. Gowan Jr., and R.G. Mathieu (1995), "Critical factors in information system development for a flexible manufacturing system", Computers in Industry, Vol. 28, pp. 173-183.
[9] S. Dowlatshahi (1995), "An integrated manufacturing system design: an applied approach", Int. J. Production Economics, Vol. 42, pp. 187-199.
[10] H. Bartlett and J. Harvey (1995), "The modelling and simulation of a pick and place computer-integrated manufacturing (CIM) cell", Computers in Industry, Vol. 26, pp. 253-260.
[11] J.A. Gowan Jr., R.G. Mathieu (1996), "Critical factors in information system development for a flexible manufacturing system", Computers in Industry, Vol. 28, pp. 173-183.
[12] B. Shirinzadeh (1996), "Strategies for planning and implementation of flexible fixturing systems in a computer integrated manufacturing environment", Computers in Industry, Vol. 30, pp. 175-183.
[13] C. Kirsch, O. Strohm and E. Ulich (1996), "Design concepts of computer-aided integrated manufacturing systems: Work-psychological concepts and empirical findings", International Journal of Industrial Ergonomics, Vol. 17, pp. 11-19.
[14] Z.Y. Wang, K.P. Rajurkar and A. Kapoor (1996), “Architecture for agile manufacturing and its interface with computer integrated manufacturing", Journal of Materials Processing Technology, Vol. 61, pp. 99-103. [15] K. Cheng (1996), "Hypermedia as a tool with application
to computer integrated design and manufacturing", Journal of Materials Processing Technology, Vol. 61, pp. 143-147.
[16] P. Dreer and D.A. Koonce (1996), "Integration Extension for Computer Integrated Manufacturing Applications", Computers ind. Engng, Vol. 31, No. 1/2, pp. 281 - 284.
Process", International Journal of Computer Integrated Manufacturing, Vol. 10 No. 5, pp. 394-404.
[19] R.J. Goncalves, H. Silva, M. Vital, P. Sousa, A.S. Garcao and J.P. Teixeira (1997), "Implementation of computer integrated manufacturing systems using SIP: Cim case studies using a STEP approach", International Journal of Computer Integrated Manufacturing, Vol. 10:1-4, pp. 172-180.
[20] Mital (1997), "What role for humans in computer integrated manufacturing?”, International Journal of Computer Integrated Manufacturing, Vol. 10:1-4, pp. 190-198.
[21] A.I. Kokkinaki and M.J. Morse (1997), "Case study: Industrial communications architectures and their application in a garment computer integrated manufacturing cell", Computer Communications, Vol. 20, pp. 912-922.
[22] C.M. Parks, D.A. Koonce and R.P. Judd (1997), "An Integrated Manufacturing Systems Design Environment", Computers ind. Engg, Vol. 33, Nos 1-2, pp. 341-344.
[23] J.J. Sheu (1998), "A computer integrated manufacturing system for rotational parts", International Journal of Computer Integrated Manufacturing, Vol. 11:6, pp. 534-547.
[24] S.N. Kadipasaoghi, S.F. Hurly, J.L. Foote and B.M. Khumawala (1998), "An investigation of the relationship between global manufacturing practices and outcomes in machine tools and textile industries", Journal of Operations Management, Vol. 16, pp. 291-9.
[25] S. Samaddar, G. Rabinowitz and A. Mehrez (1999), "Resource sharing and scheduling for cyclic production in a computer-integrated manufacturing cell", Computers & Industrial Engineering, Vol. 36, pp. 525-547.
[26] F.T. Cheng, E. Shen, J.Y. Deng and K. Nguyen (1999), "Development of a system framework for the computer-integrated manufacturing execution system: A distributed object oriented approach", International Journal of Computer Integrated Manufacturing, Vol. 12:5, pp. 384-402.
[27] R. Handifield and E. Nichols (1999), Introduction to Supply Chain Management, Prentice-Hall, New York, NY.
[28] S. Arora and S. Kumar (2000), "Reengineering: a focus on enterprise integration", Interfaces, Vol. 30 No. 5, pp. 54-71.
[29] J.Z. Yin (2002), "Relating learning capability to the success of computer-integrated manufacturing", Technological Forecasting & Social Change, Vol. 69, pp. 53–70.
[30] K.H. Choi, C.H. Bae, and S.H. Lee (2003), "Behaviour modelling and control of computer integrated manufacturing", International Journal of Computer Integrated Manufacturing, Vol. 16:2, pp. 128-139. [31] C.E. Bozdag, C. Kahraman and D. Ruan (2003), "Fuzzy
group decision making for selection among computer integrated manufacturing systems, Computers in Industry, Vol. 51, pp. 13–29.
[32] M. Yurdakul, (2004), "Selection of computer-integrated manufacturing technologies using a combined analytic hierarchy process and goal programming model",
Robotics and Computer-Integrated Manufacturing, Vol. 20, pp. 329–340.
[33] Kahraman, A. Beskese and D. Ruan (2004), "Measuring flexibility of computer integrated manufacturing systems using fuzzy cash flow analysis", Information Sciences, Vol. 168, pp. 77–94.
[34] S. Grover, V.P. Agrawal and I.A. Khan (2005), "Human resource performance index in TQM environment", Int. J. Management Practice, Vol. 1, No. 2, pp. 131-151. [35] J. Blackhurst, T. Wu and P.O. Grady (2005), "PCDM: a
decision support modeling methodology for supply chain product and process design decisions", Journal of Operations Management, Vol. 23, pp. 325-43.
[36] R.T.D. Prabhakaran, B.J.C. Babu and V.P. Agrawal (2006), "Design for 'X'- abilities of RTM products- A graph theoretic approach", Concurrent Engineering: Research and Applications, Vol. 14 No. 2, pp. 151-161. [37] R. Sarmiento, M. Byrne, L.R. Contreras and N. Rich
(2007), " Delivery Reliability, manufacturing capabilities and new models of manufacturing efficiency", Journal of Manufacturing Technology Management, Vol. 18 No. 4, pp. 129-149.
[38] Singh and V.P. Agrawal (2008), "Structural modeling and integrative analysis of manufacturing systems using graph theoretic approach", Journal of Manufacturing Technology Management, Vol. 19 No. 7, pp. 844-870. [39] Ferrer, J. Rios and J. Ciurana (2009), "An approach to
integrate manufacturing process information in part design phases", Journal of materials processing technology, Vol. 209, pp. 2085–2091.
[40] B.S. Reiter, E.M. Frazzon and T. Makuschewitz (2010), "Integrating manufacturing and logistic systems along global supply chains", CIRP Journal of Manufacturing Science and Technology, Vol. 2, pp. 216–223.
[41] T.S. Han and W.C. Liao (2010), "Computer-integrated manufacturing and high performance work system: the case of Taiwan", The International Journal of Human Resource Management, Vol. 21:3, pp. 434-454.
[42] C.P. Kiran, S. Clement and V.P. Agrawal (2011), "Design for 'X'- abilities of a Mechatronic System- A concurrent engineering and graph theoretic approach", Concurrent Engineering: Research and Applications, Vol. 19 No. 1, pp. 55-70.
[43] G. Ding, L. Jiang, S. Qin, S. Zhu and S. Ma (2012). "Computer-integrated manufacturing system for tube bending", International Journal of Computer Integrated Manufacturing, Vol. 25 No. 11, pp. 1059–1068.