Munich Personal RePEc Archive
Employer Support for Employee
Voluntarism
Kapsalis, Constantine
Data Probe Economic Consulting
January 1999
Online at
https://mpra.ub.uni-muenchen.de/26141/
Applied Research Branch Strategic Policy
Human Resources Development Canada
Employer Support for Employee Voluntarism
by
Constantine Kapsalis*
January 20, 1999
*
E
EX
XEECCUUTTIIVVEESU
S
UMMMMAARRYYThis study uses the microdata from the 1997 National Survey of Giving, Volunteering and Participating (NSGVP) and from a comparable survey for 1987 to answer a number of key questions pertaining to the role of employers in support of employee voluntarism.
How extensive is employer support? In 1997, 44% of employee volunteers received support by their employer. The most common type of support was permission to use company facilities or equipment (reported by 27% of employee volunteers), followed by time off to volunteer (24%) and change in work schedule (22%). Employer recognition in the form of, for example, a letter was much less common (14%).
How has employer support change over the last 10 years? Over the period 1987-97, the incidence of most types of employer support increased. However, there was also greater concentration of employer support among fewer employees -- i.e. the typical employee with employer support received more types of employer support in 1997 than in 1987. As a result, the percentage of employee volunteers receiving employer support declined from 49.1% to 44.0%.
What organizations or activities do employer support the most? In 1997, employer support was relatively more common for employees who volunteered for philanthropic organizations (79%) and associations and unions (69%). Also, certain activities, like fire fighting or first aid, help educate or lobby, and consulting or administrative tasks, tend to have a higher than average incidence of employer support.
T
TA
ABBLLEEOOFFCO
C
ONNTTEENNTTSSEXECUTIVE SUMMARY 1
1. INTRODUCTION 3
2. EMPLOYEE VOLUNTEERING AND EMPLOYER SUPPORT 4
2.1 OVERALL RESULTS 4
2.2 EMPLOYEES VS. NON-EMPLOYEES 5 2.3 RESULTS BY EMPLOYEE CHARACTERISTICS 7
3. TYPES OF EMPLOYER SUPPORT 9
3.1 OVERVIEW OF TYPES OF SUPPORT 9 3.2 INCIDENCE OF EMPLOYER SUPPORT BY TYPE OF ORGANIZATION 12 3.3 TYPES OF EMPLOYER SUPPORT BY TYPE OF ORGANIZATION 14 3.4 INCIDENCE OF EMPLOYER SUPPORT BY TYPE OF ACTIVITY 15
4. EMPLOYER SUPPORT AND HOURS OF VOLUNTEERING 17
4.1 DESCRIPTIVE ANALYSIS 17
4.2 REGRESSION ANALYSIS 19
4.2.1 EFFECT OF EMPLOYER SUPPORT IN GENERAL 19
4.2.2 EFFECT OF SPECIFIC TYPES OF EMPLOYER SUPPORT 20
5. OTHER EFFECTS OF EMPLOYER SUPPORT 21
6. CONCLUSION 23
APPENDIX A: REGRESSION RESULTS 24
1
1
.
.
IN
I
NTTRROODDUUCCTTIIOONNOne way employers can help the volunteer sector is by supporting volunteerism among their employees by, for example, providing time off or allowing flexibility in work schedule to accommodate voluntary activities, by permitting the use of company facilities or equipment, or by simply praising their employees formally or informally for their volunteer activities.
Employer support for volunteerism can have several important benefits. For example, support for volunteerism can generate good will in the community and among the employees, or be part of a company's effort to facilitate the transition of employees into retirement.
Employer support for volunteering can have an effect on the level of volunteer effort and the outcomes of volunteering. For example, employer support has the potential of encouraging more employees to become volunteers or allowing current employee volunteers to volunteer more hours. It has also the potential of affecting the outcomes of volunteering. For example, it may encourage certain types of volunteering and it may lead to stronger work-related benefits.
The objective of this study is to explore the above aspects of employer support to employee volunteers. Some of the specific questions addressed here are: how extensive is employer support? what organizations and activities do employers support more? what kind of support do they provide? does employer support encourage volunteer effort among employees? are the benefits of volunteering, as perceived by the employees, different when there is employer support?
By better understanding the extent and nature of employer support, it is hoped that we can learn more about the importance of employer support for employee volunteers. This can also help volunteer organizations develop a better strategy for promoting volunteerism among employees by capitalizing on the importance of employer support.
The study is based on the data from the 1997 National Survey of Giving, Volunteering and Participating (NSGVP). The survey was carried out by Statistics Canada in the fall of 1997, as a supplement to the monthly Labour Force Survey. It was undertaken on behalf of a consortium of federal departments and non-profit organizations.1
1
The NSGVP collected information on volunteer work, charitable donations, and participation in social activities and organizations from 18,301 individuals, age 15 or older, over the 12-month period November 1996 to October 1997.
The study also used data from the 1987 Voluntary Activity Survey (VAS). The VAS collected information on volunteer activity from 26,657 individuals, age 15 years or older, over the 12-month period November 1986 to October 1987. The 1987 data were used primarily for comparing the level of volunteer effort between 1987 and 1997.
In what follows, Section 2 looks at the rate of participation and hours of volunteering of employees, as well as the incidence of employer support among employee volunteers. Section 3 examines what types of support do employers provide to employee volunteers and which activities tend to get more employer support. Section 4 attempts to answer the question: does employer support encourage more employee volunteer effort? Section 5 concludes the analysis by examining if employer support leads to stronger perceived benefits among employee volunteers, in general or with respect to certain types of benefits, such as improvement of skills directly applicable to job.
2
2
.
.
EM
E
MPPLLOOYYEEEEVO
V
OLLUUNNTTEEEERRIINNGGAANNDDEM
E
MPPLLOOYYEERRSU
S
UPPPPOORRTTSection 2 looks at the rate of participation and hours of volunteering of employees, as well as the incidence of employer support among employee volunteers. First overall results and comparisons between 1997 and 1987 are presented, followed by an examination of the incidence of volunteering and employer support by employee characteristics.
2
2
.
.
1
1
O
O
VVEERRAALLLLR
R
EESSUULLTTSSChart 1 shows that 33.1% of all employees volunteered for an organization in 1997, up from 27.1% in 1987. Most of the increase concentrated among volunteers with few annual hours of volunteering. As a result, between 1987 and 1997, the average hours of volunteering declined from 177 to 132.
Chart 1 also shows that an estimated 44.0% of employee volunteers received some type of support from their employer -- such as approval to use company facilities or time off to do volunteer work. The percentage of employees who received employer support declined between 1987 and 1997 from 49.1% to 44.0%.
Chart 1: Change in Employee Volunteer Effort and Employer Support of Volunteers, 1987-97
27.1% 49.1% 33.1% 44.0% 177 132 0.0% 10.0% 20.0% 30.0% 40.0% 50.0% 60.0%
% of employees who volunteered
% of volunteers with employer support
Average hours of volunteering In c id e n c e 0 20 40 60 80 100 120 140 160 180 200 A v e ra g e H o u rs 1987 1997
2
2
.
.
2
2
E
E
MMPPLLOOYYEEEESSVVSS.
.
N
N
OONN-
-
E
E
MMPPLLOOYYEEEESSTable 1 compares the volunteer effort of employees to the rest of the population in 1987 and 1997. In both years, the incidence of volunteering among employees was slightly above the average for all individuals age 15 years or older. Part-time employees and self-employed had the highest incidence of volunteering, while those not in the labour force had the lowest incidence.
In terms of average hours of volunteering, employees had the lowest hours and there is virtually no difference between full-time and part-time employees. Those not in the labour force had the highest average hours of volunteering.
[image:7.612.107.518.96.379.2]Received Incidence Average Median employer hours hours support
Employees 33.1% 132 60 44.0%
Full-time 30.6% 132 59 46.0%
Part-time 43.7% 133 64 38.1%
Self-employed 42.0% 154 80 n/a
Unemployed 29.7% 141 55 n/a
Not in the labour force 26.8% 176 76 n/a
All individuals 31.4% 149 66 n/a
Received Incidence Average Median employer hours hours support
Employees 27.1% 177 91 49.1%
Full-time 25.7% 176 92 55.5%
Part-time 34.9% 178 90 38.4%
Self-employed 36.8% 179 81 n/a
Unemployed 23.1% 202 96
Not in the labour force 25.1% 217 105 n/a
All individuals 26.8% 191 96 n/a
1987
[image:8.612.92.556.132.520.2]Employee volunteering Table 1: Volunteering Effort by Labour Force Status
2
2
.
.
3
3
R
R
EESSUULLTTSSBBYYE
E
MMPPLLOOYYEEEEC
C
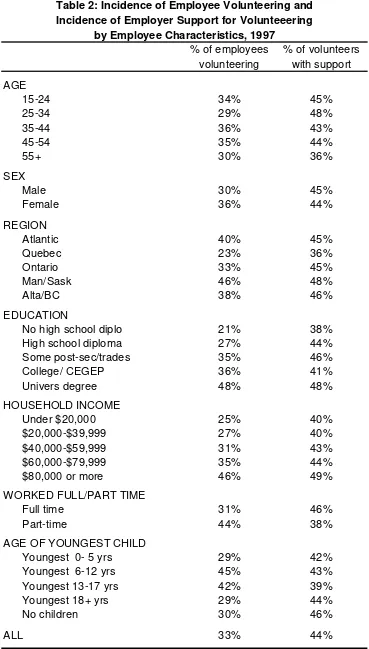
HHAARRAACCTTEERRIISSTTIICCSSTable 2 looks at the incidence of volunteering among employees and the incidence of employer support among volunteering employees by different employee characteristics.
In terms of incidence of volunteering, it is highest among employees with university education, incomes above $80,000, employees with school-age kids, and those working part-time. It is lowest among those with no post-secondary education and employees in Quebec.
In terms of incidence of employer support among employee volunteers, there is generally less variation by employee characteristics than is the case with respect of the incidence of volunteering. Employer support for volunteering is more common among employee volunteers with high education and high incomes. On the other hand, employer support is less common among older volunteers and volunteers in Quebec.
% of employees % of volunteers volunteering with support
AGE
15-24 34% 45%
25-34 29% 48%
35-44 36% 43%
45-54 35% 44%
55+ 30% 36%
SEX
Male 30% 45%
Female 36% 44%
REGION
Atlantic 40% 45%
Quebec 23% 36%
Ontario 33% 45%
Man/Sask 46% 48%
Alta/BC 38% 46%
EDUCATION No high school diplo 21% 38% High school diploma 27% 44% Some post-sec/trades 35% 46%
College/ CEGEP 36% 41%
Univers degree 48% 48%
HOUSEHOLD INCOME
Under $20,000 25% 40%
$20,000-$39,999 27% 40%
$40,000-$59,999 31% 43%
$60,000-$79,999 35% 44%
$80,000 or more 46% 49%
WORKED FULL/PART TIME
Full time 31% 46%
Part-time 44% 38%
AGE OF YOUNGEST CHILD Youngest 0- 5 yrs 29% 42% Youngest 6-12 yrs 45% 43% Youngest 13-17 yrs 42% 39%
Youngest 18+ yrs 29% 44%
No children 30% 46%
[image:10.612.125.494.83.732.2]
ALL 33% 44%
Table 2: Incidence of Employee Volunteering and Incidence of Employer Support for Volunteeering
3
3
.
.
TY
T
YPPEESSOOFFEM
E
MPPLLOOYYEERRSU
S
UPPPPOORRTTSection 3 examines what types of support do employers provide to employee volunteers. The section begins with an overview of the types of support provided by employers, followed by an examination of whether the type of support differs depending on the type of volunteer organization. It also looks at the volunteer activities of employees and which activities tend to get more employer support.
3
3
.
.
1
1
O
O
VVEERRVVIIEEWWOOFFT
T
YYPPEESSOOFFS
S
UUPPPPOORRTTThe NSGVP identified four types of employer support to employee volunteers, plus a residual type consisting of any other type of support. Chart 2 list the various types of support by frequency of reporting.
Approval to use facilities or equipment was the most common type of employer support. About 26% of volunteering employees reported this type of support in 1997. It was followed closely by time off or change of work schedule to accommodate volunteering. Employer recognition, for example a letter of thanks, was much less common.
Chart 2: Incidence of Various Types of Employer Support Among All Employee Volunteers
1997 vs. 1987
44% 9%
14% 22%
24% 27%
49% 5%
13% 13%
23% 26%
0% 10% 20% 30% 40% 50% 60%
Received
any emplo
yer support Any othe
r type of
employer support Recognitio
n/letter of
thanks fo
r voluntee ring Approval
to change
work hours
to volunte er Time off t
o spend o
n volunte ering Approval
to use facil
ities or eq uipment
Chart 2 shows that all types of employer support were more frequently reported by employee volunteers in 1997 than 1987. At the same time, the percentage of employee volunteers who reported that they received any employer support actually declined between the two years.
This paradoxical result is explained by the fact that the average employee volunteer who received employer support reported more types of support in 1997 than in 1987. In particular, Table 3 shows that there was a significant increase in the percentage of employees who reported three or more types of employer support in 1997.
Thus, the overall decline in the incidence of employer support does not necessarily reflect an overall decline in employer commitment to supporting employee volunteers, but rather a greater concentration of employer support among fewer employees.
1987 1997
No support 50.9% 56.0%
One type of support 27.4% 15.2% Two types of support 14.4% 13.2% Three types of support 5.9% 9.4% Four types of support 1.2% 4.9% Five types of support 0.1% 1.4% At least one type of support 49.1% 44.0%
[image:12.612.117.505.303.496.2]Average number of types of support 1.6 2.2 among those receiving employer support
Table 3: Distribution of Employee Volunteers by Number of Types of Employer Support, 1987 vs. 1997
Finally, Chart 3 compares the distribution of types of employer support between employees who received one type of support and those who received two or more types of support.
Thus, for example:
Chart 2 shows that in 1997 27% of all employees who volunteered received employer support in the form of approval to use company facilities or equipment.
Chart 3 also compares the incidence of a particular type of support when only one type of support is received by the employee, versus its incidence when two or more types of support are received. The idea behind this comparison is to see if certain types of support are more common when only one type of support is provided, suggesting that these types of support may be more important.
Chart 1 suggests that approval to use company facilities or equipment is the most important type of employer support. It is the most common type when only one type of support is received by the employee.
Chart 1 also shows that when more than one type of support are provided, time off to volunteer is as common as approval to use company facilities or equipment. This suggests that time off to volunteer is important, but less important than permission to use company facilities or equipment.
Approval to change work hours is more common than time off to volunteer when one type of support is provided. The order of importance is reversed, however, when two or more types of support are received. This suggest that employees are more likely to receive first a change in work schedule before they receive time off to volunteer.
Chart 3: Incidence of Various Types of Employer Support Among Volunteering Employees who Received Support One Type of Support vs. Two or More Types of Support
24%
44%
74% 64%
75%
20% 33%
54% 50%
62%
11% 12%
16% 24%
38%
0% 10% 20% 30% 40% 50% 60% 70% 80%
Any othe
r type of e
mployer sup port Recognition
/letter of t
hanks for vol
unteering Time off t
o spend o
n volunteering Approval
to change
work hour
s to volunte er Approval
to use facili
ties or equ ipment
3
3
.
.
2
2
I
I
NNCCIIDDEENNCCEEOOFFE
E
MMPPLLOOYYEERRS
S
UUPPPPOORRTTBBYYT
T
YYPPEEOOFFO
O
RRGGAANNIIZZAATTIIOONNThe incidence of employer support by type of organization is more difficult to determine. The reason is that the NSGVP questionnaire identifies the presence of employer support in general, not in relation to a specific organization or specific activity.
Of all employee volunteers, 43% volunteered for more than one organization. This means that a direct connection between employer support and volunteer organizations can be made only with respect to the remaining 57% of the employees who volunteered for one organization only.
A comparison of employees who volunteer for one organization and employees who volunteered for two or more organizations shows that the distribution of organizations by type is very similar. As a result, concentrating on employees who volunteered for one organization only would not likely introduce a major distortion.
Chart 4: Incidence of Employer Support by Type of Organization, Among Employees who
Volunteered for One Organization Only, 1997
36% 18%
26% 29%
31% 35%
36% 37%
38% 41%
67% 69%
79%
0% 10% 20% 30% 40% 50% 60% 70% 80% 90%
Of all employees who volunteered for one organization, 36% received employer support in 1997. The results of the analysis show that:
Employees who volunteered for philanthropic organizations, associations/ unions, and a residual other category had the highest incidence of employer support (Chart 4). However, they accounted for only 6% of all employee volunteers (Table 4).
On the other hand, employees who volunteered for cultural/recreational organizations, the most common type of organization, had a lower than average incidence of employer support (31%).
Employees who volunteered for the next two most common types of organization received average or lower employer support -- 35% in the case of social service organizations and 29% in the case of religious organizations.
Employees who volunteered for environmental and international organizations had the lowest incidence of employer support, but they only accounted for about 3% of all employee volunteers.
Incidence
With Without All of
employer employer employee employer support support volunteers support
Culture & recreation 28% 34% 32% 31%
Social services 22% 23% 22% 35%
Religious 12% 15% 14% 29%
Health 13% 10% 11% 41%
Development & housing 5% 5% 5% 37%
Education & research 4% 4% 4% 36%
Philanthropic 7% 1% 3% 79%
Law, advocacy, political 3% 3% 3% 38%
Environment 2% 3% 2% 26%
Associations & unions 3% 1% 2% 67%
International 0.3% 1% 1% 18%
Other 1% 0.3% 1% 69%
All organizations 100% 100% 100% 36%
[image:15.612.98.521.358.706.2]Number of employees (000s) 763 1,361 2,124 Distribution of Employee Volunteers
Table 4: Distribution of Employees with and without Employer Support by Type of Volunteer Organization, 1997
3
3
.
.
3
3
T
T
YYPPEESSOOFFE
E
MMPPLLOOYYEERRS
S
UUPPPPOORRTTBBYYT
T
YYPPEEOOFFO
O
RRGGAANNIIZZAATTIIOONNTable 5 shows the incidence of various types of support by type of volunteer organization. The table is restricted to employees who received employer support and volunteered for one organization only.
The sum of the incidence of various types of support add to more than 100%, since most employees with employer support receive more than one type of support (the average number of types of support being 1.6).
The results show that the type of support provided by employers tends to depend on the nature of the organization for which employees volunteer. For example, approval to use company facilities or equipment (which is the most common type of employer support) varies from 87% for philanthropic organizations and 83% for international organizations, to 44% for religious organizations and 38% for law, advocacy and political organizations.
This means that the needs of employee volunteers and the type of employer support required will tend to depend on the nature of the organization for which the employees volunteer.
Approval Time Approval Recogni- Other to use off to to change tion/ type facilities/ volunteer work letter of of
equip. hours thanks support
Philanthropic 87% 72% 36% 66% 18%
International 83% 40% 23% 40% 23%
Environment 71% 56% 80% 47% 30%
Associations & unions 68% 68% 47% 20% 29%
Health 62% 50% 38% 47% 22%
Development & housing 62% 38% 35% 20% 26%
Social services 58% 43% 45% 31% 15%
Education & research 57% 57% 57% 34% 28%
Culture & recreation 53% 50% 49% 32% 12%
Religious 44% 64% 69% 19% 18%
Law, advocacy, political 38% 57% 53% 43% 6%
[image:16.612.92.527.423.696.2]All organizations 58% 52% 48% 35% 17%
Table 5: Incidence of Various Types of Employer Support
and received employer support) By Type of Volunteer Organization, 1997
3
3
.
.
4
4
I
I
NNCCIIDDEENNCCEEOOFFE
E
MMPPLLOOYYEERRS
S
UUPPPPOORRTTBBYYT
T
YYPPEEOOFFA
A
CCTTIIVVIITTYYSection 3 concludes by looking at the volunteer activities of employees and the corresponding incidence of employer support. The analysis is restricted to employees who volunteered for one organization. Furthermore, it is assumed that if employees received employer support, they received it for all activities. The reason for the latter assumption is that there is no way in the survey to identify which activities were actually supported by the employer.
According to the NSGVP, 2,124 thousand employees volunteered for one organization in 1997. They were involved in 5,315 thousand activities, or 2.5 activities per employee.
Table 6 shows the distribution of these 5,315 thousand activities, rather than the distribution of the employees who undertook them. The table shows that:
The three most common activities among employee volunteers were: organizing or supervising events; canvassing and fundraising; and being a unpaid member of a committee. Collectively these three types of activities accounted for about 41% of all employee voluntary activities.
About 43% of the activities were undertaken by employees who received employer support. In most cases there is no significant variation in the incidence of employer support among the different types of activities.
Incidence
With Without All of
employer employer employee employer support support activities support
Organize/supervise events 17% 16% 16% 45%
Canvassing, fundraising 13% 14% 14% 40%
Unpaid committee member 11% 10% 11% 45%
Teach/coach for an organization 8% 8% 8% 41%
Consulting, office, admin 9% 7% 8% 50%
Other 5% 9% 7% 32%
Help to educate, influence, lobby 9% 6% 7% 52%
Provide care or support 6% 7% 7% 41%
Collect, serve, or deliver food 5% 6% 6% 40%
Drive for an organization 5% 5% 5% 41%
Maintain/repair building facilities 4% 5% 4% 40%
Assist a self-help group, AA 2% 2% 2% 37%
Protecting the environment 2% 2% 2% 40%
Provide health care, hospitals 1% 2% 2% 41%
First aid, fire fighting 2% 1% 2% 60%
All activities 100% 100% 100% 43%
Number of activities (000s) 2,274 3,041 5,315
[image:18.612.97.521.109.537.2]Number of employees (000s) 763 1,361 2,124 Distribution of Employee Activities
Table 6: Distribution of Employee Activities by Type of Volunteer Activity, 1997
4
4
.
.
EM
E
MPPLLOOYYEERRSU
S
UPPPPOORRTTAANNDDH
H
OOUURRSSOOFFVO
V
OLLUUNNTTEEEERRIINNGGSection 4 attempts to answer the following question: does employer support encourage more employee volunteer effort? It begins with a descriptive analysis based on simple charts, and concludes with the estimation of two regression equations.
4
4
.
.
1
1
D
D
EESSCCRRIIPPTTIIVVEEA
A
NNAALLYYSSIISSSince the survey questions pertaining to employer support were asked only among employees who volunteered, it is possible study the possible effect of employer support on the employees' hours of volunteering only, but not on their decision to volunteer or not.
Chart 5a shows that there is positive correlation between the presence of employer support and the hours of work. In particular, among employees who volunteered for one organization, employees who received employer support volunteered 10 hours more (or 13% more) than employee volunteers without employer support. The comparison among employees who volunteered for more than one organizations is ambiguous because it is not known for which organization the support was provided.
Chart 5b looks at the hours of volunteering of employees who volunteered for one organization and received employer support. It attempts to examine if certain types of support are more effective than others in encouraging more hours of volunteering. Chart 5b suggests that the correlation between employer support and hours of volunteering is relatively stronger in the case of time off to volunteer and change in the work schedule to accommodate volunteer activities.
The above results suggest that employer support encourage more volunteer effort among employees and that time off to volunteer or a change in work schedule are more effective than other types of support.
However, the results should be interpreted with caution. The reason is that the direction of causality in the above correlation is not entirely clear. For example, while it is quite plausible to expect that employer support encourages more volunteer effort, it is equally plausible that employees who volunteer for many hours are more likely to request employer support, particularly in the form of a change in work schedule or time off.
Chart 5a: Average Hours of Volunteering, Among Employees With and Without Employer Support, 1997
76
170
108 86
230
162
0 50 100 150 200 250
Volunteered for one organization
Volunteered for two or more organizations
All employee volunteers
Without support With support
Chart 5b: Average Hours of Volunteering by Type of Employer Support, Among Employees who Volunteered for
One Organization and Received Employer Support, 1997
99 103
69
92 77
0 20 40 60 80 100 120
Use of facilitie s
Time off t
o volunte er
Change wo rk hours
Recognitio n/letter
Other sup port
4
4
.
.
2
2
R
R
EEGGRREESSSSIIOONNA
A
NNAALLYYSSIISSThe relationship between employer support and hours of employee volunteering was further probed using regression analysis. The regression models suffer from the same limitation as the descriptive analysis -- i.e. it is not clear what part of the correlation between employer support and hours of volunteering is due to the effect of employer support on hours of employee volunteering, as opposed to the possibility that employees with many hours of volunteering are more likely to request employer support.
The regression analysis is restricted to employees who volunteered for one organization in 1997. All independent variables are categorical variables. The dependent variable is the hours of volunteering.
4
4..22..11EEffffeeccttooffEEmmppllooyyeerrSSuuppppoorrttiinnGGeenneerraall
Regression model 1 test the effect of employer support in general, regardless of what specific type of support was provided. The regression results are summarized Table 7, while detailed regression results are shown in Appendix A (Regression 1).
b-coeffic. Stand.err.
Effect of:
Employer support in general 14 5.5 2.5 Permission to use company facilities/equip. 1 6.5 0.1 (*)
Time off to volunteer 28 6.8 4.1
Change in work time schedule 28 7.0 4.0 Recognition or letter of thanks -5 8.0 -0.6 (*)
(*) Effect on employee hours of volunteering is not statistically different than zero, using the standard 95% probability confidence interval. For detailed regression results see Appendix A.
Table 7: Effect of Employer Support on Hours of Volunteering Among Employees who Volunteered for One Organization
Summary of Regression Results
The regression results show that:
The expected average hours of volunteering is 14 hours higher among employees with employer support; the effect of employer support on hours of volunteering is statistically significant.
Other characteristics associated with higher hours of volunteering are: male gender; youngest child 18 years of age or older; weekly attendance of religious service; and low income.
The most negative factors are: presence of pre-school age kids; low education; full-time employment; and incomes above $80,000 (although in the later case the incidence of volunteering, as opposed to the hours of volunteering, is very high).
4
4..22..22EEffffeeccttooffSSppeecciiffiiccTTyyppeessooffEEmmppllooyyeerrSSuuppppoorrtt
Regression models 2a to 2d test the effect of specific types of employer support on employees' volunteer hours. In these models, the simple binary variable for the presence of employer support is replaced by four alternative binary variables representing each of the four different types of employer support. The results are summarized again in Table 7 and are shown in detail in Appendix A (Regressions 2a to 2d). The regression results show that:
Only time off and change of work time schedule has a positive effect on the hours of volunteering (by about 28 hours in both cases).
5
5
.
.
OT
O
THHEERREF
E
FFFEECCTTSSOOFFEM
E
MPPLLOOYYEERRSU
S
UPPPPOORRTTSection 5 concludes the analysis by examining if employer support leads to stronger perceived benefits among employee volunteers, in general or with respect to certain types of benefits, such as improvement of skills directly applicable to job.
Chart 6a shows that a high percentage of employee volunteers, with or without employer support, reported several types of benefits resulting from their volunteer activities. The most widely reported benefits, reported by more than half of all employee volunteers, related to interpersonal skills, communication skills, increased knowledge, and organizational or managerial skills. Other benefits reported by many employee volunteers were fundraising skills, skills directly applicable to job, improved chances of success at work and technical or office skills.
One of the most interesting findings of the analysis was that the rate of reporting of the above benefits was in all cases higher among those who received employer support. The presence of employer support appears to have had its most positive effect on skills directly applicable to job, fundraising skills, help chances of success in job, and organization or managerial skills. In these cases, the rate of reporting of benefits was higher among employees with employer support by at least 19 percentage points. However, the rest of the benefits were also more frequently reported by employee volunteers with employer support (Chart 6b).
The statistical significance of the above findings were tested using logit regression analysis. Nine different regression models were estimated, one for each type of type of benefit of volunteering.2
The logit regression results not only confirmed the statistical significance of employer support, but also showed that employer support was a much more important explanatory variable than any of the other independent variables used in the regression -- i.e., age, gender, region, education, income, presence of pre-school age kids, and full versus full-time employment. The incremental R-square of the employer support variable was typically several times larger than that of any of the other independent variables.
It is not possible to determine from the survey data to what extent employer support improves the benefits of volunteering, as opposed to employer support being more common for activities that tend to result in stronger benefits. The ambiguity of cause and effect is not uncommon in regression analysis. However, although the relative strength of the two directions of causality cannot easily be determined, the empirical evidence strongly suggests that employer support is associated with stronger benefits among volunteering employees.
Chart 6a: Benefits of Volunteering
Without and With Employer Support, 1997 vs. 1987
72% 60% 57% 45% 31% 22% 18% 20% 9% 83% 75% 72% 64% 51% 47% 38% 31% 15% 0% 10% 20% 30% 40% 50% 60% 70% 80% 90% Inte rperso
nal ski lls Commu nica tions skills Incre ase
d kn owle dge Org aniza tiona l/ma nage rial ski
lls
Fund raisi
ng ski lls Skills dire ctly appl icabl e to
job
Hel p ch
ance s of
succe ss in
job
Tech nica
l/offi ce ski
lls
Some oth
er ski lls/kn
owle dge
Without With
Chart 6b: Percentage Reporting Benefits of Volunteering Among those with support minus those without support
25%
20% 20% 19%
15% 15% 11% 11% 6% 0% 5% 10% 15% 20% 25% 30% Skills dire ctly appl icabl e to
job
Fund raisi
ng ski lls
Hel p ch
ance s of
succe ss in
job Org aniza tiona l/ma nage rial ski
lls
Incre ase
d kn owle dge Commu nica tions skills Tech nica l/offi ce ski
lls
Inte rperso
nal ski lls
Some oth
er ski lls/kn
6
6
.
.
CO
C
ONNCCLLUUSSIIOONNThe results of the study show that many employee volunteers receive employers support (44% in 1997). The most common type of support is permission to use company facilities, followed by time off or changes in work schedule to accommodate volunteering.
There is evidence that employer support has tangible benefits. For example, there is a strong positive correlation between employer support in the form of time off or change in work schedule, and the hours of volunteering.
Also, there is strong positive correlation between employer support for volunteerism and frequency of reporting of perceived benefits of volunteering. The presence of employer support appears to have had its most positive effect on skills directly applicable to job, fundraising skills, help chances of success in job, and organization or managerial skills.
The study results show that employers can and often do play an important role in assisting the volunteer activities of their employees. Moreover, the study results show that there are direct benefits to the employer in the form, for example, of developing skills that are directly applicable to employees jobs.
A
AP
PPPEENNDDIIXXA
A
:
:
RE
R
EGGRREESSSSIIOONNR
R
EESSUULLTTSSVariable b-coefficient Standard error t-statistic
DEPENDENT Volunteer hours
ZEMPSUP Employer support 13.91 5.53 2.51
FULLTIME Full time employee -25.44 7.56 -3.37
AGE1 Age 15-24 -28.14 10.78 -2.61
AGE2 Age 25-34 10.09 ns 7.68 1.31
AGE3 Age 35-44 Reference category
AGE4 Age 45-54 -8.33 ns 8.22 -1.01
AGE5 Age 55+ -18.28 ns 11.45 -1.60
SEX1 Male 28.87 5.54 5.21
REGION1 Atlantic 8.17 ns 10.37 0.79
REGION2 Quebec 0.32 ns 7.46 0.04
REGION3 Ontario Reference category
REGION4 Man/Sask -26.41 10.21 -2.59
REGION5 Alta/BC'. 0.26 ns 6.82 0.04
EDUC1 No high school diploma -23.82 9.71 -2.45
EDUC2 High school diploma Reference category
EDUC3 Some post-sec/trades -12.99 ns 8.13 -1.60
EDUC4 College/ CEGEP -5.92 ns 8.37 -0.71
EDUC5 Univers. degree 16.07 ns 8.55 1.88
STUDENT1 Full-time student 4.60 ns 12.79 0.36
STUDENT2 Part-time student -14.10 ns 15.67 -0.90
STUDENT3 Not a student Reference category
KIDS1 Youngest 0- 5 yrs -20.47 9.59 -2.14
KIDS2 Youngest 6-12 yrs Reference category
KIDS3 Youngest 13-17 yrs -7.43 ns 11.30 -0.66
KIDS4 Youngest 18+ yrs 24.59 12.44 1.98
KIDS5 No children 5.94 ns 8.61 0.69
HEALTH1 Excellent -0.65 ns 7.20 -0.09
HEALTH2 Very good 0.61 ns 6.93 0.09
HEALTH3 Good Reference category
HEALTH4 Fair -15.28 ns 12.16 -1.26
HEALTH5 Poor -4.07 ns 29.35 -0.14
REL_ATT1 At least once a week 51.51 9.20 5.60
REL_ATT2 At least once a month' Reference category
REL_ATT3 3 or 4 times a year -2.87 ns 10.16 -0.28
REL_ATT4 Once or twice a year -4.42 ns 10.53 -0.42
REL_ATT5 Not at all 3.24 ns 8.52 0.38
INCOME1 Under $20,000 28.66 10.13 2.83
INCOME2 $20,000-$39,999 -1.38 ns 7.90 -0.18
INCOME3 $40,000-$59,999 Reference category
INCOME4 $60,000-$79,999 9.98 ns 7.68 1.30
INCOME5 $80,000 or more -27.43 7.58 -3.62
(Constant) 80.09 13.96 5.74
Adjusted R-square: 5.0% Standard error: 141.7 No. of observations: 2,988 ns: b-coefficient not significant at the 95% level of confidence.
Regression 1: Volunteer Hours as a Function of Employer Support
Any Type of Support
Variable b-coefficient Standard error t-statistic DEPENDENT Volunteer hours
ZAQ22A Use of company facilities/equip. 0.91 ns 6.51 0.14
FULLTIME Full time employee -24.66 7.58 -3.25
AGE1 Age 15-24 -28.08 10.80 -2.60
AGE2 Age 25-34 10.65 ns 7.69 1.39
AGE3 Age 35-44 Reference category
AGE4 Age 45-54 -8.48 ns 8.23 -1.03
AGE5 Age 55+ -19.87 ns 11.45 -1.74
SEX1 Male 28.81 5.55 5.19
REGION1 Atlantic 7.50 ns 10.38 0.72
REGION2 Quebec -0.60 ns 7.46 -0.08
REGION3 Ontario Reference category
REGION4 Man/Sask -26.49 10.22 -2.59
REGION5 Alta/BC'. -0.07 ns 6.83 -0.01
EDUC1 No high school diploma -24.09 9.72 -2.48
EDUC2 High school diploma Reference category
EDUC3 Some post-sec/trades -12.61 ns 8.15 -1.55
EDUC4 College/ CEGEP -6.41 ns 8.38 -0.77
EDUC5 Univers. degree 15.80 ns 8.56 1.85
STUDENT1 Full-time student 4.59 ns 12.81 0.36
STUDENT2 Part-time student -14.59 ns 15.69 -0.93
STUDENT3 Not a student Reference category
KIDS1 Youngest 0- 5 yrs -20.10 9.60 -2.09
KIDS2 Youngest 6-12 yrs Reference category
KIDS3 Youngest 13-17 yrs -7.73 ns 11.31 -0.68
KIDS4 Youngest 18+ yrs 26.40 12.44 2.12
KIDS5 No children 7.62 ns 8.61 0.89
HEALTH1 Excellent -0.39 ns 7.21 -0.05
HEALTH2 Very good 1.00 ns 6.94 0.14
HEALTH3 Good Reference category
HEALTH4 Fair -15.68 ns 12.17 -1.29
HEALTH5 Poor -2.32 ns 29.39 -0.08
REL_ATT1 At least once a week 51.31 9.21 5.57
REL_ATT2 At least once a month' Reference category
REL_ATT3 3 or 4 times a year -0.81 ns 10.15 -0.08
REL_ATT4 Once or twice a year -3.48 ns 10.55 -0.33
REL_ATT5 Not at all 4.10 ns 8.53 0.48
INCOME1 Under $20,000 28.35 10.15 2.80
INCOME2 $20,000-$39,999 -1.21 ns 7.91 -0.15
INCOME3 $40,000-$59,999 Reference category
INCOME4 $60,000-$79,999 10.61 ns 7.69 1.38
INCOME5 $80,000 or more -26.63 7.59 -3.51
(Constant) 82.52 13.94 5.92
Adjusted R-square: 4.8% Standard error: 141.8 No. of observations: 2,988 ns: b-coefficient not significant at the 95% level of confidence.
Regression 2a: Volunteer Hours as a Function of Employer Support
Permission to Use Company Facilities or Equipment
Variable b-coefficient Standard error t-statistic DEPENDENT Volunteer hours
ZAQ22B Time off to volunteer 27.77 6.78 4.10
FULLTIME Full time employee -26.05 7.54 -3.45
AGE1 Age 15-24 -28.72 10.76 -2.67
AGE2 Age 25-34 10.36 ns 7.66 1.35
AGE3 Age 35-44 Reference category
AGE4 Age 45-54 -8.16 ns 8.21 -1.00
AGE5 Age 55+ -18.41 ns 11.41 -1.61
SEX1 Male 28.86 5.53 5.22
REGION1 Atlantic 8.95 ns 10.35 0.86
REGION2 Quebec 2.02 ns 7.47 0.27
REGION3 Ontario Reference category
REGION4 Man/Sask -26.92 10.19 -2.64
REGION5 Alta/BC'. 0.56 ns 6.81 0.08
EDUC1 No high school diploma -21.94 9.70 -2.26
EDUC2 High school diploma Reference category
EDUC3 Some post-sec/trades -12.94 ns 8.11 -1.60
EDUC4 College/ CEGEP -5.26 ns 8.36 -0.63
EDUC5 Univers. degree 16.25 ns 8.54 1.90
STUDENT1 Full-time student 4.94 ns 12.77 0.39
STUDENT2 Part-time student -14.19 ns 15.64 -0.91
STUDENT3 Not a student Reference category
KIDS1 Youngest 0- 5 yrs -20.04 9.57 -2.09
KIDS2 Youngest 6-12 yrs Reference category
KIDS3 Youngest 13-17 yrs -7.15 ns 11.28 -0.63
KIDS4 Youngest 18+ yrs 24.04 ns 12.41 1.94
KIDS5 No children 5.51 ns 8.58 0.64
HEALTH1 Excellent -0.42 ns 7.19 -0.06
HEALTH2 Very good 1.58 ns 6.92 0.23
HEALTH3 Good Reference category
HEALTH4 Fair -14.47 ns 12.14 -1.19
HEALTH5 Poor -8.99 ns 29.33 -0.31
REL_ATT1 At least once a week 51.56 9.18 5.62
REL_ATT2 At least once a month' Reference category
REL_ATT3 3 or 4 times a year -4.13 ns 10.14 -0.41
REL_ATT4 Once or twice a year -4.40 ns 10.51 -0.42
REL_ATT5 Not at all 3.50 ns 8.50 0.41
INCOME1 Under $20,000 28.13 10.12 2.78
INCOME2 $20,000-$39,999 -1.52 ns 7.88 -0.19
INCOME3 $40,000-$59,999 Reference category
INCOME4 $60,000-$79,999 9.22 ns 7.67 1.20
INCOME5 $80,000 or more -27.67 7.57 -3.66
(Constant) 79.52 13.92 5.71
Adjusted R-square: 5.3% Standard error: 141.4 No. of observations: 2,988 ns: b-coefficient not significant at the 95% level of confidence.
Regression 2b: Volunteer Hours as a Function of Employer Support
Time Off to Volunteer
Variable b-coefficient Standard error t-statistic DEPENDENT Volunteer hours
ZAQ22C Change of work hours schedule 27.95 6.98 4.01
FULLTIME Full time employee -24.10 7.54 -3.20
AGE1 Age 15-24 -28.89 10.76 -2.68
AGE2 Age 25-34 10.26 ns 7.67 1.34
AGE3 Age 35-44 Reference category
AGE4 Age 45-54 -7.49 ns 8.21 -0.91
AGE5 Age 55+ -18.69 ns 11.41 -1.64
SEX1 Male 27.74 5.53 5.01
REGION1 Atlantic 8.31 ns 10.35 0.80
REGION2 Quebec 0.43 ns 7.44 0.06
REGION3 Ontario Reference category
REGION4 Man/Sask -26.89 10.19 -2.64
REGION5 Alta/BC'. -0.44 ns 6.81 -0.07
EDUC1 No high school diploma -23.42 9.69 -2.42
EDUC2 High school diploma Reference category
EDUC3 Some post-sec/trades -12.72 ns 8.11 -1.57
EDUC4 College/ CEGEP -5.83 ns 8.35 -0.70
EDUC5 Univers. degree 15.91 ns 8.54 1.86
STUDENT1 Full-time student 3.78 ns 12.77 0.30
STUDENT2 Part-time student -13.94 ns 15.64 -0.89
STUDENT3 Not a student Reference category
KIDS1 Youngest 0- 5 yrs -19.76 9.57 -2.06
KIDS2 Youngest 6-12 yrs Reference category
KIDS3 Youngest 13-17 yrs -5.22 ns 11.29 -0.46
KIDS4 Youngest 18+ yrs 26.21 12.40 2.11
KIDS5 No children 6.48 ns 8.57 0.76
HEALTH1 Excellent -0.61 ns 7.19 -0.08
HEALTH2 Very good 0.94 ns 6.92 0.14
HEALTH3 Good Reference category
HEALTH4 Fair -13.79 ns 12.15 -1.14
HEALTH5 Poor -1.53 ns 29.29 -0.05
REL_ATT1 At least once a week 50.17 9.19 5.46
REL_ATT2 At least once a month' Reference category
REL_ATT3 3 or 4 times a year -3.99 ns 10.14 -0.39
REL_ATT4 Once or twice a year -4.90 ns 10.51 -0.47
REL_ATT5 Not at all 3.38 ns 8.50 0.40
INCOME1 Under $20,000 29.71 10.12 2.94
INCOME2 $20,000-$39,999 -1.10 ns 7.88 -0.14
INCOME3 $40,000-$59,999 Reference category
INCOME4 $60,000-$79,999 9.40 ns 7.67 1.23
INCOME5 $80,000 or more -26.63 7.57 -3.52
(Constant) 79.20 13.93 5.69
Adjusted R-square: 5.3% Standard error: 141.4 No. of observations: 2,988 ns: b-coefficient not significant at the 95% level of confidence.
Regression 2c: Volunteer Hours as a Function of Employer Support
Change of Work Hours Schedule
Variable b-coefficient Standard error t-statistic DEPENDENT Volunteer hours
ZAQ22D Recognition/letter of thanks -4.47 ns 7.98 -0.56
FULLTIME Full time employee -24.58 7.56 -3.25
AGE1 Age 15-24 -27.95 10.80 -2.59
AGE2 Age 25-34 10.62 ns 7.69 1.38
AGE3 Age 35-44 Reference category
AGE4 Age 45-54 -8.42 ns 8.23 -1.02
AGE5 Age 55+ -19.86 ns 11.44 -1.74
SEX1 Male 28.69 5.54 5.18
REGION1 Atlantic 7.38 ns 10.38 0.71
REGION2 Quebec -0.89 ns 7.48 -0.12
REGION3 Ontario Reference category
REGION4 Man/Sask -26.58 10.22 -2.60
REGION5 Alta/BC'. -0.24 ns 6.83 -0.04
EDUC1 No high school diploma -24.23 9.72 -2.49
EDUC2 High school diploma Reference category
EDUC3 Some post-sec/trades -12.54 ns 8.14 -1.54
EDUC4 College/ CEGEP -6.36 ns 8.37 -0.76
EDUC5 Univers. degree 15.91 ns 8.56 1.86
STUDENT1 Full-time student 4.58 ns 12.80 0.36
STUDENT2 Part-time student -14.71 ns 15.68 -0.94
STUDENT3 Not a student Reference category
KIDS1 Youngest 0- 5 yrs -20.13 9.60 -2.10
KIDS2 Youngest 6-12 yrs Reference category
KIDS3 Youngest 13-17 yrs -7.70 ns 11.31 -0.68
KIDS4 Youngest 18+ yrs 26.20 12.44 2.11
KIDS5 No children 7.86 ns 8.59 0.91
HEALTH1 Excellent -0.30 ns 7.21 -0.04
HEALTH2 Very good 1.22 ns 6.95 0.18
HEALTH3 Good Reference category
HEALTH4 Fair -15.54 ns 12.17 -1.28
HEALTH5 Poor -1.46 ns 29.39 -0.05
REL_ATT1 At least once a week 51.15 9.21 5.55
REL_ATT2 At least once a month' Reference category
REL_ATT3 3 or 4 times a year -0.34 ns 10.16 -0.03
REL_ATT4 Once or twice a year -3.13 ns 10.55 -0.30
REL_ATT5 Not at all 4.32 ns 8.52 0.51
INCOME1 Under $20,000 28.37 10.14 2.80
INCOME2 $20,000-$39,999 -1.16 ns 7.90 -0.15
INCOME3 $40,000-$59,999 Reference category
INCOME4 $60,000-$79,999 10.77 ns 7.69 1.40
INCOME5 $80,000 or more -26.45 7.59 -3.49
(Constant) 82.85 13.95 5.94
Adjusted R-square: 4.8% Standard error: 141.8 No. of observations: 2,988 ns: b-coefficient not significant at the 95% level of confidence.
Regression 2d: Volunteer Hours as a Function of Employer Support
Recognition/Letter of Thanks
B
B
IIBBLLIIOOGGRRAAPPHHYYBass, Bernard: Achieving a Productive Aging Society. Westport, Connecticut, Auburn House, 1993.
Corporate Leadership Council Advisory Board Company: Corporate Volunteer
Programs: Fact Brief. Washington, D.C., 1994.
Duchesne, Doreen: Giving Freely: Volunteers in Canada. Statistics Canada, Catalogue 71-602, 1989.
Gidron, Benjamin: "Volunteer Workers: A Labour Economy Perspective," in
Labour and Society, Vol. 5, No. 4, 1980.
Hart, Kenneth D.: Employee Volunteerism: Employer Practices and Policies.
Ottawa, Conference Board of Canada, 1986.
Jusenius, Carol L.: Retirement and Older Americans' Participation in Volunteer
Activities. Washington, D.C.,: National Commission for Employment Policy, 1983.
Ross, David and Richard Shillington: A Profile of the Canadian Volunteer: A
Guide to the 1987 Volunteer Activity in Canada. Ottawa, National Voluntary
Organizations, 1987.
Ross, David: Economic dimensions of volunteer work in Canada. Ottawa, Dept. of the Secretary of State of Canada, 1990.
Statistics Canada: Caring Canadians, Involved Canadians. Highlights of the 1997 National Survey of Giving, Volunteering and Participating. Catalogue 71-542 XPE, 1998.