Munich Personal RePEc Archive
The Firms Speak: What the World
Business Environment Survey Tells Us
about Constraints on Private Sector
Development
Kaufmann, Daniel and Batra, Geeta and Stone, Andrew H.
W.
2003
Online at
https://mpra.ub.uni-muenchen.de/8213/
The Firms Speak: What the World Business Environment Survey Tells Us about Constraints on Private Sector Development
Geeta Batra, Daniel Kaufmann and Andrew H. W. Stone*
What do active managers view as their main obstacles to operation and growth of their firms? What conditions are associated with a higher level of enterprise growth? Why do firms so frequently opt to function unofficially? What makes reforms so difficult, especially in countries with influential private firms? Is corruption less harmful to business operation when it is
predictable?
Listening to what managers and entrepreneurs say about the obstacles they face, especially through structured surveys, has proven to be an effective way to evaluate the constraints a particular business environment imposes.1 This information is important not only for the firms themselves but for the growth of the larger economy and the progress of society. If private enterprises are a critical path out of poverty2 through employment or ownership, then establishing conditions for their growth must be a key component of a poverty-reduction
strategy. The enabling conditions for enterprise growth and operation are often referred to as the business environment. The World Bank’s World Business Environment Survey (WBES) offers important insights as to what is needed to improve the business environment, based on what businesses themselves say about conditions they need to grow and the impediments they face.
What is the World Business Environment Survey?
The WBES represents a major effort by the World Bank Group and partner institutions to implement a standard core enterprise survey to evaluate business conditions in a large, cross-regional set of member countries. The survey was administered on a roughly parallel basis in all 80 countries throughout the world, plus the West Bank and Gaza (for a list of countries, see Appendix A). It uses a uniform methodology and parallel parameters for sample structure. In general, at least 100 firms were surveyed in each country. The WBES sought to assess the state of the enabling environment---the conditions for private enterprise growth, focusing on local economic policy, governance3, regulatory, infrastructure and financial barriers, and services to businesses. The survey represents an important step toward standardizing evaluations of the conditions for private investment in developing and transition countries around the world. It provides a basis to make regional comparisons of investment climate and business environment conditions. Furthermore, it permits comparisons of the severity of constraints affecting enterprise depending on their characteristics, such as size or ownership.4
1
See Stone (1992).
2
See IFC (2000).
3
Governance here refers primarily to the degree of corruption, as well as qualities of the state in underpinning markets, such as transparency, fairness, accountability, efficiency and effectiveness.
4
Readers may access the core dataset of WBES at http://www.worldbank.org/privatesector/ic/ic_ica_resources.htm
The results are particularly important in the context of economic globalization. Against a backdrop of growing competition and globalization, member countries are increasingly concerned about the conduciveness of their business environment to private investment and business development, and their relative standing in their region or globally. Unfortunately, there are very few indicators that allow objective measurement and comparison of the business
environment, its binding constraints, and the quality and integrity of supportive and regulatory public services. Nor have there been adequate benchmarks of the relative change in the severity of constraints and the quality of business services over time. The WBES sought to fill that gap.
The WBES team sought to accomplish the following objectives:
• To provide feed back from enterprises on the state of the private sector.
• To measure the quality of governance and public services including the extent of corruption. • To provide better information on constraints to private sector growth, from the enterprise
perspective.
• To sensitize client governments to the importance of listening to firms and using this information to critically assess policies.
• To establish the basis for internationally comparable indicators which can track changes in the business environment over time, thus allowing an assessment of the impact of market-oriented reforms on private enterprises.
• To stimulate systematic public-private dialogue on business perceptions and the agenda for reform.
The surveys were carried out over a period of roughly one and a half years between the end of 1998 and the middle of 2000. Data were collected though personal interviews conducted at the managerial level in enterprises in most regions, with the exception of Africa, where surveys by mail predominated. Response rates were generally high, with the exception of responses to questions on bribery. By region, response rates were among the lowest in Africa. The analyses in this report are based on a sample of 10,032 enterprises that responded to the core questionnaire.
Table 9-1: Distribution of WBES Sample by Region, Size and Sector (percent of firms)
Manufacturing
Services/
Commerce Agriculture Construction Other Total Firms
Small 16.7 28.9 5.7 24.2 24.4 508
Medium 30.1 26.8 8.0 16.3 18.8 485
Large 36.6 25.4 8.7 14.0 15.4 358
Total 26.8 27.2 7.3 18.7 20.0 1351
MENA
Small 60.0 20.0 0.0 8.9 11.1 45
Medium 31.6 35.5 6.6 7.9 18.4 76
Large 31.0 41.4 8.6 8.6 10.3 58
Total 38.5 33.5 5.6 8.4 14.0 179
East Asia/NIC China
Small 43.21 39.51 4.94 11.11 1.23 134
Medium 64.12 20 1.76 12.35 1.76 89
Large 82.57 9.17 1.83 6.42 0.0 78
Total 65 21.11 2.5 10.28 1.11 301
East Asia Developing
Small 36.4 54.5 3.5 5.6 0.0 536
Medium 48.7 45.5 1.1 4.7 0.0 279
Large 68.8 28.1 3.1 0.0 0.0 128
Total 44.4 48.3 2.8 4.6 0.0 943
SOUTH ASIA
Small 50.0 40.6 0.9 8.5 0.0 106
Medium 63.4 22.6 2.7 11.3 0.0 186
Large 79.2 12.3 1.9 6.6 0.0 106
Total 64.1 24.6 2.0 9.3 0.0 398
Latin America
Small 36.4 53.6 2.0 8.1 0.0 459
Medium 45.1 47.1 1.5 6.3 0.0 669
Large 53.4 38.5 3.5 4.6 0.0 481
Total 45.1 46.4 2.2 6.3 0.0 1609
OECD
Small 21.7 64.5 1.3 12.6 0.0 318
Medium 30.3 60.2 1.0 8.3 0.0 389
Large 33.5 63.5 0.6 2.4 0.0 167
Total 27.8 62.36 1.0 8.7 0.0 874
CIS
Small 20.8 63.5 4.4 8.2 3.1 903
Medium 49.3 34.7 5.7 6.6 3.7 683
Large 60.3 27.0 6.3 5.2 1.1 174
Total 35.8 48.7 5.1 7.3 3.1 1760
CEE
Small 21.9 60.6 7.2 9.9 0.4 718
Medium 29.2 27.7 30.2 12.9 0.1 902
Total 28.0 40.1 20.6 11.0 0.2 1749
Note: Table omits firms that could not be classified by main activity and size due to missing information.
WHAT DO ACTIVE MANAGERS VIEW AS THEIR MAIN OBSTACLES TO OPERATION AND GROWTH?
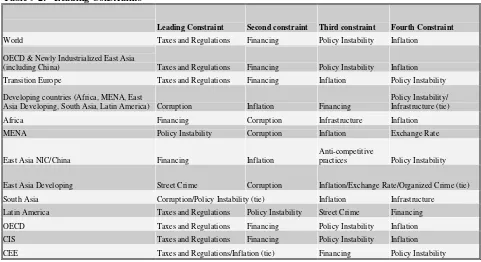
The survey asked respondents to rate how problematic were a set of general constraints for the growth and operation of their firm. Table 9-2 presents the ranking of responses for the world, by regional groups and by individual region to the following question: “Please judge on a four-point scale how problematic are the following factors for the operation and growth of your firm.” Four constraints stand out (based on a simple average for the overall world sample): taxes and
regulations, financing, policy uncertainty/instability and inflation. Indeed, if we were to focus on a simple average for the overall world sample, the following constraints stand out: taxes and regulations, financing, policy uncertainty/instability, and inflation.
Yet such worldwide average results mask crucial differences across regions, and particularly between industrialized and developing countries. For OECD, newly industrialized East Asian countries, and transition economies, the leading obstacles identified by the firms where indeed taxes and regulations, financing, policy instability, and inflation. However, for developing regions as a group (Africa; Latin America and the Caribbean, LAC; Middle East/North Africa, MENA; South Asia; and East Asia) the leading constraint is corruption, followed by inflation, financing, policy instability, and infrastructure. Indeed, in four developing regions, South Asia, Africa, developing East Asia and MENA, corruption figures as one of the three leading
constraints.
Other important regional differences emerge as we examine individual regions. For example, in Developing East Asia, street crime imposes the leading constraint, whereas in Africa,
infrastructure problems are identified as one of the top three constraints. In Central and Eastern Europe (CEE), inflation ties with taxes and regulations as the leading constraints. The large variance across regions (and countries) in the severity assigned by responding firms to the various constraints points to the importance of assessing the results by region and country, rather than relying on worldwide averages. For Africa and East Asia, taxes and regulations are notably absent from the leading constraints. Surprisingly, in Transition Europe (CIS and CEE), although corruption is quite prevalent in the region and an important problem for about half the firms, it is not among the top four constraints.
Table 9-2: Leading Constraints
Leading Constraint Second constraint Third constraint Fourth Constraint
World Taxes and Regulations Financing Policy Instability Inflation
OECD & Newly Industrialized East Asia
(including China) Taxes and Regulations Financing Policy Instability Inflation
Transition Europe Taxes and Regulations Financing Inflation Policy Instability
Developing countries (Africa, MENA, East
Asia Developing, South Asia, Latin America) Corruption Inflation Financing
Policy Instability/ Infrastructure (tie)
Africa Financing Corruption Infrastructure Inflation
MENA Policy Instability Corruption Inflation Exchange Rate
East Asia NIC/China Financing Inflation
Anti-competitive
practices Policy Instability
East Asia Developing Street Crime Corruption Inflation/Exchange Rate/Organized Crime (tie) South Asia Corruption/Policy Instability (tie) Inflation Infrastructure
Latin America Taxes and Regulations Policy Instability Street Crime Financing OECD Taxes and Regulations Financing Policy Instability Inflation CIS Taxes and Regulations Financing Policy Instability Inflation
CEE Taxes and Regulations/Inflation (tie) Financing Policy Instability
[image:6.612.69.550.80.342.2]Finance. The second leading general constraint for the global sample is financing (Table 9.3). Firms in Central and Eastern Europe are most likely to identify it as seriously constraining, followed by those in CIS countries, and then those in Africa, South Asia and Latin America. Globally, while financing is identified as the second-leading constraint by small and medium enterprises, it ranks as fourth for large enterprises.
Table 9-3: Financing Constraints (percent of firms rating constraint “major” or “moderate")
Financing Constraints
Africa MENA
East Africa NIC/China
East Asia Developing
South Asia
Latin
America OECD CIS CEE
High interest rates 83.5 67.4 40.3 72.5 83.9 87.6 47.8 80.6 79.5 Lack access to long term loan n.a. n.a. 31.2 52.0 65.1 63.1 20.0 58.7 67.0 Collateral requirements 519 45.2 30.1 43.6 58.5 65.1 35.7 49.7 52.2 Bank paperwork 47.1 51.6 29.9 34.6 56.6 63.0 38.9 52.9 48.3 Inadequate credit info on
clients
51.7 46.3 27.0 48.4 46.7 46.1 23.5 40.1 41.6
Special connections 38.2 33.3 26.3 39.6 44.5 46.5 26.5 35.1 43.1 Banks lack money to lend 28.4 33.0 20.6 52.2 35.1 39.1 14.3 37.4 46.8 Access to specialized export
finance
44.9 39.8 15.1 33.7 36.4 34.7 16.5 35.5 38.8
Access to non-bank equity 43.1 36.2 13.0 32.6 34.9 35.6 18.1 38.3 42.0 Access to lease finance 38.2 29.3 13.1 34.9 32.9 34.1 19.3 32.7 48.9 Access to foreign banks 43.6 29.3 11.7 41.5 33.9 35.0 11.1 35.3 40.4 Corruption of bank officials 23.5 27.4 19.0 45.1 28.9 18.6 5.7 24.3 29.3
most common source of finance, followed by “own capital or equity”. Because of different measurement methods, data for Africa cannot be compared to those for other regions.
Table 9-4: Sources of Finance (percent of total by region)
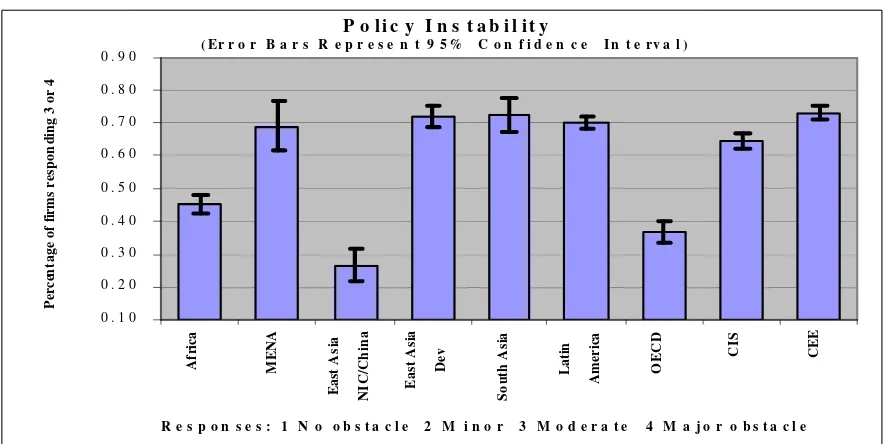
Policy Uncertainty and Instability
Firms’ views of this constraint vary widely by region (Figure 9-1). At one extreme, more than 70 percent of firms in South Asia, Central and Eastern Europe and Developing East Asia report policy instability as seriously constraining, with firms in Latin America, MENA, and CIS close behind. By contrast, only 26 percent of firms in East Asia NIC and China identified this
constraint as “major” or “moderate”, and also only 37 percent of firms in OECD countries did so.
Firms differ by region in the particular dimension of policy instability that troubles them. Over 70 percent of firms in CEE, over 60 percent of firms in CIS countries and Developing East Asia, and about half of firms in LAC find economic and financial policies unpredictable. In CEE and Africa, nearly three quarters of firms rated changes in rules, laws and regulations affecting them as being unpredictable, while two-thirds of firms did so in CIS. With regard to advance
notification of changes in laws and policies affecting them, 68 percent of firms in CEE, 60 percent of CIS firms, and 57 percent Latin American firms responding reported that they were “seldom” or “never” notified in advance of changes affecting them. Finally, there is a question of whether government considers businesses’ views in the formulation of legal and policy changes. In Transition Europe, MENA and Latin America the majority of firms suggest that this is relatively rare.
East Asia NIC/China
East Asia Dev
South Asia
Latin
America OECD CIS CEE
Internal funds/
Retained Earnings 48.3 33.9 26.5 43.2 39.1 53.9 70.5
Local commercial
banks 11.6 15.7 18.5 19.8 14.6 11.4 4.8
Family/Friends 3.3 9.9 6.3 4.3 2.3 8.6 7.3
Supplier Credit 7.9 3.2 2.5 10.2 4.8 4.6 5.8
Equity, sale of stock 5.8 2.7 6.4 3.2 8.5 8.6 1.4
Other State Sources 0.6 0.4 0.8 0.9 2.0 4.6 7.4
Foreign Banks 3.3 4.8 2.6 4.0 1.5 2.1 0.6
Leasing Arrangement 2.1 0.7 1.3 1.3 3.3 3.6 2.6
Other 1.1 1.8 5.5 2.9 1.5 1.4 1.4
Investment Funds/ Special Development
Finance 2.6 1.2 4.4 2.2 2.3 1.7 1.3
Moneylenders 2.9 1.7 1.1 1.1 2.3 2.5 1.6
East Asia NIC/China
East Asia Dev
South Asia
Latin
America OECD CIS CEE
Internal funds/
Retained Earnings 48.3 33.9 26.5 43.2 39.1 53.9 70.5
Local commercial
banks 11.6 15.7 18.5 19.8 14.6 11.4 4.8
Family/Friends 3.3 9.9 6.3 4.3 2.3 8.6 7.3
Supplier Credit 7.9 3.2 2.5 10.2 4.8 4.6 5.8
Equity, sale of stock 5.8 2.7 6.4 3.2 8.5 8.6 1.4
Other State Sources 0.6 0.4 0.8 0.9 2.0 4.6 7.4
Foreign Banks 3.3 4.8 2.6 4.0 1.5 2.1 0.6
Leasing Arrangement 2.1 0.7 1.3 1.3 3.3 3.6 2.6
Other 1.1 1.8 5.5 2.9 1.5 1.4 1.4
Investment Funds/ Special Development
Finance 2.6 1.2 4.4 2.2 2.3 1.7 1.3
Figure 9-1: Policy Instability by Region (percent of firms responding 3 or 4 [seriously constraining).
Corruption and Governance
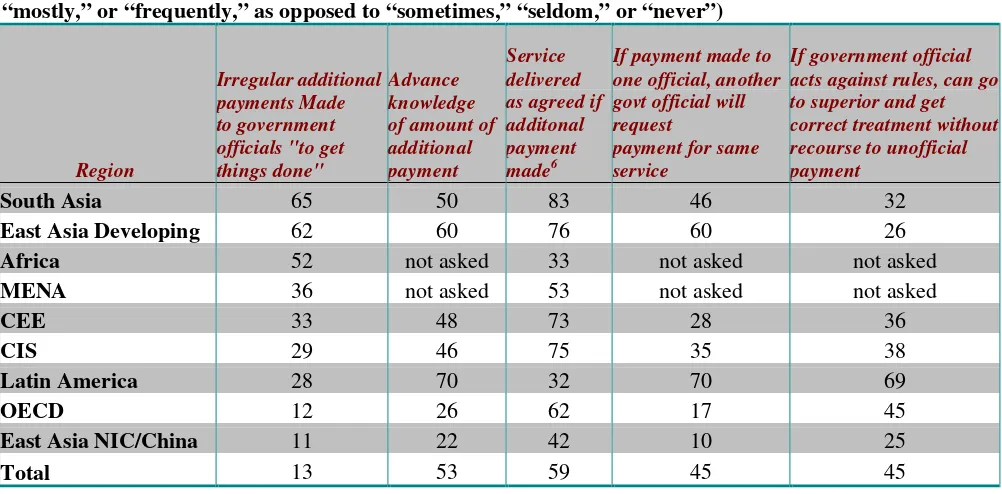
Corruption is identified as a serious constraint by over 70 percent of firms in South Asia and nearly as many in Developing East Asia and MENA (Table 9-5). Sixty-four percent of firms in Africa, almost 60 percent of those in Latin America and about half in the CIS and Central and Eastern Europe report it a serious impediment. This contrasts with the much lower share (about 20 percent) of firms in NIC East Asia/China5 and in OECD countries that rate it as a “major” or “moderate” obstacle. Further, in many of the developing countries, the majority of firms reported that it was common “in their line of business to have to pay some irregular ‘additional payments’ to get things done”. The data on firms’ reported percentage of total revenue paid every year in bribes clearly and positively correlate with the data on the degree to which firms find corruption constraining. An important manifestation of weak governance is the extent to which registered firms operate unofficially. Related to this is the degree to which firms comply with tax laws. While there are variations from region to region, about half the firms in the global sample indicated that they report no more than 80 percent of their revenues.
5
The subcontractor carrying out the survey in China could ask only this general constraint question about corruption. Thus, no data from further detailed questions on this topic was therefore obtained.
P o l i c y I n s t a b i l i t y
( Er r o r B a r s R e p r e s e n t 9 5 % C o n f i d e n c e I n t e r v a l )
0 . 1 0 0 . 2 0 0 . 3 0 0 . 4 0 0 . 5 0 0 . 6 0 0 . 7 0 0 . 8 0 0 . 9 0
A
f
rica
MENA
Eas
t As
ia
NIC
/C
h
ina
East As
ia
Dev
So
ut
h As
ia
Lat
in
Amer
ica
OECD
CIS CEE
Perc
en
ta
ge of fir
ms respo
n
di
ng 3 or
4
E ffic i e n c y o f G o v t S e r v i c e
P r o v isio n
% firm s t h a t r a t e a 4 , 5 , 6 (in e f f i c e n t)
C E E 7 0 %
L a tin A m e ric a 6 3 %
C IS 6 3 %
S o u t h A s i a 5 8 %
O E C D 5 0 %
E a s t A s i a D e v 4 0 %
[image:9.612.71.572.86.333.2]E a s t A s i a N I C / C h i n a 1 6 %
Figure 9-5: Indicators of Corruption by Region (percent of firms that responded “always,” “mostly,” or “frequently,” as opposed to “sometimes,” “seldom,” or “never”)
Region
Irregular additional payments Made to government officials "to get things done"
Advance knowledge of amount of additional payment
Service delivered as agreed if additonal payment made6
If payment made to one official, another govt official will request
payment for same service
If government official acts against rules, can go to superior and get correct treatment without recourse to unofficial payment
South Asia 65 50 83 46 32
East Asia Developing 62 60 76 60 26
Africa 52 not asked 33 not asked not asked
MENA 36 not asked 53 not asked not asked
CEE 33 48 73 28 36
CIS 29 46 75 35 38
Latin America 28 70 32 70 69
OECD 12 26 62 17 45
East Asia NIC/China 11 22 42 10 25
Total 13 53 59 45 45
Quality of Public Services
About two-thirds of firms in Central Europe, Latin America, and the CIS countries, and nearly 60 percent in South Asia, report that the government is inefficient in delivering services (Table 9-6). The evaluation varies according to types of public services and institutions. On average, the majority of firms give a negative evaluation for public health, parliament, and public
works/roads, while over 40 percent negatively evaluate the courts, police, education services, and central government leadership. By contrast, the most positive ratings go to the postal, telephone and electric power services.
Table 9-6 Government Efficiency
(percent of firms that rate a 4,5, or 6 [inefficient])
6
Firm Characteristics
The rich details of the WBES dataset permits an investigation of how a variety of firm characteristics, such as size and type of ownership, affect their experience and perceptions of constraints. For example, the data allow an investigation of whether the implicit ‘tax’ imposed by inappropriate government policies and regulations is evenly or unevenly distributed across different types of firms within a country. To do so, the authors analyzed the influence of firm characteristics on their response to key potential obstacles to business operation and growth, using a multivariate regression approach to control for country effects.
The econometric review (see Table 9-7, below) suggests that firms that are private, smaller, newer, devoid of foreign direct investment (FDI), and cater to the domestic market generally tend to face more acute business constraints than firms that are older, larger, exporting, have FDI, and/or are State-Owned (SOEs).7 There are some notable exceptions regarding some business constraints, however. Older firms report being more constrained by political instability than younger firms, and exporters are hit harder by inflation than non-exporters, for instance.
A detailed reading of the data suggests the complex interaction of firm characteristics with business environment conditions. For example, corruption is seen as more constraining by smaller and younger firms, but also by those with government or public ownership and those that export. An inadequate exchange rate regime appears to be felt more by medium-sized firms, younger firms and those with some state ownership.
In terms of firm size, globally on average, small and medium firms report being more
constrained than large firms along most dimensions,8 Within SMEs small firms are generally more constrained than medium-sized firms. This may be either because the objective conditions of relatively larger firms are better or because they can better cope with constraints.9
However, an exploration of the full results also gives rise to the notion of the forgotten middle. In facing some obstacles to doing business, medium-sized firms identify themselves as equally or even more constrained than do small firms (Table 9-7 and Figure 9-2). In particular, medium-sized firms show no statistical difference from small firms in their rating of several general constraints and are significantly more likely to be seriously constrained by tax administration and infrastructure. With regard to infrastructure, large firms show a statistical higher degree of constraint than medium and small firms. These results suggest that policy interventions which unduly focus on micro- and/or small enterprises may overlook important constraints to medium-sized enterprises or all private enterprises. To focus only on small firms would ignore the plight of mid-sized firms. 10 In fact, the complexity characterizing the way in which different
7
Both OLS and probit models for the different constraints were estimated using firm characteristics as explanatory variables, but because of the similar results, only the OLS results are reported.
8
See Schiffer and Weder (2001).
9
For a more in-depth analysis of size effects, see the chapter by Beatrice Weder in this volume.
10
This may be related to a “threshold effect”, where obstacles may not constrain entry so much as they deter growth
from small to medium size. As Brian Levy (1993) explains, “The threshold burden comprises a discontinuity in the
obstacles appear to affect different types of enterprises reinforces the rationale for focusing on across-the-board reduction of obstacles to businesses, rather than the (often unproductive) earmarking of targeted policies according to firms' characteristics, such as size.11
Table 9-7: Effect of Firm Characteristics on Obstacle Severity: Results of Least Square Estimates Explanatory variables
Dependent
variable Small Size Firm Medium Size Firm Firms with foreign ownership Firms with government control Firms that export Located in Large city Located in Small city
N
Finance a 0.222*
(0.034) 0.159* (0.031) -0.329* (0.030) 0.105* (0.036) 0.065* (0.025) 0.021 (0.029) 0.055 (0.034) 9211 Taxes and regulations 0.071* (0.026) 0.080* (0.026) -0.096* (0.025) -0.169* (0.029) 0.005 (0.021) 0.002 (0.025) 0.018 (0.028) 9384
Inflation a 0.173*
(0.030) 0.096* (0.027) -0.084* (0.027) -0.076* (0.032) -0.053** (0.022) -0.032 (0.027) 0.011 (0.030) 9111
Exchange rate a 0.089*
(0.033) 0.031 (0.030) 0.058** (0.028) -0.108* (0.036) 0.116* (0.025) 0.021 (0.029) 0.089* (0.034) 8990
Corruption a 0.205*
(0.034) 0.112* (0.031) -0.054 (0.031) -0.165* (0.037) 0.003 (0.025) 0.016 (0.031) 0.029 (0.036) 8359 Tax
Administration b
0.053 (0.032) 0.063** (0.029) -0.057** (0.028) -0.175* (0.034) 0.012 (0.023) 0.011 (0.028) 0.071** (0.032) 9479
Infrastructureb,c -0.082
(0.032) -0.022 (0.029) 0.007 (0.028) -0.128* (0.033) -0.018 (0.023) 0.019 (0.027) 0.047 (0.032) 9119
Policy instability 0.041
(0.032) 0.035 (0.029) -0.018 (0.029) -0.113* (0.034) 0.012 (0.023) -0.033 (0.028) -0.004 (0.032) 9016
High Taxes b 0.074*
(0.027) 0.085* (0.029) -0.093* (0.026) -0.238* (0.031) -0.004 (0.021) 0.017 (0.026) 0.028 (0.029) 9695
Street Crime 0.188*
(0.033) 0.074* (0.030) -0.077* (0.029) -0.109* (0.035) -0.077* (0.024) -0.003 (0.029) -0.016 (0.034) 8801
Bribes as % of sales a
0.254* (0.059) 0.159* (0.055) -0.077 (0.050) -0.257* (0.072) -0.075 (0.042) 0.014 (0.048) 0.055 (0.056) 5234
* significant at 1% level; ** significant at 5% level; *** significant at 10% level.
Note: All dependent variables are constraints measured on a scale of 1-4 with 4 = major obstacle and 1=no obstacle. Foreign ownership, export orientation, government control are represented by indicator variables with a valueof 1 for presence and 0 otherwise. Firm size and location are represented by indicator variables. Large firm size is the omitted category for size; firms in the capital city constitute the omitted category for location. Country dummies have been included in regressions but not reported here.
acoefficient for small firms is statistically significantly different (higher) than coefficient for small firms using F-test in multiple regression (a test for the statistical significance of the observed differences among the means).
b
coefficient for medium is statistically significantly different (higher) from coefficient for small firms using F-test in multiple regression c
coefficient for large is statistically significantly different (higher) from coefficient for medium and small firms using F-test in multiple regression.
size. This discontinuity can lead some firms to rein in expansion – or to expand inefficiently by creating quasi-independent enterprises, each smaller than the threshold at which the tax and regulatory requirements are imposed.”
11
Figure 9-2: Tax and Regulatory Constraint by Firm Size (WBES 2000)
WHAT CONDITIONS ARE ASSOCIATED WITH A HIGHER LEVEL OF ENTERPRISE GROWTH?
The WBES results suggest that firms’ evaluation of the severity of the leading constraints is highly related to firm-level outcomes. An empirical analysis of sales growth at the firm level explored whether and how constraints in the business environment, as perceived by enterprises, are associated with lower sales growth. This analysis has important ramifications for policy makers since, where enterprise growth is correlated with the constraints to business, policies that remove these constraints could lead to growth.
To explore whether and how constraints in the business environment, as perceived by
enterprises, are associated with sales and investment growth, we estimate two regression models which include the constraint rankings for key environment variables. We control for firm attributes such as firm size, export and foreign ownership status, and country differences.12 In the first equation, the dependent variable is the sales growth over a three year period (for example 1996-1998 or 1997-99) reported by firms in the survey. This variable is regressed on key business environment attributes such as corruption, policy instability, taxes and regulations, and financing constraints; and on firm level attributes including firm size, age, export status and foreign ownership. Firm attributes are all represented by indicator variables. The main attributes of the business environment such as financing, corruption, making policy changes and taxes are qualitative perceptions in the survey. To better quantify some of these variables, they were all converted to binary indicator variables (0,1).
Corruption is measured as the frequency of additional payments made by enterprises on a scale of 0-1 with 0 representing the three least frequent responses (never, rarely, sometimes) and 1 representing the three most frequent responses (always, usually, frequently). Similarly
12
Given the absence of an empirical link between key business environment constraints and growth, the objective here is to highlight the associations between different business constraints and growth without making inferences on causality.
Tax and Regulatory Constraint by Firm Size WBES 2000
2.4 2.7 3.0
Small Medium Large
Firm Size
Ta
government consultation of businesses on legal and policy reform13 is represented by a binary variable representing low frequency: a value of one indicates a response that such consultation “never” or “rarely” occurs. A negative coefficient would imply that more frequent consultation is associated with higher growth. High taxes and financing constraints are measured on a scale of 0-1 with 0 indicating a response of “no obstacle” or “minor obstacle”, and 1 indicating that a response of “moderate obstacle” or “major obstacle”. A negative sign on the coefficient of any of these constraint variables, as measured, would reflect the negative relationship between these constraints and growth. Since the variables representing the perceptions of the environment are significantly correlated with each other, stepwise regression methods were employed to
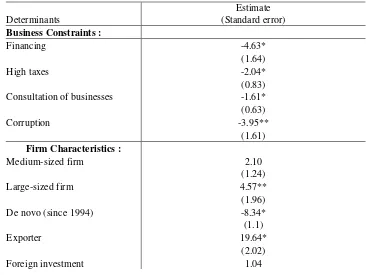
[image:13.612.120.486.299.574.2]determine the most important constraints correlated with growth.14 Firm size, age, export and foreign ownership status of firms are represented by indicator variables. Finally indicator variables were included to represent country effects. Te reference country in the table is Albania.15 Table 9-8 reports the estimated regression parameters.
Table 9-8: Firm Sales Growth and Constraints to Enterprise Growth (dependent variable, sales growth previous three years)
Determinants
Estimate (Standard error)
Business Constraints :
Financing -4.63*
(1.64)
High taxes -2.04*
(0.83)
Consultation of businesses -1.61*
(0.63)
Corruption -3.95**
(1.61)
Firm Characteristics :
Medium-sized firm 2.10
(1.24)
Large-sized firm 4.57**
(1.96)
De novo (since 1994) -8.34*
(1.1)
Exporter 19.64*
(2.02)
Foreign investment 1.04
13
The question asked was: “In case of important changes in laws or policies affecting my business operation, the government takes into account concerns voiced either by me or by my business association.”
14
The approach for stepwise inclusion/exclusion of variables was to maintain certain control variables for firm characteristics whether or not they were significant, but to retain constraint/policy variables only if they had a significant coefficient. Thus tables 9-8 and 9-9 are reporting the outcome of a lengthy set of steps leading to a single final specification.
15
2.13
Constant 14.822
(11.24)
Adjusted R2 0.12
Number of Observations 4560
** : significant at 1% ; * : significant at 5%
Country indicators were included in the above regression. Estimates are available from authors on request.
First, firm attributes, including firm size and the export status of firms, are positively and significantly associated with higher sales growth, while age of the firm is negatively associated with growth. This finding is consistent with the literature.16 Second, and more importantly, the results indicate that several business constraints are significantly associated with sales growth (after controlling for country differences and variations in firm attributes---including age, size, export and foreign ownership status).17 Financing, high taxes and corruption (which are, on average, moderate to major constraints to businesses) are significantly and negatively associated with sales growth. Lack of or infrequent consultation of businesses on policies that affect them also bears a negative relationship with growth.
In the second specification, the dependent variable is change in investment over a three year period (again, typically 1996-99) reported by firms in the survey. As in the earlier model, this variable is regressed on key business environment attributes such as corruption, policy
instability, taxes and regulations, and financing constraints, as well as firm level attributes including firm size, age, export status and foreign ownership. As before, constraints are
represented by indicator variables (0,1) where 0 represents “no obstacle or minor obstacle” and 1 represents “moderate or major obstacle”. The results of the regression are reported in Table 9-9. Policy uncertainty in this regression is measured by changes in predictability of government policies, laws and regulations over the last 3 years, where a 1 indicates no change or a decline in predictability and a zero indicates an improvement in predictability18.
16
See, for example, Batra and Tan (forthcoming); Roberts and Tybout (1996).
17
For example, the coefficient for finance suggests that a firm which identifies itself as constrained to a moderate or major degree by financing, on average, reports a growth rate that is 4.63 percentage points lower than one which is not so constrained (other things equal). A firm seriously constrained by corruption reports, on average, a growth rate 3.95 percent lower than one which is not so constrained.
18
Table 9-9: Firm Investment and Constraints to Enterprise Growth (dependent variable: investment growth previous three years)
Determinants Estimate (Standard error)
Business Constraints :
Financing -2.46*
(0.62)
High taxes -1.69**
(0.73)
Predictability of policies -3.75*
(1.47)
Corruption -2.57***
(1.45)
Firm Characteristics :
Medium-sized firm 2.30
(1.51)
Large-sized firm 2.07
(2.01)
De novo (since 1994) -4.93*
(1.02)
Exporter 10.62*
(1.75)
Foreign investment 0.38
1.84
Constant 46.34*
(9.19)
Adjusted R2 0.13
Number of Observations 3006
*** : significant at 1% ; ** : significant at 5%; *=Significant at 10% level.
Country indicators were included in the above regression. Estimates are available from authors on request.
First, analyzing the firm attributes, it is clear that younger firms and firms that export have higher investment growth than older firms and non-exporters, on average. Among the business
environment attributes, a decline in predictability of changes in economic policies over the last three years, corruption, high taxes and financing are significantly and negatively associated with investment growth.
Taken together, the implications of these findings are important. At the most basic level they suggest that several of the constraints firms rated as most important are significantly related to the actual performance of firms. Second, they imply that, other things equal, in countries with poor conditions in four categories—financing, corruption, high taxes and business consultation— existing businesses’ sales grow an average total of over ten percentage points less than those with positive ratings in all of these categories. Countries with poor conditions in the areas of financing, high taxes, corruption, and policy predictability saw their businesses’ investment levels grow an average of more than ten percentage points less than those with positive ratings in all of these categories. These results are strongly suggestive of the magnitude of benefits
reform taxes, financing, corruption, and policy predictability, the evidence suggests that higher growth and investment are associated with such improvements.
WHY DO FIRMS SO FREQUENTLY OPT TO FUNCTION UNOFFICIALLY?
The WBES results make clear that there is a spectrum of formality from the wholly official to the mostly unofficial (although all WBES firms are officially registered). A large share of officially registered firms hide output and turn unofficial in many countries. The worldwide enterprise data set permits us to test the extent to which firms are hiding output, and the importance of the various potential business environment conditions associated with their decision to do so. It is worth noting that all the firms in our sample are officially registered. We asked each firm to provide an estimate of the percentage of sales revenues that firms like their own report. Based on their responses, we infer that the firms in the sample do not report 19 percent of their gross revenues.
One can hypothesize that the decision of a firm to hide its output may be related to the low benefits it derives from operating officially, and the low cost of crossing over to the unofficial economy.19 In this formulation, the firm makes a rational economic choice as to whether (or how much) to operate officially or unofficially based on the incentive it faces. These incentives are determined by the government’s provision of (or failure to provide) public goods (such as rule of law). Within such a framework, the analysis uses the WBES microeconomic data set to identify the main determinants of the unofficial economy.
To do so, we performed OLS regressions with this firm-level sample, including country effects. The basic econometric specifications in Table 9-10 present the various possible determinants of the unofficial economy behavior of registered firms. A number of policy-related variables are shown to be significantly related to the firm’s extent of underreporting of revenues. On the economic and financial policy side, macroeconomic, regulatory, and tax constraints are significant, other things equal. Where these policies are more constraining, a firm will tend to operate unofficially. Further, governance-related constraints are important. In particular, corruption and problems in some legal variables related to property rights protection—such as copyright violations—are rather significant in determining the propensity of a firm to operate unofficially.
The econometric investigation at the firm level also allows investigation of whether enterprise
characteristics matter as well (controlling for policy and governance variables). As seen in Table 9-10, small or medium firms that produce for the domestic market (non-exporters), lack foreign investment, and are located in large cities (but not necessarily in the capital) tend to engage more in unofficial activity.20
19
This analysis draws from the framework presented by Johnson, Kaufmann and Shleifer (1997) for the unofficial economy in transition, subsequently extended for 69 countries worldwide (Johnson, Kaufmann and Zoido-Lobaton, 1999; Friedman and others 2000).
20
Table 9-10. Underreported Revenues, Corruption, and Protection of Property Rights (using full sample)
Determinants 1 2 3 4 5 6
Business constraints
Financing constraint 0.27 0.11 0.46 0.44 0.27 0.09
0.85 0.33 1.44+ 1.32 0.79 0.25
Inflation constraint –0.01 –0.03 0.07 0.01 –0.05 –0.09
–0.03 –0.12 0.31 0.04 –0.23 –0.37
Policy instability constraint 0.60 0.77 0.77 0.81 0.65 0.81
2.64*** 3.24*** 3.48*** 3.55*** 2.78*** 3.30***
Infrastructure constraint 0.58 0.37 0.75 0.88 0.73 0.51
1.65+ 0.98 2.15** 2.44** 2.00** 1.29
Tax/regulatory constraint 1.37 1.26
3.38*** 2.97***
Rule of law
Bribery (% of revenues) 0.29 0.33 0.31 0.34 0.33 0.37
5.47*** 5.53*** 5.70*** 6.17*** 5.91*** 5.97***
Copyrights violations 2.31 2.36
7.31*** 7.11***
Firm characteristics
Private ownership 0.24 –0.52 0.23 0.25 0.24 –0.55
0.20 –0.39 0.19 0.21 0.20 –0.41
Small firm o 4.35 4.28 4.40 4.50 4.47 4.54
4.43*** 4.07*** 4.48*** 4.38*** 4.35*** 4.13***
Medium-sized firm * 0.93 1.18 0.97 0.84 0.78 1.07
1.05 1.25 1.09 0.91 0.85 1.09
Relatively new (since 1994) –0.14 –0.02 –0.13 –0.05 –0.07 0.10
–0.28 –0.05 –0.26 –0.10 –0.13 0.18
Exporter –0.46 –1.02 –0.54 –1.00 –0.90 –1.16
–0.65 –1.33 –0.76 –1.32 –1.19 –1.41
Foreign investment –3.53 –3.24 –3.58 –3.40 –3.38 –3.06
–4.28*** –3.67*** –4.33*** –4.00*** –3.97*** –3.35***
Location, small city ** –0.18 –0.13 –0.17 –0.09 –0.11 –0.07
–0.18 –0.12 –0.18 –0.08 –0.11 –0.07
Location, large city ** 1.62 1.41 1.61 1.87 1.87 1.72
1.87* 1.51+ 1.87* 2.11** 2.11** 1.79*
Manufacturing *** 1.72 1.56 2.06
0.84 0.77 0.91
Service *** –0.10 –0.04 1.65
–0.04 –0.02 0.62
Agriculture *** –0.52 –0.57 0.55
–0.26 –0.28 0.24
Construction *** 1.98 1.87 2.16
0.91 0.86 0.90
Adjusted R2 .22 .23 .21 .22 .22 .23
Number of observations 4775 4166 4781 4386 4381 3802
*** significant at 1% level; ** significant at 5% level ; * significant at 10% level + significant at 15% level
Dependent variable, underreported revenues (in %, sample mean = 19%).
used for some variables in those countries that were entirely missing observations for that specific variable, in order to maximize the efficiency of estimators without affecting their lack of bias. All firm characteristics are defined as a binary choice.
o Large firms constitute the benchmark; oo Location in capital constitutes the benchmark; ooo Other sectors constitute the benchmark
Source: Kaufmann, Mastruzzi, and Zavaleta 2001.
WHAT MAKES REFORMS SO DIFFICULT, ESPECIALLY IN COUNTRIES WITH INFLUENTIAL PRIVATE FIRMS?
In a number of countries, some influential firms are business environment “makers”, and thus form and shape policies, laws and regulations favorable to their private interests, sometimes through illicit means. Traditional measures of corruption derived from enterprise survey questions focus on the implementation of laws and regulations, and illuminate, in particular, the extent of administrative bribery. However, the transition economy version of the WBES (the Business Environment and Enterprise Performance, or “BEEPS” survey) went further; it assessed the extent to which countries may have experienced good or poor governance in the formation and shaping of the policies, laws, and regulations.21
This research suggests the existence of a significant extent of state capture by the corrupt interests of the enterprise elite in about half the countries in transition (particularly in the CIS, but also in CEE). In those countries, the policies, laws and regulations of the state are reported to have been shaped to a large extent by some firms that have made corrupt payments. The impact of such state capture on the business and investment climate is very large. Analysis indicates that firms in countries that avoided state capture grow much faster and invest significantly more than those subject to state capture.22 Equally important, firms that are “captors” appear, in capture economies, to benefit dramatically from their insider status (figure 9-3). This suggests that liberalizing reforms, which may remove rents and protections, may be resisted not only by public officials, but also by powerful private elites.
This finding has a fundamental policy implication. If, indeed, some firms are not only mere investment climate “takers” but investment climate “makers,” conventional advice to
government officials as to what rules and regulations to reform will continue to have limited impact in those settings subject to state capture by vested interests. Thus the WBES/BEEPS indicators of capture provide a new tool in assessing whether preconditions for successful reform efforts prevail.
21
See Hellman and Kaufmann (2001).
22
Figure 9-3: Effect of “State Capture” on Enterprise Growth
IS CORRUPTION LESS HARMFUL TO BUSINESS OPERATION WHEN IT IS PREDICTABLE?
The prevalence of corruption matters enormously in the firm’s behavior and performance, yet analysis of WBES data suggests that the unpredictability of bribery or corruption does not matter significantly, controlling for the corruption level. This helps to resolve a source of great debate in development literature. While, in general, the literature treating corruption presents it as a
negative factor in development23, some authors claim it is the unpredictability of its costs, rather than the existence or level of corruption, that discourages development.24 Predictability of
corruption is characterized by the bribe payer and receiver both knowing “what it takes” in terms of the nature and amount of payment required, and the degree of certainty that the privately purchased “service” from the official will actually be delivered. The premise is that in settings where corruption is predictable, corruption would have fewer harmful effects: it is, quite literally, business as usual. However, in settings where the degree of unpredictability of corruption is much higher, the effects of corruption would be much more harmful.
The WBES firm-level dataset permits an empirical evaluation of the “unpredictability of corruption” hypothesis. The authors tested it using three separate variables derived from responses to the WBES. One indicated uncertainty about the price of corrupt services, one indicated uncertainty about whether other officials may subsequently request additional bribe payments, and one indicated uncertainty about whether bribes result in the actual delivery of purchased services. As reported in Table 9-11 below, we find that controlling for other factors,
23
See Rose-Ackerman (1978), Klitgaard (1988), Shleifer and Vishny, (1994), Mauro (1997). 24
In other words, in settings where corruption is predictable, the premise is that corruption would not have harmful effects compared to where the degree of unpredictability of corruption is much higher. See, for example, Campos, Lien, and Pradhan (1999).
0 5 10 15 20 25 30 35
Capture Economy non-Capture Economy
Average Sales Growth of Firms (Over 3 Years)
there is no significant relationship between the degree of unpredictability of corruption, on the one hand, and the degree of underreporting of revenues by the firm, on the other. By contrast, the magnitude and significance of the level of corruption variables (proxied by the amounts of bribes paid or by the frequency of bribery) remain very high. These results occur irrespective of which (and if any) of thethree “unpredictability of corruption” components is used in our econometric specifications.25
Table 9-11: Underreported Revenues versus Unpredictability of Corruption
Determinants 1 2 3 4 5 6
Business constraints
Financing constraint -0.04 0.42 0.30 0.11 -0.12 0.24
-0.11 1.16 0.67 0.26 -0.30 0.67
Inflation constraint -0.15 -0.12 -0.31 -0.09 0.03 -0.04
-0.52 -0.49 -0.99 -0.32 0.10 -0.18
Policy instability constraint 0.77 0.74 0.82 0.58 0.51 0.55
2.76*** 2.94*** 2.71*** 2.05** 1.90* 2.23**
Infrastructure constraint 0.89 0.68 0.80 0.39 0.42 0.22
2.07** 1.72+ 1.75* 0.91 1.04 0.59
Tax/regulatory constraint 1.30 1.25 1.40 0.73 0.76 0.80
2.44** 2.72*** 2.50** 1.39 1.51+ 1.78* Unpredictability of corruption
Bribery (% of revenues) 0.28 0.29 0.27
4.68*** 4.91*** 4.38***
Frequency of bribing 2.16 1.84 2.01
6.90*** 6.23*** 8.07***
Corrupt service unpredictability -0.01 0.44
-0.03 1.51+
Corrupt payment unpredictability 0.01 0.26
0.03 0.95
Corrupt extra request unpredictability -0.10 0.10
-0.37 0.40
Government inefficiency 1.30 1.39 1.05
3.28*** 3.59*** 3.01*** Firm characteristics
Private ownership -0.44 0.10 -0.11 0.05 -0.97 -0.44
-0.32 0.08 -0.07 0.04 -0.75 -0.36
Small firm 4.42 4.94 5.23 5.50 4.60 4.75
3.43*** 4.49*** 3.63*** 4.06*** 3.71*** 4.40***
Medium-sized firm 0.84 0.97 2.01 2.26 1.18 0.89
0.73 0.98 1.54+ 1.84* 1.06 0.92
Relatively new (since 1994) -0.23 0.19 -0.20 0.09 0.04 0.36
-0.36 0.35 -0.31 0.15 0.07 0.67
Exporter -0.89 -1.30 -1.59 -1.22 -0.53 -1.18
-0.97 -1.60+ -1.57+ -1.29 -0.61 -1.49+
25
[image:20.612.71.543.179.647.2]Foreign investment -3.64 -3.37 -3.88 -3.07 -2.81 -2.92
-3.42*** -3.69*** -3.24*** -2.75*** -2.76*** -3.26***
Location, small city -0.13 0.18 -0.17 -0.01 0.00 0.01
-0.11 0.16 -0.13 -0.01 0.00 0.01
Location, large city 1.42 2.18 1.38 1.24 1.29 1.53
1.36 2.26** 1.25 1.20 1.31 1.65+
Manufacturing 1.81 1.94 1.97 1.74 1.82 2.04
0.85 0.93 0.69 0.62 0.83 0.95
Service 0.34 0.38 0.24 0.67 1.05 1.14
0.13 0.16 0.08 0.22 0.42 0.46
Agriculture -0.64 -0.04 -0.63 0.18 0.50 0.66
-0.30 -0.02 -0.22 0.07 0.23 0.31
Construction 1.39 1.70 1.62 1.63 1.73 1.73
0.60 0.77 0.54 0.56 0.74 0.75
Adjusted R2 0.19 0.19 0.19 0.18 0.17 0.20
Number of observations 3262 3902 2926 3347 3369 4223
*** significant at 1% level; ** significant at 5% level ; * significant at 10% level + significant at 15% level
[image:21.612.72.539.72.277.2]Note:From the survey, business constraints were rated on a scale from 1 to 4, where 1 implies no constraint and 4 implies a major obstacle. These include inflation, financing, infrastructure, tax/regulation, policy instability constraints, as well as quality of courts, protection of property rights, copyright violations and constraints to exercise ‘voice’ of the firm. Bribery is expressed as percentage of revenues. Although not reported in table, fixed country effects were used to account for differences across individual countries. World averages were used for some variables in those countries that were entirely missing observations for that specific variable, in order to maximize the efficiency of estimators without affecting their lack of bias. Finally, all firm characteristics are defined as a binary choice.
o Large firms constitute the benchmark; oo Location in capital constitutes the benchmark; ooo Other sectors constitute the benchmark
Source: Kaufmann, Mastruzzi, and Zavaleta 2002.
Implications
The results of the World Business Environment Survey show that important dimensions of the climate for business operation and investment can be measured, analyzed, and compared across countries, and that important aspects of governance are centrally related to the business
environment and investment climate. The results clearly demonstrate how the experience of enterprises varies by location and by firm characteristic, and the analysis reveals how those differences relate to firm-level outcomes such as growth and the extent of unofficialdom. A careful interpretation of these differences can help shape different policy priorities for national policy. Further, the survey findings suggest that key policy, institutional, and governance indicators are connected to important outcomes, including the growth of firm’s sales (as well as the growth of investment and the extent to which firms operate in the unofficial or informal economy). The results also point to the value of monitoring such indicators over time, because progress in these indicators should yield real improvements in enterprise performance.
This survey also discourages universal generalizations. Rather, it’s value lies precisely in shedding light on the enormous variance in the nature and severity of different types of constraints across countries and regions, as well as between firms of different characteristics. This variance implies that the global generalizations regarding the severity of a particular constraint are of limited value. It also suggests the importance of “unbundling” generic clusters of constraints. Although two countries may have severe regulatory or governance constraints, for example, the components may be quite different in each country. The detail afforded by the survey also suggests that generalizations about firm size and formality may benefit from a nuanced analysis of actual conditions.
APPENDIX A. COUNTRIES SURVEYED IN
THE WORLD BUSINESS ENVIRONMENT SURVEY**
Central and Eastern (CEE)
Albania, Armenia, Bosnia and Herzegovina, Bulgaria, Croatia, Czech Republic, Hungary, Poland, Romania, Slovak Republic, Slovenia, and Turkey.
Commonwealth of Independent States (CIS)
Azerbaijan, Belarus, Estonia, Georgia, Kazakhstan, Kyrgyz Republic, Lithuania, Moldova, Russia, Ukraine, and Uzbekistan.
Developing East Asia
Cambodia, Indonesia, Philippines, and Thailand.
Newly Industrialized East Asia (NIC) and China China, Malaysia, and Singapore
Latin America and the Caribbean (LAC)
Argentina, Belize, Bolivia, Brazil, Chile, Colombia, Costa Rica, Dominican Republic, Ecuador, El Salvador, Guatemala, Haiti, Honduras, Mexico, Nicaragua, Panama, Peru, Trinidad and Tobago, Uruguay, and Republica Bolivariana de Venezuela.
Middle East and North Africa
Egypt, Tunisia, West Bank and Gaza (region)
Organization of Economic Cooperation and Development (OECD)**
Canada, France, Germany, Italy, Portugal, Spain, Sweden, United Kingdom, and United States.
South Asia
Bangladesh, India, and Pakistan.
Sub-Saharan Africa
Botswana, Cameroon, Côte d’Ivoire, Ethiopia, Ghana, Kenya, Madagascar, Malawi, Namibia, Nigeria, Senegal, South Africa, Tanzania, Uganda, Zambia, and Zimbabwe.
Regions Classified as Developing = Developing East Asia, Latin America and the Caribbean, Middle East and North Africa, South Asia, and Sub-Saharan Africa.
Transition Economies = CEE plus CIS
Batra, Geeta and Hong Tan. Forthcoming.“Inter-Firm Linkages and Total Factor Productivity Growth in Malaysian Manufacturing.” World Bank , Washington, D.C.)
Batra, Geeta, Daniel Kaufmann, and Andrew H.W. Stone. 2003. Investment Climate Around the World: Voices of the Firms from the World Business Environment Survey (WBES). Washington, D.C.: World Bank.
Campos, J.E., D. Lien, and S. Pradhan. 1999. “The Impact of Corruption on Investment: Predictability Matter.” World Development 27 (6): 1059-67.
Friedman, E, Simon Johnson, Daniel Kaufmann, and Pablo Zoido-Lobatón. 2000. “Dodging the Grabbing Hand: The Determinants of Unofficial Activity in 69 Countries.” Journal of Public Economics (June).
Hellman, Joel S. and Daniel Kaufmann. “Confronting the Challenge of State Capture in Transition Economies.”Finance and Development 38 (3)
http://www.imf.org/external/pubs/ft/fandd/2001/09/hellman.htm
IFC (International Finance Corporation). 2000. “ Paths Out of Poverty.” Washington, D.C.
Johnson, Simon, Daniel Kaufmann and Andrei Shleifer. 1997. “The Unofficial Economy in Transition.” Brookings Papers On Economic Activity 2:159-239.
Johnson, Simon, Daniel Kaufmann and Pablo Zoido-Lobatón. 1999. “Corruption, Public Finances and the Unofficial Economy.” Policy Research Working Paper 2169. World Bank Institute,Washington, D.C. Kaufmann, Daniel, Massimo Mastruzzi and Diego Zavaleta. 2002. “Sustained Macroeconomic
Reforms with Meager Growth: A Governance Puzzle in Bolivia.”, In Dani Rodrik, ed., Comparative Perspectives on Growth of Nations, Cambridge, Mass.: National Bureau of Economic Research and Harvard University (forthcoming).
Klitgaard, Robert. 1988 Controlling Corruption. Berkeley: University of California Press.
Levy, Brian. 1993. “Obstacles to the Development of Indigenous Small and Medium
Enterprises in Sri Lanka and Tanzania: An Empirical Assessment.” World Bank Economic Review 7, (1): 65-83.
Mauro, Paulo. 1997. “Why Worry About Corruption?” Economic Issues No. 6. Interntional Monetary Fund, Washington, D.C. http://www.imf.org/external/pubs/ft/issues6/issue6.pdf
Roberts, Mark and James Tybout, (eds). 1996. Industrial Evolution in Developing Countries: Micro Patterns of Turnover, Productivity and Market Structure. New York: Oxford University Press. Rose-Ackerman, Susan. 1978. Corruption : a A Study in Political Economy. New York: Academic
Press.
Schiffer, Mirjam, and Beatrice Weder. 2001. “Firm Size and the Business Environment: Worldwide Survey Results.” IFC Discussion Paper No. 43. Washington, D.C.
Shleifer, Andrei, and Robert W. Vishny. 1994. “Politicians and Firms” Quarterly Journal of Economics 109 (November): 995-1025.
Stone, Andrew H. W. 1992. “Listening to Firms: How to Use Firm-Level Surveys to Assess
Constraints on Private Sector Development.” Policy Research Working Paper 923. World Bank, Policy Research Department, Washington, D.C.
NOTE:
*This article is adapted from a larger volume, Voices of the Firm 2000: Investment Climate and Governance Findings of the World Business Environment Survey (WBES) by Geeta Batra, Daniel Kaufmann and Andrew H. W. Stone (World Bank Group, 2002). The WBES Steering