Financial Performance Value-Added Dairy Operations in New
York, Vermont and Wisconsin
Charles Nicholson and Mark Stephenson
Department of Applied Economics and Management
Cornell University, Ithaca, New York 14853-7801
Selected Paper prepared for presentation at the American Agricultural Economics Association Annual Meeting, Portland, OR July 29-August 1, 2007
Abstract: Federal, state and local governments have funded various efforts to support value-added agriculture, often implicitly assuming that the enterprises would be profitable and that the transition from commodity producer to producer-processor-marketer-distributor would be relatively easy. Some analysts (e.g., Streeter and Bills; 2003a, 2003b) have questioned both of these assumptions, noting that available aggregate data do not allow assessment of the financial performance of value-added enterprises. Our study collected detailed financial information from 27 value-added dairy enterprises with cows, goats or sheep in three states. These businesses processed and marketed cheese, fluid milk products and yogurt; 17 had begun processing during the previous three years. The financial information was used to develop income statements and balance sheets for both the milk production and the dairy processing and marketing enterprises. Our results suggest that value-added dairy is not a panacea: despite much higher revenues per unit milk produced or processed, mean net income for the processing enterprise and for the combined milk production and processing business were modest at best and often negative. More than half of the on-farm processors had negative net incomes from processing, and seven
processing enterprises had negative net worth. On average, returns per cwt milk processed were $90 per cwt and $209 per cwt (for cow and goat/sheep milk producers, respectively) lower than the full economic costs of production and processing.
Charles Nicholson is a Senior Research Associate and Mark Stephenson is a Senior Extension Agent with the Cornell Program on Dairy Markets and Policy. The authors gratefully
acknowledge the assistance of Anita Deming of Cornell Cooperative Extension in Essex County, Jason Karzses of the Cornell Pro-Dairy program, Carl Rainey of the Wisconsin Department of Agriculture, Trade and Consumer Protection, and Robert Parsons from the University of
Vermont in collection, correction and interpretation of the enterprise-level data collected for this study. The authors also acknowledge partial financial support from the Risk Management Agency of USDA.
Keywords: small-scale dairy processing; value added; financial performance; profitability © Copyright 2007 by Charles Nicholson and Mark Stephenson. All rights reserved. Readers may make verbatim copies of this document for non-commercial purposes by any means, provided that this copyright notice appears on all such copies
Financial Performance Value-Added Dairy Operations in New York,
Vermont and Wisconsin
Charles Nicholson and Mark Stephenson Introduction
In the last decade or two there has been a resurgence of interest in “value-added” agriculture, driven by consumer characteristics and the desire of farmers to capture a larger share of the consumer dollar. As interest in on-farm processing (and ‘value-added’ activities more generally) has grown,
governments at the national and regional levels have determined that there are benefits to supporting various types of ‘value-added’ agricultural activities. The main motivations of governments are enhancing or stabilizing farm-household incomes, creating rural employment and economic development, and maintaining land in agricultural (or open) use (Streeter and Bills, 2003a). To achieve these objectives, the US Federal and many state governments have funded “numerous programs dedicated to enhancing farm income with techniques referred to as value added” (Streeter and Bills, 2003a). Government assistance and financing specifically for the development of on-farm dairy processing efforts are also common, especially at the state level. In the major milk-producing states, on-farm processing of milk often is viewed as the principal mechanism for adding value to milk.
As governments have become more involved in supporting value-added agricultural activities, a few observers have attempted to both clarify the underlying meaning of ‘value-added’ and the objectives of such programs. Some analysts have questioned whether existing knowledge supports the
assumptions that appear to underlie them (Hammarlund, 2003; Streeter and Bills, 2003b). The rhetoric surrounding these programs often seems to imply that value-added enterprises will be profitable (and will therefore increase farm-household incomes) and that the transition from being a primary commodity producer to a processor, marketer, or distributor is relatively easy.
Streeter and Bills (2003b) take issue with both of these assumptions. First, they note that existing data do not allow an accurate assessment of the growth in value-added activities or their contribution to farm-household incomes, rural employment, or economic development. Second, they argue that the transition from “commodity producer” to “value-added entrepreneur” typically will require a higher degree of overall managerial skill, key specific management talents, additional assets and additional employees. They emphasize that various types of value-added activities will require different amounts of these resources, and that a careful matching of resources with the type of value-added activity is necessary. The most important element of their critique of existing efforts,
however, relates to enterprise-level profitability. They stress that
The term value-added strategy implies a return to farmers that exceeds what they can hope for in the marketplace for standardized or bulk commodities…the term may lead to the false hope that higher prices automatically equate to higher profits…
What appears to be entirely lacking in the existing knowledge base is information on the financial performance of currently operating on-farm dairy processing enterprises (and value-added
agricultural enterprises more generally). This information is important for three principal reasons. First, it is necessary to provide empirical evidence about whether a key assumption underlying government support for on-farm processing is correct. Second, this information is likely to be useful in helping current on-farm processing enterprises to be more successful (through more appropriate educational programs and benchmarking against other on-farm processing businesses, for example). Finally, this knowledge can better illustrate the challenges and strategies of on-farm processing to those who are interested in on-farm processing but have not yet made a decision to invest in it. Streeter and Bills (2003a) highlight this need for information in the more general context of all value-added agriculture using the following strong language:
…existing published data sources do not use the appropriate unit of study for a detailed empirical examination of value-added and its role in farm family incomes. This means that policy makers are moving forward in the value added arena with little or no rigorous exposure to empirical evidence and with scant effort to help farmers make informed decisions in the marketplace. [emphasis added]
They conclude that “household level data is [are] crucial to a meaningful research effort” on value-added agriculture. To a certain extent, it is understandable that such information is not readily available, as it relates to the financial performance of private firms (for whom such information is proprietary). However, previous efforts to collect financial performance data and provide benchmarking information to both dairy farms (Knoblauch et al., 2006) and dairy processors (e.g., Stephenson, 2006) have shown that these efforts are both feasible and useful.
Given the foregoing, the objective of this study is to examine the financial performance of the farm and processing enterprises of a sample of businesses engaged in dairy processing in New York, Vermont and Wisconsin. Financial performance in this case means development of
income statements from both the farm (milk-production) enterprise and the processing (including marketing and distribution) enterprise, but also the full economic costs of processing dairy products on-farm. In addition, we also describe an initial statistical analysis of factors associated with net income from processing. A key conclusion of this research is that additional efforts of this type are both necessary and practicable.
Methods
The principal methods employed in this analysis are survey data collection and statistical analysis. The former involves the identification and selection of survey participant, collection and review of their financial information, and generation of reports describing individual
business performance and benchmarking compared to other businesses processing the same product. The statistical analyses are primarily tabular summaries of key variables, but simple regression analysis provides some additional insights about the business characteristics associated with net business income from the farm and processing enterprises.
For New York, the sampling frame consisted of 31 small-scale processors identified by the New York State Department of Agriculture and Markets, which regulates dairy processing facilities. These 31 businesses represented the entire population of on-farm processing facilities in New York at that time, and included businesses processing milk from cows, goats and sheep. For Vermont and Wisconsin, a complete listing of on-farm processors was not available, so the sampling frame was developed based on various sources, such as these states’ equivalent of the Department of Agriculture, from going research and assistance projects that identified on-farm processors as a part of their previous experience, from agricultural lenders, and from various on-line information sources about companies operating on-farm dairy processing businesses. The sampling strategy was essentially the same in each case: identify all possible small-scale dairy processing businesses and request their participation.
A total of 27 businesses in the three states agreed to participate (7 in New York, 12 in Vermont and 8 in Wisconsin). Although the overall sample size is small, the seven New York respondents represent just under one-quarter of the 31 identified small-scale dairy processors. The extent to which the sample is biased through self-selection is difficult to determine given limited
information on the non-participating on-farm processors. Thus, we exercise caution in the extrapolation of the results of this research to the larger population of on-farm dairy processors in these three states.
Data collection was undertaken by different enumerators in the three states. Each of these individuals had significant experience in the collection of farm financial data. Once the data were determined to be reasonably complete and accurate, they were entered into a stand-alone data entry and analysis application developed specifically for this project. The records entered into this program were automatically emailed to the principal investigators, and were then reviewed for completeness, internal consistency and extreme values using the approach described in Randolph (1991). Questions about missing or internally inconsistent data were referred back to the enumerators and the business owners, then entered or modified as appropriate. When data from an individual business was finalized, an individual business performance report was generated and mailed to the participant. When all data collection and clarification efforts were completed, a benchmark report was generated for each business, comparing selected financial measures to the other businesses processing the same products.
Data were collected to allow enterprise accounting on an accrual basis1. The principal types of information included are farm receipts and expenses, processing enterprise receipts and
expenses, farm and processing assets and liabilities, labor provided by the owner operator, family members and hired labor for the farm, processing or marketing. The participants also provided information on the percentage of their product sold through various outlets and the price they received in each outlet. In order to assess motivations and educational needs, participants were also asked to indicate their primary reason for undertaking dairy processing, principal sources of information used to start the processing business, key challenges facing the business in the next year, and the extent to which the participants cooperate with other value-added processors.
1
The methods are similar to those employed in the collection of data for the Dairy Farm Business Summary project (e.g., Knoblauch et al., 2006), but data collection includes processing and is less detailed for the farm enterprise. Some of the participants used cash accounting procedures, but for these businesses it appeared that there would have
Additional details on the type of information collected and definitions of the data categories can be found in Nicholson and Stephenson (2006).
A key objective of this analysis was to determine the financial performance of the farm and the processing enterprises for on-farm processors. This separation provides additional information about the factors underlying overall business performance. Streeter and Bills (2003b) and Morrison (2001) note that it is more challenging to manage a multiple-enterprise business than a single-enterprise one. Enterprise accounting allows us to address questions such as “Would financial performance be enhanced for on-farm processors by focusing on one or the other of the enterprises?,” for example, buying milk for processing rather than producing it on-farm. Another advantage of the enterprise accounting approach is that it facilitates the identification of labor usage in milk production, dairy processing and marketing. Previous authors have noted that the labor requirements for on-farm dairy processors can be large (e.g., Morrison, 2001).
Although in most cases the separation of farm and processing enterprise accounts is
straightforward, the one exception is the value of the milk used in processing. This “transfer value” is used to calculate revenue for the farm enterprise and expenses for the processing enterprise. When the farm sold raw milk in addition to processing, the transfer value was the milk price received. If the farm did not sell raw milk, they were asked to provide a value at which they believed the milk could be sold, and this value was used calculate the transfer value. Because the transfer value is calculated so that the revenues to the farm and the expense to the processing enterprise are equal, the transfer value affects individual enterprise performance but not overall business performance.
The key analyses include a net income statement for the farm enterprise, the processing
the full economic costs and returns per hundredweight of milk processed. The calculations and assumptions used to develop the net income statement are similar to those used by the Dairy Farm Business Summary Project (DFBS; Knoblauch et al., 2006). Net income is calculated as receipts less expenses, expansion livestock (for the farm enterprise) and depreciation. Labor and management income is calculated as net income less unpaid family labor (valued at $2,200 per month) and real interest of equity assuming a 5% rate of return on equity. The net income statement per hundredweight uses the amount of milk produced for the farm enterprise and the amount of milk processed for the processing enterprise. The buildup of economic costs and returns includes expense items from the net income statement per hundredweight, but adds the value of operator’s labor and management (provided by the participants), unpaid family labor and interest on equity. This total cost per hundredweight of milk processed is compared to the average per revenue received from product sales to calculate a net return per hundredweight over total economic costs.
To assess the associations between multiple factors and the financial performance of the processing enterprise, a simplified OLS regression analysis was performed. Due to the small size of the sample this analysis includes a limited number of variables, including the amount of milk processed, the number of years the processing enterprise has been operating, the total value of assets employed in processing, full-time equivalents (FTEs) of hired labor used in processing, whether the principal product was cheese or not and whether the majority of the product was sold through a retailer or farm stand. Analyses of the determinants of firm-level financial
performance are often conducted using panel data (e.g., Goddard et al., 2004; Vlachvei, 2002). Observations are available for only a single year in this case, so the analysis does not employ more sophisticated econometric modeling techniques. The results of this statistical analysis
should be viewed as providing initial insights about the determinants of processing enterprise profitability rather than as definitive.
Results
A majority of the participants produced and processed cow’s milk; one business processed both goat and cows milk. The most common main product produced and sold was cheese, followed by fluid milk products and yogurt. Three on-farm processors sold ice cream, butter or cream in addition to a main product. There is a great deal of variation in the number of years the
businesses surveyed have been operating a farm (Table 1), and both the mean and the maximum values are higher for businesses producing and processing cow’s milk. Milk production
averaged nearly 600,000 lbs per year, and milk per cow was relatively low at about 11,500 lbs per year. For cow’s milk processors, slightly more than half of the milk produced was sold rather than processed; 10 of 16 cow’s milk farms sold some raw milk (Table 1). This implies that on-farm cow’s milk processors retain traditional market outlets for a substantial proportion of their raw milk production, and may imply that this is a necessary component of a successful transition strategy to on-farm processing for larger cow’s milk producers. The proportion of sheep or goat’s milk sold rather than processed was much smaller, only about 15% of total production, and only 3 sheep farms sold milk. In addition, four farms purchased milk to be used in processing as a supplement to the milk they produced. There was a wide variation in the total number of animals owned (from 6 to 660); goat and sheep processors had larger average animal numbers (Table 1). The average cow’s milk processor had 43 cows; the average goat and sheep milk processor had 87 mature animals.
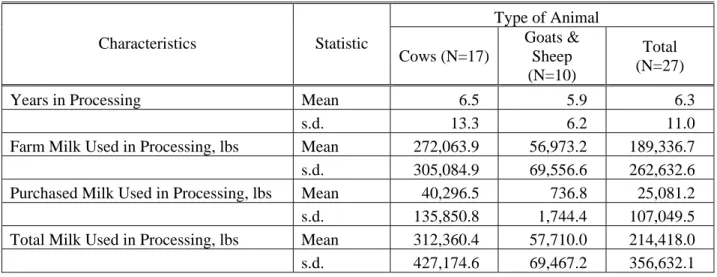
Both cow’s milk processors and sheep and goat’s milk processors had been processing on average for about 6 years (Table 2). Seventeen of the processors had been processing for three
years or less, and only 6 of the processors had been doing so for more than 10 years. Thus, this sample represents relatively new processing businesses that are probably still learning about how to develop a financially successful processing enterprise. Farm milk used in processing averaged about 750 lbs per day for cow’s milk and about 150 lbs per day for goats and sheep. Thus, these are quite small operations in comparison to most commercial dairy processors. The amounts of dairy products produced are small relative to those assumed in many previous analyses of value-added dairy processing (e.g., Hammarlund, 2003).
Income Statement Evaluation
A key objective of this research is to evaluate financial performance of the farm enterprise, processing enterprise and the overall business, and income statements for the individual enterprises and the overall business are a main component of this evaluation. For the farm enterprise, the principal sources of revenues are raw milk sales (especially for cow’s milk) and the transfer value for the milk used in processing (Table 3). About 25% of revenues for cow’s milk producers and 17% of sheep and goat’s milk producers was received from livestock sales, crop sales, government payments or other receipts. Average revenues for the goat and sheep producers were about one-third of those for cow’s milk producers The most important expense categories were purchased feed (28% for both types of farms), hired labor expenses (22% for both types of farms), farm machinery and expenses and livestock expenses. Farm net income for the cow’s milk producers averaged about $15,000, but was negative for the goat and sheep producers. All goat and sheep producers had negative net farm income, but the range in farm net income was much broader for cow’s milk producers (Table 3).
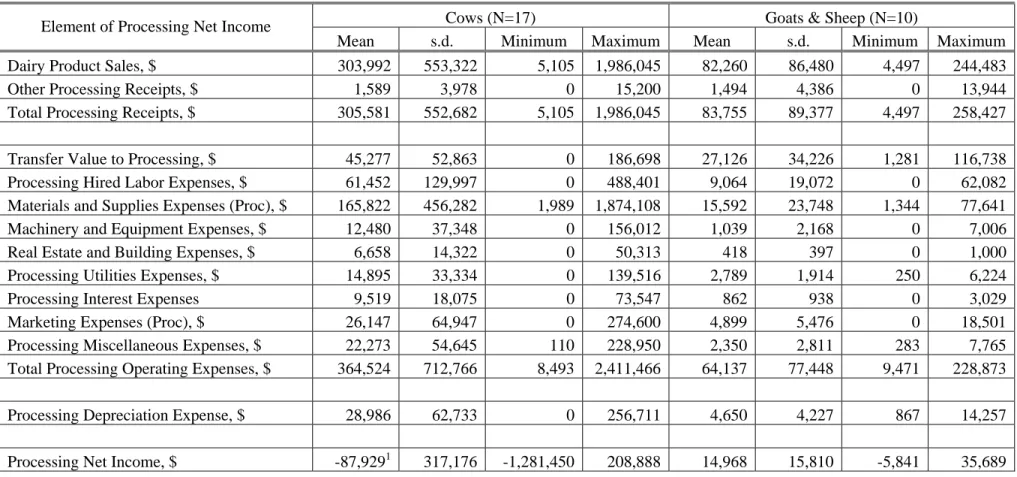
The income statement for the processing enterprise indicates that the principal source of revenue (accounting for more than 98% of revenues) is dairy product sales (Table 4). For producers of
both types, average revenues from dairy product sales were about 2.2 times revenues to the farm enterprise. The structure of expenses for the processing enterprise differed by animal species. For the cows milk producers, materials and supplies were by far the largest expense, accounting for nearly 45% of expenses. Marketing expenses accounted for 7% of total operating expenses. Hired labor and the value of milk used in processing amounted to an additional 17 and 12%, respectively, of processing expenses. For sheep and goat’s milk processors, the value of the milk was the largest expense, amounting to 42% of total processing operating expenses. Materials and supplies accounted for only about 23% of processing expenses, and marketing expenses accounted for about 8% of operating expenses. The average processing net income for the cow’milk producers was negative—nearly $90,000 less than processing receipts. One outlier with a large negative processing net income has a strong influence on the mean value; without this minimum value, the mean is about negative $13,000.
Sheep and goat’s milk processors generated a positive processing net income of about $15,000 from a revenues about one-fourth of those for the cow’s milk processors (Table 4). The
distribution of processing net income values has a mode in the range of $0 to $25,000 per year, and more than half of the values fall in the range of $0 to $50,000. Only one processing enterprise had a processing net income greater than $50,000, and 11 enterprises had negative processing net income. These results indicate that it is quite possible—but not inevitable—for on-farm dairy processing not to be profitable, and even when profitable, they may not generate large processing net incomes. The factors influencing processing net income are explored in greater detail with simple regression analysis below.
Average overall business net income is similar for the processors of the two types of milk (less than $2,000), despite differences in the amount of milk processed and the product mix. On
average, cow’s milk processing businesses had profitable milk production enterprises, but lost money on processing. Goat and sheep milk processors lost money on milk production but earned positive net income from processing activities. Although these average values are useful, the variation from one business to another (and the coefficient of variation, the standard deviation divided by the mean) is quite large. For cow’s milk processors, the range in overall net income values was more than $300,000 (negative $150,000 to $190,000). The distribution of overall business net income is centered at about zero (Figure 1). Twenty values fall within the range of negative $50,000 to$50,000, and more than half of the participating businesses (N=15) had a negative net income. Streeter and Bills (2003b) and Morrison (2001) note that it can be challenging to simultaneously (and profitably) manage production of a raw material and its transformation via processing into a value-added product. Only one of 27 participants earned a positive net income from both the farm and processing enterprises. The most common outcome was for the processing enterprise to be somewhat profitable, but not the farm. The evidence supports the idea that it can difficult at a relatively small scale to successfully manage both a farm and a processing enterprise.
What explains the patterns of net income—especially for processing—observed in these data? One approach to explore this is to undertake tabular comparisons that explore differences due to individual factors. If experiential learning contributes to more effective management of the farm and processing businesses, we might expect that businesses that have been processing longer will be more profitable. Processors with more than three years of experience had processing net income values much larger than those with three years of experience or less. Somewhat curiously, however, the farm net income of the older businesses was lower than for younger businesses. On average, the surveyed businesses with greater experience were more profitable
traditional dairy farm to an on-farm processor, or if both milk production and dairy processing were essentially new enterprises for individuals with limited previous agricultural experience. We defined each participating business as “transitional” or “new” based on the number of years they had produced milk and the number of years they had processed dairy products. Net income for the transitional businesses was lower than for the new businesses, sometimes rather
dramatically so (Table 5), despite the fact that transitional processors had more than double the number of years of processing experience, on average, of new businesses. Finally, it appears that product pricing has an important effect on processing net income. The relationship between processing receipts per cwt and processing net income suggests that the value of receipts must be about $100 per cwt of milk processed (i.e., the prices received need to be about $10 per lb of cheese or yogurt and $8.60 per gallon of milk) in order to cover the costs of processing and marketing the products, or that ways must be found to substantially reduce costs.
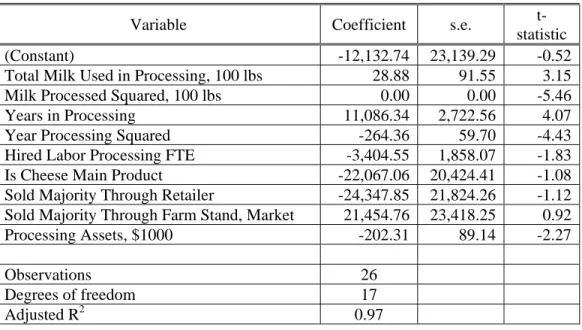
In addition to the tabular comparisons, we explored the factors underlying processing net
incomes with a simple OLS regression. The dependent variable was processing net income2 and the explanatory variables included amount of milk processed, the number of years in processing, total value of processing assets, main product, amount of hired labor, and market outlet and (Table 6). The volume of milk processed had a positive impact on processing net income, but with diminishing returns (as indicated by the negative sign on the amount of milk squared variable). A similar nonlinear effect was found for the number of years of processing, indicating that experience does influence processing profitability. However, this interpretation is
complicated by the fact that only more successful businesses (or those with significant external sources of funding) will survive the first few years of operation. The only other variables with a
2
Note that this is actual processing net income, not processing income per cwt of milk processed. Regression analysis with this dependent variable resulted in no significant explanatory variables.
large t-value were processing assets, for which the negative sign indicates that it is possible to be overcapitalized, and hired labor FTE, which also had a negative sign. The main product sold by the business and the outlet through which the product was sold did not appear to have strong effects on processing profitability, controlling for the other variables.
Income Statement per Hundredweight Evaluation
In the New York Dairy Farm Business Summary (Knoblauch et al., 2004), elements of the income statement per cwt are employed to provide an additional perspective on farm financial performance. Businesses processing cow’s milk had larger total farm receipts per cwt of milk produced than the average of 201 New York dairy farms participating in the DFBS (Table 7). The total value of milk receipts is equal to the value of raw milk sales plus the transfer value of milk used in processing. Milk receipts per cwt were 35% higher for on-farm processors than for dairy farms, as were all other elements of total farm receipts per hundredweight. This results in a difference of $10.76 per cwt in total farm receipts. However, all of the operating expenses are larger for the cow’s milk processors, so that although the milk receipts were much larger, average net farm income per cwt was positive for the DFBS farms in 2003, but negative for the on-farm processors (Table 7). Milk receipts for the goat and sheep milk processors were higher still (nearly $48 per cwt) and total receipts per cwt of milk produced were over $60. However, given the relatively small amounts of milk produced by goats and sheep, operating expenses per cwt were significantly larger than for cow’s milk production—especially for purchased feed, nearly $26 per cwt. These high operating costs of production for goat and sheep milk lead to average farm net incomes that are highly negative (Table 7).
Although there are no additional sources of processing data comparable to those from the DFBS for dairy farms, it is still useful to examine the returns and operating expenses per cwt (of milk
processed) for the processing enterprise. For cow’s milk processors, the value of processing receipts per cwt is nearly $65 (roughly equivalent to a $6.50 per lb cheese price). However, operating expenses per cwt of milk processed total more than $66, and net processing income is therefore negative (Table 8). In contrast to larger conventional processors, for whom the value of the milk input is often more than two-thirds of total operating expenses, the value of milk used by on-farm dairy cow’s milk processors only accounts for about 15% of operating expenses. Materials and supplies and hired labor total more than $27 per cwt of milk processed, or 41% of total operating expenses. Operating expenses excluding the value of the milk input are more than $50 per cwt, the equivalent of a $5.00 per lb cost of processing for cheese3. In contrast to cow’s milk processors, sheep and goat’s milk processors receive nearly double the receipts per unit milk processed (Table 8). Although their milk transfer value is much higher than that for cow’s milk and many operating expense items are also higher, average total processing operating expenses are only slightly over $100, so average processing net income per cwt is positive (Table 8).
Buildup of Economic Costs and Returns
It is also quite common in analyses of farm business financial performance to calculate the full economic cost of milk production. In this analysis we extend this concept to the dairy processing enterprise as well, and calculate the full economic cost of dairy products processed on farm. The full economic cost includes the value of the operator’s and unpaid family labor4, and an equity charge to reflect the opportunity cost of assets used in the farm and processing enterprises. Because these additions are often large, the full economic cost is often much larger than the
3
Additional information on processing costs is presented in Nicholson and Stephenson (2006). 4
The operator’s value of labor is based on information provided by the operator about what they would need to be paid by some other business to perform the services they do for their own business. If this value is large, this will imply a large contribution of this category to the full economic cost, which appears to have occurred in this case.
operating costs. The average full economic cost for milk production for the cow’s milk processors is more than $50 per cwt of milk produced (Table 9)—in large measure because of operator and unpaid family labor contributions of more than $24 per cwt. The farm interest equity contributes about an additional $8.50 per cwt. The full economic cost of processing products from cow’s milk is more than $100 per cwt of milk processed (Table 9), with operator labor again contributing nearly 40%. The equity charge for processing is lower in this case, about $2.50 per cwt. Overall the total economic cost of producing and processing cow’s milk products is more than $150 per cwt (roughly equivalent to $15 per pound of cheese or yogurt or $12.90 per gallon of fluid milk). Average returns on product sales are about $65, so the net return over full economic product costs is a large negative number—a negative value roughly 50% of the average return (Table 9).
The full economic costs of milk production for goat and sheep milk production are nearly $180 per cwt of milk produced (Table 9). Nearly $80 per cwt of this amount is due to operator and unpaid family labor, but the farm interest charge is also larger than $20 per cwt. The average full economic cost of making goat and sheep milk products is also higher than for cow’s milk— nearly $175 per cwt milk processed. Nearly $100 of this amount arises from operator and unpaid family labor. The full economic costs of goat and sheep milk products averaged over $350 per cwt of milk processed (or roughly $21 per lb of cheese).
The full economic costs of on-farm processing can also be examined by product. Fluid milk processors had the lowest average full economic costs of milk production ($45 per cwt milk produced compared to more than $100 for cheese and yogurt processors). The three yogurt processors had by far the highest average full economic cost of processing and the highest
average full economic cost accounting for milk production and product processing. For all products, the net return over full economic costs was decidedly negative.
Conclusions and Implications
The data from this study are quite detailed and were collected and checked with care, but the sample size is small. As a result, caution must be exercised in drawing broad conclusions from this work. This research should be thought of as an initial foray designed to highlight certain issues and pave the way for necessary more comprehensive research projects on value-added dairy processing and value-added agriculture more generally. The key messages from this research include:
• Value-added dairy processing is not a panacea for struggling dairy farms or those interested in making a living from agricultural production and marketing. It appears quite possible to lose money by processing farm milk into dairy products. Many processing enterprises and overall businesses in our study were not profitable, but this may be due in part to the fact that many of them were relatively new to the processing business. A corollary to this observation is that existing ex ante feasibility studies often have underestimated the costs of milk
production and processing, leading to overly optimistic predictions of financial performance.
• There are a variety of reasons that milk producers might give for wanting to consider value-added dairy processing. However, inadequate income from the dairy farm probably should not be one of them. On-farm processing adds layers of complexity to the business and demands time and management skills that may not be in abundance. This is consistent with the caveats discussed in Streeter and Bills (2003a, 2003b). For current dairy producers considering a transition to value-added activities, it appears that a financially successful farm business is a prerequisite.
• Operating a business in which both the milk production and the milk processing businesses are profitable appears to be a challenge. Only one of the 27 surveyed businesses made money in both the farm and processing businesses. This may suggest that specialization in one or the other of the enterprises (e.g., focusing on processing with purchased milk) is an appropriate production strategy if both enterprises are not essential to the marketing of the product.
• Previous experience and skills, not surprisingly, appear to influence financial performance. On average, individuals entering into processing from a dairy farm background tended to have relatively low costs of milk production but high processing and marketing costs. Those entering into milk production and processing at the same time from a non-farm background tended to have relatively low processing and marketing costs but high milk production costs.
• There seems to be a learning effect for value-added processors. Those with more years experience in the business demonstrated more profitable businesses. However, there also is likely to be a selection process generating observations about business performance as those who are unsuccessful in the first few years have ceased operation and thus are not available to be survey participants later on. This phenomenon should be addressed in future research on value-added dairy processing.
• Potential value-added dairy processors should carefully consider capital purchases. OLS regression analysis suggests that many of the processors in this study had invested more in plant and equipment than could be supported by product sales. This may also be related to previous experience. Most dairy farmers would have a good idea of the capital expenditure necessary to expand the herd. However, relatively few are likely to have a good
• Product pricing seems to be an issue for many on-farm processors. Our results suggest that on average, regardless of the product produced (bottled milk, yogurt, ice cream or cheese), value-added processors need to receive about $100 per hundredweight of milk used to cover milk production and processing costs. Using approximate milk-to-product conversions, this is about $10 per pound of cheese or $8.60 per gallon of fluid milk.
• Selling finished product for $100 per hundredweight of milk used is well above retail prices for most commercial products. This implies that value-added processors should not consider producing and competing against low-cost commodity products. For example, it will be difficult to make another outstanding cheddar cheese and compete in an already crowded market for that product. As noted in Gloy and Stephenson (2006), there is a segment of consumers who are looking for a closer connection to their food. Selling the “farm story” with the product is an important part of marketing value-added dairy. There is also a segment consumers who are looking for new and unusual taste experiences. Grass fed milk and(or) well-made, unusual products have a better chance of commanding the higher price in a market niche.
• There are profitable value-added business models to pursue, but care must be taken to construct and execute a well-prepared business plan. There are legitimate motivations for value-added processing today. It could be a lifestyle choice but also a desire to capture some additional portion of the consumer dollar. There was a good reason that producer-processors specialized into either milk production or product processing more than 100 years ago—it made economic sense to focus management time and talent on a more streamlined business model and to explore the returns to scale that both segments of the industry continue to find.
• There is a need to better understand the factors that contribute to the financial success (or failure) and performance dynamics of value-added dairy processing businesses. Research to address this issue would require a larger sample of panel data over a number of years. The information provided by this research could be invaluable for the development of better ex ante estimates of likely profitability of value-added dairy processing and for the design of educational programs that seek to improve the financial performance of current value-added dairy processors.
• Projects that fund value-added activities could perform a major service by requiring those businesses to participate in formal assessments of their financial performance, and making summaries of those results publicly available for research and extension programs.
References
Gloy, Angela and Mark Stephenson. 2006. A Value-Added Opportunity: Market Potential for Specialty Cheeses in Select New York Markets. Department of Applied Economics and Management, Cornell University. [EB 2006-01]
Goddard, James, Phil Molyneux, and John O. S. Wilson. 2004. The Profitability of European Banks: A Cross-Sectional and Dynamic Panel Analysis. Manchester School, 72(3):363-381. Hammarlund, Ray. 2003. Value-Added Dairy Processing Feasibility Report: A Catalyst for
Thought. Kansas Department of Commerce, Agricultural Marketing Division, July. Knoblauch, Wayne; Linda Putnam, Mariane Kiraly and Jason Karzses. 2006. Dairy Farm
Business Summary, New York Small Herd Farms, 80 Cows or Fewer, 2005. Department of Applied Economics and Management, Cornell University. [Extension Bulletin 2006-09] Knoblauch, Wayne; Linda Putnam, and Jason Karzses. 2004. Dairy Farm Business Summary
New York State. Department of Applied Economics and Management, Cornell University. [Research Bulletin 2004-13]
Morrison, E. M. 2001. Bittersweet End. AURI Ag Innovation News, p.7, April 2001, Waseca, MN: Agricultural Utilization Research Institute.
Nicholson, Charles and Mark Stephenson. 2006. Financial Performance and Other Characteristics of On-Farm Dairy Processing Enterprises in New York, Vermont and Wisconsin. Department of Applied Economics and Management, Cornell University. [Research Bulletin 2006-07]
Randolph, Tom. 1991. Rural Household Data Collection in Developing Countries: Preparing the Data for Analysis. Department of Agricultural Economics and the Cornell Food and Nutrition Policy Program, Cornell University. [Working Papers in Agricultural Economics, 91-19]
Stephenson, Mark. 2006. Cost of Processing in Cheese, Whey, Butter and Nonfat Dry Milk Plants. Cornell Program on Dairy Markets and Policy, Department of Applied Economics and Management, Cornell University, September.
Streeter, Deborah H. and Nelson L. Bills. 2003a. Value-Added Ag-Based Economic
Development: A Panacea or False Promise? Part One of a Two-Part Companion Series: What is Value-Added and How Should We Study It? Department of Applied Economics and Management, Cornell University. [Working Paper 2003-07]
Streeter, Deborah H. and Nelson L. Bills. 2003b. Value-Added Ag-Based Economic Development: A Panacea or False Promise? Part One of a Two-Part Companion Series: What Should We Expect of Value-Added Activities? Department of Applied Economics and Management, Cornell University. [Working Paper 2003-08]
Vlachvei, Aspassia. 2002. Performance of the Greek Aquaculture Industry. Mediterranean Journal of Economics, Agriculture and Environment. 1(2):46-49.
Table 1. Selected Farm Characteristics of On-Farm Dairy Processors, by Animal Species Type of Animal Characteristics Statistic Cows (N=17) Goats & Sheep (N=10) Total (N=27)
Years in Farming Mean 16.9 9.5 14.1
s.d. 17.7 7.1 15.0
Milk Production, lbs Mean 563,037.1 66,743.2 372,154.8
s.d. 527,345.1 95,130.8 480,357.4
Milk Production Per Animal, lbs Mean 11,554.6 891.8 7,453.5
s.d. 4,466.0 602.4 6,331.2
Milk Sold, lbs Mean 290,348.2 9,770.0 182,433.5
s.d. 406,887.9 26,965.7 344,927.0
Total Tillable Acres, Owned and Rented Mean 166.0 45.9 119.8
s.d. 208.0 46.5 174.1
Total Acres Pasture Mean 43.0 31.4 38.5
s.d. 29.7 32.3 30.6
Number of Mature Animals Mean 42.9 87.1 59.9
s.d. 33.0 93.6 65.5
Table 2. Selected Processing Enterprise Characteristics of On-Farm Dairy Processors, by Animal Species Type of Animal Characteristics Statistic Cows (N=17) Goats & Sheep (N=10) Total (N=27)
Years in Processing Mean 6.5 5.9 6.3
s.d. 13.3 6.2 11.0
Farm Milk Used in Processing, lbs Mean 272,063.9 56,973.2 189,336.7
s.d. 305,084.9 69,556.6 262,632.6
Purchased Milk Used in Processing, lbs Mean 40,296.5 736.8 25,081.2
s.d. 135,850.8 1,744.4 107,049.5
Total Milk Used in Processing, lbs Mean 312,360.4 57,710.0 214,418.0
Table 3. Farm Enterprise Net Income of On-Farm Dairy Processors, by Animal Type
Cows (N=16) Goats & Sheep (N=10)
Element of Farm Net Income
Mean s.d. Minimum Maximum Mean s.d. Minimum Maximum
Raw milk sales, $ 50,819 73,316 0 226,100 4,732 12,801 0 40,811
Transfer Value to Processing, $ 48,107 53,250 2,098 186,698 27,126 34,226 1,281 116,738
Livestock Sales, $ 10,708 10,138 457 29,803 3,468 4,787 0 16,257
Crop Sales, $ 11,814 37,200 0 149,250 591 1,841 0 5,831
Government and Other Receipts (Farm), $ 12,759 12,065 0 36,404 2,371 2,899 0 8,534
Total Farm Receipts, $ 134,207 130,314 8,818 454,493 38,288 52,064 10,502 176,675
Farm Hired Labor Expenses, $ 22,424 35,401 0 122,512 8,583 14,338 0 40,012
Purchased Feed Expenses (Farm), $ 29,903 23,292 1,926 71,995 11,243 8,310 2,854 33,467
Farm Machinery & Equipment Expenses, $ 16,596 17,266 1,225 63,416 2,963 4,013 0 13,871
Livestock Expenses, $ 12,976 9,167 1,604 29,547 6,305 11,436 916 38,471
Crop Expenses, $ 5,623 11,135 0 45,081 998 2,121 0 6,964
Farm Real Estate and Building Expenses, $ 5,954 7,284 0 29,558 2,477 1,089 870 4,862
Farm Utilities Expenses, $ 4,392 4,047 122 13,356 1,596 1,832 214 5,973
Farm Interest Expenses, $ 2,586 3,198 0 12,298 2,625 3,248 0 9,208
Farm Miscellaneous Expenses, $ 5,471 5,210 333 20,776 2,173 2,661 0 8,978
Total Farm Operating Expenses, $ 105,924 86,915 14,157 289,448 38,963 45,777 12,988 161,806
Expansion Livestock Expenses (Farm), $ 935 1,710 0 4,800 154 487 0 1,540
Farm Depreciation Expense, $ 12,597 17,140 0 51,850 12,280 16,184 464 57,029
Table 4. Processing Enterprise Net Income of On-Farm Processors, by Animal Type
Cows (N=17) Goats & Sheep (N=10)
Element of Processing Net Income
Mean s.d. Minimum Maximum Mean s.d. Minimum Maximum
Dairy Product Sales, $ 303,992 553,322 5,105 1,986,045 82,260 86,480 4,497 244,483
Other Processing Receipts, $ 1,589 3,978 0 15,200 1,494 4,386 0 13,944
Total Processing Receipts, $ 305,581 552,682 5,105 1,986,045 83,755 89,377 4,497 258,427
Transfer Value to Processing, $ 45,277 52,863 0 186,698 27,126 34,226 1,281 116,738
Processing Hired Labor Expenses, $ 61,452 129,997 0 488,401 9,064 19,072 0 62,082
Materials and Supplies Expenses (Proc), $ 165,822 456,282 1,989 1,874,108 15,592 23,748 1,344 77,641
Machinery and Equipment Expenses, $ 12,480 37,348 0 156,012 1,039 2,168 0 7,006
Real Estate and Building Expenses, $ 6,658 14,322 0 50,313 418 397 0 1,000
Processing Utilities Expenses, $ 14,895 33,334 0 139,516 2,789 1,914 250 6,224
Processing Interest Expenses 9,519 18,075 0 73,547 862 938 0 3,029
Marketing Expenses (Proc), $ 26,147 64,947 0 274,600 4,899 5,476 0 18,501
Processing Miscellaneous Expenses, $ 22,273 54,645 110 228,950 2,350 2,811 283 7,765
Total Processing Operating Expenses, $ 364,524 712,766 8,493 2,411,466 64,137 77,448 9,471 228,873
Processing Depreciation Expense, $ 28,986 62,733 0 256,711 4,650 4,227 867 14,257
Processing Net Income, $ -87,9291 317,176 -1,281,450 208,888 14,968 15,810 -5,841 35,689
Table 5. Farm, Processing and Overall Business Net Income for On-farm Dairy Processors, by New or Transitional Business
Transitional Business1 (N=14)
New Business (N=13) Element of Business Net Income
Mean s.d. Mean s.d.
Total Farm Receipts, $ 138,644 98,795 55,986 120,487
Total Farm Operating Expenses, $ 123,971 85,945 36,368 42,077
Farm Net Income, $ -713 71,252 8,785 68,668
Total Processing Receipts, $ 373,638 594,627 61,652 36,922
Total Processing Operating Expenses, $ 446,272 767,284 45,421 34,319
Processing Net Income, $ -107,579 348,113 12,385 22,620
Total Business Receipts, $ 434,352 581,706 117,638 134,551
Total Business Operating Expenses, $ 419,074 590,725 81,789 73,210
Total Net Income, $ -17,994 66,102 21,169 53,421
Note: Transitional business means a traditional dairy farm that made the transition to on-farm processing. New business means that the business was begun by owner operators with limited previous dairy farming experience.
1
N=14 values used for processing variables, N=13 used for farm and overall variables.
Table 6. Factors Influencing Processing Net Income for On-Farm Dairy Processors, Linear Regression Analysis
Variable Coefficient s.e.
t-statistic
(Constant) -12,132.74 23,139.29 -0.52
Total Milk Used in Processing, 100 lbs 28.88 91.55 3.15
Milk Processed Squared, 100 lbs 0.00 0.00 -5.46
Years in Processing 11,086.34 2,722.56 4.07
Year Processing Squared -264.36 59.70 -4.43
Hired Labor Processing FTE -3,404.55 1,858.07 -1.83
Is Cheese Main Product -22,067.06 20,424.41 -1.08
Sold Majority Through Retailer -24,347.85 21,824.26 -1.12 Sold Majority Through Farm Stand, Market 21,454.76 23,418.25 0.92
Processing Assets, $1000 -202.31 89.14 -2.27
Observations 26
Degrees of freedom 17
Table 7. Farm Enterprise Net Income Per Hundredweight for On-Farm Dairy Processors, by Animal Type
Cows (N=16) Goats & Sheep (N=10) Element of Net Farm Income
Mean s.d. DFBS
(2003)1 Mean s.d.
Raw Milk Sales, $/cwt 7.02 6.90 13.24 6.08 14.76
Transfer Value to Processing, $/cwt 10.87 7.36 -- 41.75 18.01
Total Farm Receipts, $/cwt 26.22 12.72 15.46 61.55 26.23
Farm Hired Labor Expenses, $/cwt 3.57 5.66 2.51 10.00 13.88
Purchased Feed Expenses (Farm), $/cwt 6.91 3.40 4.27 25.75 13.50
Farm Machinery and Equipment Expenses, $/cwt 4.31 4.14 1.24 4.74 2.54
Livestock Expenses (Farm), $/cwt 3.36 1.84 2.89 8.82 5.19
Total Farm Operating Expenses, $/cwt 24.51 11.89 13.39 70.16 25.15
Farm Net Income, $/cwt -2.55 12.64 0.54 -30.47 26.27
Note: All values are per hundredweight milk produced. 1
Data from 201 New York dairy farms participating in the Dairy Farm Business Summary for 2003 (Knoblauch et al., 2004)
Table 8. Processing Net Income Per Hundredweight for On-Farm Dairy Processors, by Animal Type
Cows (N=17)
Goats & Sheep (N=10) Element of Processing Net Income
Mean s.d. Mean s.d.
Dairy Product Sales, $/cwt 62.76 37.81 121.66 33.53
Other Receipts (Processing), $/cwt 1.96 6.99 1.02 2.21
Total Processing Receipts, $/cwt 64.72 41.73 122.68 33.10
Transfer Value to Processing, $/cwt 10.23 7.60 41.75 18.01
Processing Hired Labor Expenses, $/cwt 10.07 19.12 12.58 25.46
Materials and Supplies Expenses (Proc), $/cwt 17.66 17.63 31.53 36.61
Marketing Expenses (Proc), $/cwt 6.60 8.21 12.64 11.63
Processing Miscellaneous Expenses, $/cwt 5.52 6.61 5.98 7.04
Total Processing Operating Expenses, $/cwt 66.39 57.20 101.05 46.12 Operating Expenses Less Milk Transfer Value, $/cwt 50.26 57.48 56.10 50.31
Processing Net Income, $/cwt -11.91 53.24 11.99 61.03
Table 9. Buildup of Economic Costs and Returns Per Hundredweight for On-Farm Dairy Processors, by Animal Type
Cows (N=16) Goats & Sheep (N=10) Element of Economic Cost Buildup
Mean s.d. Mean s.d.
Milk Production, $/cwt milk produced
Net Feed and Crop Expense 3.28 5.83 20.46 17.91
Farm Hired Labor Expenses 3.57 5.66 10.00 13.88
Farm Operator's and Unpaid Family Labor 24.04 25.10 78.87 38.56
Farm Total Labor Expense 27.61 23.78 88.87 38.18
Net Farm Machinery Expense 4.23 4.17 4.74 2.54
Net Livestock Purchases Expense -2.58 4.48 -6.38 7.73
Marketing and Livestock Expense 3.25 1.90 8.43 5.29
Farm Utilities Expenses 0.96 0.78 3.64 3.63
Farm Real Estate and Buildings Expenses 1.33 1.24 7.18 6.10
Farm Depreciation Expense 3.30 3.34 21.62 13.78
Farm Interest Expenses 1.63 3.25 5.19 5.75
Farm Equity Charge 6.94 5.70 21.87 15.88
Total Farm Interest Expense 8.57 8.29 27.06 17.87
Farm Miscellaneous Expenses 1.47 1.07 3.91 2.84
Total Farm Operating Costs 51.40 36.88 179.53 63.03
Product Processing, $/cwt milk processed
Processing Hired Labor Expenses 10.43 19.69 12.58 25.46
Processing Operator's and Unpaid Family Labor 39.21 60.75 81.20 49.04
Processing Total Labor Expense 49.65 76.81 93.79 53.90
Processing Materials and Supplies Expenses 16.94 17.95 31.53 36.61
Processing Machinery and Equipment Expenses 2.12 2.64 1.29 2.07
Processing Real Estate and Buildings Expenses 1.34 1.45 0.93 1.05
Processing Utilities Expenses 3.11 2.28 8.21 7.60
Processing Depreciation Expense 10.63 22.51 10.32 6.11
Processing Interest Expenses 4.32 10.73 3.85 6.93
Processing Equity Charge 2.49 4.05 4.83 4.04
Total Processing Interest Expense 6.81 10.59 8.67 6.74
Processing Marketing Expenses 6.97 8.33 12.64 11.63
Processing Miscellaneous Expenses 5.82 6.71 5.98 7.04
Total Processing Operating Costs 103.38 131.14 173.36 104.13
Total Production and Processing Operating Costs 154.79 132.37 352.89 135.89
Average Return on Product Sales, $/cwt 65.33 37.48 144.00 73.65
Net Return over Total Product Costs, $/cwt -89.45 114.29 -208.89 133.89
Figure 1. Distribution of Total Business Net Income for On-Farm Dairy Processors 300,000 250,000 200,000 150,000 100,000 50,000 0 -50,000 -100,000 -150,000 -200,000
Total Net Income, $ 10 8 6 4 2 0 Frequenc y Mean =1587.58 Std. Dev. =62177.107 N =26