Bui, T, Nguyen, TT and Hasegawa, H
Opposition-based learning for self-adaptive control parameters in differential
evolution for optimal mechanism design
http://researchonline.ljmu.ac.uk/id/eprint/12560/
Article
LJMU has developed LJMU Research Online for users to access the research output of the University more effectively. Copyright © and Moral Rights for the papers on this site are retained by the individual authors and/or other copyright owners. Users may download and/or print one copy of any article(s) in LJMU Research Online to facilitate their private study or for non-commercial research. You may not engage in further distribution of the material or use it for any profit-making activities or any commercial gain.
The version presented here may differ from the published version or from the version of the record. Please see the repository URL above for details on accessing the published version and note that access may require a subscription.
For more information please contact [email protected]
http://researchonline.ljmu.ac.uk/
Citation
(please note it is advisable to refer to the publisher’s version if you
intend to cite from this work)
Bui, T, Nguyen, TT and Hasegawa, H (2019) Opposition-based learning for
self-adaptive control parameters in differential evolution for optimal
mechanism design. Journal of Advanced Mechanical Design, Systems and
Manufacturing, 13 (4). ISSN 1881-3054
Paper No.18-00526
Opposition-based learning for self-adaptive control parameters
in differential evolution for optimal mechanism design
Tam BUI
∗,∗∗, Trung NGUYEN
∗∗and Hiroshi HASEGAWA
∗∗Shibaura Institute of Technology
Fukasaku 307, Minuma-ku, Saitama-shi, 337-8570, Japan E-mail: [email protected]
∗∗Hanoi University of Science and Technology
No.1 Dai Co Viet Road, Hai Ba Trung District, Hanoi, Vietnam
Abstract
In recent decades, new optimization algorithms have attracted much attention from researchers in both gradient-and evolution-based optimal methods. Many strategy techniques are employed to enhance the effectiveness of optimal methods. One of the newest techniques is opposition-based learning (OBL), which shows more power in enhancing various optimization methods. This research presents a new edition of the Differential Evolution (DE) algorithm in which the OBL technique is applied to investigate the opposite point of each candidate of self-adaptive control parameters. In comparison with conventional optimal methods, the proposed method is used to solve benchmark-test optimal problems and applied to real optimizations. Simulation results show the effectiveness and improvement compared with some reference methodologies in terms of the convergence speed and stability of optimal results.
Keywords: Optimization algorithm, Opposition-based learning, Differential evolution, Global search, Local search
1. Introduction
Opposition-based learning (OBL), a new searching principle in optimization, was first proposed by Hamid R. Tizhoosh (2005a), who discovered a better candidate solution by comparing the current particle and its corresponding opposition estimate. In the process of the evolutionary algorithm (EA), candidates are generated randomly in the search domain at the beginning of the process. After that, the EA estimates the new better candidate solution by searching the current individual’s neighborhood. This principle depends on each kind of various metaheuristic algorithms, such as the Genetic Algorithm (GA) (Holland, 1992), Particle Swarm Optimization (PSO) (Kennedy and Eberhart, 1995), Differential Evolution (DE) (Storn and Price, 1997), Ant Colony Optimization (ACO) (Dorigo, 1992), Artificial Bee Colony (ABC) (Karaboga and Basturk, 2006), and Gravitational Search Algorithm (GSA) (Shaw, et al., 2012). The basic idea in OBL is that the searching neighborhood tries to discover a better particle by comparing an estimated particle and its opposite point. Experiments have shown that an opposition candidate solution might provide a higher chance of getting better solutions that are closer to the global optimal one.
S. Rahnamayan et al. (2008a) proposed an improvement of the DE algorithm in which the OBL principle was used to search for a new candidate during the algorithm. Experiment results showed that the proposed algorithm was more effective than the old one by changing from random initialization to OBL initial populations. Furthermore (Rahnamayan et al., 2007, 2008b), mathematically and experimentally proved this advantage as, when there is no prior knowledge of the candidate solution, it is impossible to make the best initial guess. In general, we should be simultaneously exploring all dimensions, and one of these works is expanding in the opposite direction. The gain of the OBL strategy over the random strategy is also shown more clearly, based on Euclidean distance to the global optimal solution; more details can be seen in (Rahnamayan et al.,2007).
Bui , Nguyen and Hasegawa, Journal of Advanced Mechanical Design, Systems, and Manufacturing, Vol.13, No.4 (2019)
In recent years, many proposed methods have discovered the advantage of applying the opposite particle in the population-initialization step and the generation-jumping stage to accelerate many kinds of metaheuristic evolutionary optimization algorithms, such as PSO (Wang, et al., 2011a), ABC (El-Abd, 2012), Harmony Search (HS) (Saha et al., 2013), DE (Wang et al., 2011b), and Gravitational Search Algorithm (Shaw et al.,2012). The OBL principle is also used to improve artificial-intelligence algorithms, including strengthening the learning process and back-propagation train-ing in artificial neural networks (ANNs). Opposition-based reinforcement learntrain-ing (ORL) was proposed by ustrain-ing the opposite-state and opposite-action functions (Tizhoosh, 2005b). Simulation results showed that ORL increases reinforce-ment learning. Similarly, by applying OBL to opposite weights and transfer functions, opposite-based ANNs were also proposed to strengthen their learning speed and stability (Ventresca and Tizhoosh, 2006, 2007, 2008).
Based on the theorem of No Free Lunch for Optimization, there is no optimal algorithm that can perfectly solve all kinds of objective functions. Its performance depends on the complexity of each problem, such as unimodal or multimodal, convex or nonconvex, and integer, real, or mixed variables. Therefore, we need to discover more methods to overcome this drawback. Inspired by the advantage of OBL, this paper presents applied OBL to improve the performance of self-adaptive control parameters in a differential evolution algorithm (Bui et al., 2013). The new proposed algorithm solved nineteen numerical optimizations in the literate benchmark test and four real-world optimal engineerings. Simulation results in the experiments showed effectiveness and improvement compared with the original DE and some reference algorithms. In the proposed OBL–self-adaptive control parameters in differential evolution (ISADE) algorithm, we apply the principle of OBL to both initialization populations and elite particles in the main process of DE.
The ISADE that automatically generate control parameters such as the Number of the Population (NP,NP), scaling factor (F), and crossover control (Cr) do not need to be tuned during the algorithm process. Experimental simulation results on benchmark-test problems showed that OBL-ISADE can perform outstandingly on many of the test problems in comparison with the original DE and other well-known algorithms.
The rest of this paper is organized as follows: Section 2 reviews the original DE, ISADE, and the theory of opposition-based learning. In Section 3, the proposed method is described. The experiments and simulation results are shown in Section 4. Section 5 concludes this paper.
2. Review of differential evolution and opposition-based learning
2.1. Review of differential evolutionDE, first proposed by Storn and Price (1997), is an optimization algorithm that belongs to the evolutionary-algorithm field. Similar to other evolutionary algorithms, DE tries to improve a candidate solution to the global optimum by using crossover, mutation, and selection operators at each generation. Algorithm 1 shows pseudocode DE algorithms.
Algorithm 1: Differential evolution.
1: Initialization :Generate and randomly initialize all NP particles within the boundary.
2: Mutation operation:Compute mutation vectorVusing one of Eq. (1) to Eq. (3) depending on which mutation scheme is in this step.
3: Crossover operation:Compute trial vectorUusing Eq. (9).
4: Selection Operation: In this step, the fitness value is used to evaluate for trial vectorUG
i and target vectorX G
i . The better one is selected for reproducing new offspring by Eq. (10).
5: Repeat Steps 1 to 4 until the terminal condition.
Many experiment simulations (in the literature) show that DE algorithm is outstanding in terms of convergence speed, computation complexity, and robustness compared with many other metaheuristic approaches such as GA (Holland, 1992) and ACO (Dorigo, 1992). However, the effect of DE is mainly dependent on appropriately selecting the control parameters such as population sizeNP, scaling factor F, and crossover rateCR. Many aforementioned studies focused on finding suitable control parameters are given, and we know that it is important to set up the best DE learning strategies in DE and other DE control parameters. To overcome this difficulty, the author of this research (Bui, et al., 2013) proposed the improvement of self-adapting control parameters in differential evolution—a modification and improvement of DE. The main operations in ISADE are shown below:
Adaptive DE mutation-scheme operator: In this step, we automatically choose three kinds of mutation schemes based on the random section: The three DE mutation schemes to be selected are DE/best to 1 Eq. (1), DE/best to 2 Eq. (2), and DE/rand to best/1 Eq. (3). The two first schemes have good convergence (good at local search), while DE/rand to best/1 has good population diversity (global searchability). We apply the same probability to these strategies
(rand1=rand2=rand3=1/3).
DE/best to 1: Viiter,j =Xiterbest,j+F∗(Xiterp1,j−Xiterp2,j) (1)
DE/best to 2: Viiter,j =Xiterbest,j+F∗(Xiterp
1,j−X iter p2,j)+F∗(X iter p3,j−X iter p4,j) (2)
DE/rand to best/1: Viiter,j =Xiterp
1,j+F∗(Xbest,j−X iter p1,j)+F∗(X iter p2,j−X iter p3,j) (3)
WhereX, current vector;V, mutation vector;Xbest, best fitness of current vector;iter, number of iterations (generation);
i, index of number of particles in populationi=1,· · ·,NP; j, index of the number of dimensions j =1,· · ·,D; p1, p2,
p3, and p4 are different elements chosen randomly from [1,NP]; and NP,D, number of populations and dimensions, respectively.
Adaptive scaling factorF: estimating scaling factorF is very important in DE and it greatly affects the nearby search of the current particles. We propose an adaptive form of this parameter to achieve better DE performance. From the experiment, we see that a large-value scale factorFat the beginning of the processing loop allows better exploration, and this value gradually decreases to the end of the loop to allow appropriate exploitation. This can be modeled by some mathematic equation such as linear function, sin or cosine function, hyperbolic tangent, and sigmoidal function. The sigmoid function is widely used in many nonlinear applications, for example, as a transfer function in artificial neural network, or to control the variable neighborhood range on APGA/VNC (Tooyama and Hasegawa, 2009). Inspired by the above ideas, ISADE uses a sigmoid function to calculate scaling factorFas shown in Eq. (4).
Fi= 1 1+expα∗i− NP 2 NP ! (4)
Whereαis the parameter that controls the value of scaling factorF. We can see this more clearly in Figure 1.
0 0.2 0.4 0.6 0.8 1 1.2 1 4 7 10 13 16 19 22 25 28 31 34 37 40 43 46 49 52 55 58 61 64 67 70 73 76 79 82 85 88 91 94 97 100 F Scale factor F alpha<0 alpha>0 Bad fitness Rank number High fitness
Fig. 1 Value of scale factorFdepends on rank numberiandα .
Fmeaniter =Fmin+(Fmax−Fmin)
itermax−iter
itermax
!niter
(5)
WhereFmaxandFminare the lower and upper limitation ofF, respectively. From our experiment, it is recommended to
use values ofFmaxandFmin0.8 and 0.15, respectively.itermax, andniterdenote the maximum iteration, and the nonlinear
modulation index as in Eq. (5);nmaxandnminare typically chosen in the [0, 15] range. Recommended values fornminand
nmaxare 0.2 and 6.0, respectively.
The trend of scaling factorFmean
iter mainly depends on nonlinear modulationniterand iteration numberiter. We can
see this more clearly in Fig. 2.
We separately calculate scale factorFfor each particle in each iteration. The value ofFiteri is the difference for all particles in the population. If we callFiiteran average value of Fi andFitermean, we assign it to each iteration. Then, the
suitable value of scale factor for each particle in every iteration is determined in Eq. (6):
Fiiter=Fi+F
mean iter
Bui , Nguyen and Hasegawa, Journal of Advanced Mechanical Design, Systems, and Manufacturing, Vol.13, No.4 (2019)
From now, we use particle scale factorFiteri in the proposed algorithm instead of general scale factorFin Eq. (1) to Eq. (3) for generating mutation vectorV.
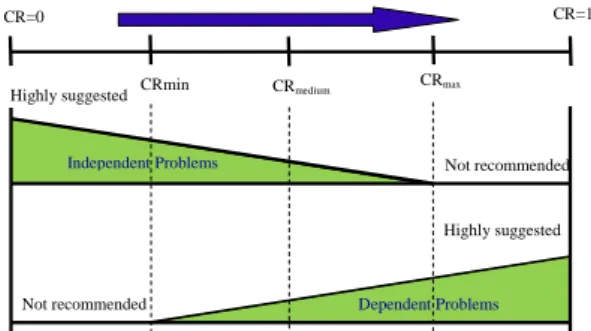
Adaptive crossover control parameter:ISADE can automatically detect theCrvalue. The large value ofCris used if the test problem is dependent (nonseparable functions), while a small value ofCris suitable for independent problems (separable functions). A minimum base forCr around its median value is incorporated to avoid stagnation around a single value. Figure 3 shows this approach, so we propose the ideas behind this adaptive mechanism for crossover control parameterCr, which is assigned as in Eq. (7).
CRiteri +1= rand2 ifrand1≤τ CRiteri otherwise. (7)
whererand1 andrand2 are generated randomly in ∈ [0,1], andτrepresents probabilities to adjustCr, which is also updated using Eq. (8).
The value ofCRis adjusted as in Eq. (8).
CRiteri +1=
CRmin ifCRmin≤CRiteri +1≤CRmed
CRmax ifCRmed≤CRiteri +1≤CRmax.
(8)
whereCrmin,Crmed, andCrmaxare the small, median, and large value of crossover parameterCr, respectively. From our
experimentation, we suggest using the values ofCrmin=0.05,Crmed =0.50,Crmax=0.95, andτ=0.10.
Crossover operation:In this process, current vectorXand mutation vectorVare used to generate a trial vectorU
as in Equation (9). Uiiter= Viter
i,j ifrandj≤CRiteri or j= jrand
Xiter
i,j otherwise.
(9)
Where jrandis a random integer number in [1,D], andrandj(0, 1) is a uniform random real number in [0,1]. Because of
using jrand, trial vectorUdiffers from target vectorX.
Selection operation:The better fitness between target vectorXand trial vectorUare selected for the next generation.
XiG+1=
Uiiter if f(Uiiter)≤ f(Xiiter)
Xiter
i otherwise.
(10)
We propose adaptive particle scaling factorFand adaptive crossover control parameterCrin this research. Therefore, a user has no need to tune the suitable values for both of FandCr. Therefore, the new proposed algorithm is simpler and less time-consuming than the original DE algorithm. It is easier for a user to apply this modified DE to real-world problems. 0.0 0.2 0.4 0.6 0.8 1.0 1.2 1.4 1.6 1.8 1 46 91 1 3 6 1 8 1 2 2 6 2 7 1 3 1 6 3 6 1 4 0 6 4 5 1 4 9 6 5 4 1 5 8 6 6 3 1 6 7 6 7 2 1 7 6 6 81 1 8 5 6 9 0 1 9 4 6 9 9 1 1 03 6 1 08 1 1 12 6 1 17 1 1 21 6 1 26 1 1 30 6 1 35 1 1 39 6 1 44 1 1 48 6 scale factor
Scale factor depend on generation
varying n_i n_min=0.2 n_max=6.0
generation
Fig. 2 Scale factor depending on generation.
Highly suggested Highly suggested CR=0 CR=1 CRmax CRmedium CRmin Not recommended Not recommended Independent Problems Dependent Problems
Fig. 3 Suggested to calculate CR values
2.2. OBL review
Opposition-based learning, first proposed by Hamid R. Tizhoosh (2005a), tries to get a better candidate solution by comparing the current particle and its corresponding opposite estimate. This technique provides a new way to find a better solution that can reach the global optimum. Some definitions of opposition-based learning are introduced that include opposition number in mathematics and opposite particle in evolutionary optimizations, as follows:
Definition of opposite number in mathematics: If variable x is a real number within its boundary [lb,ub], the opposition ofxisox, whereox=lb+ub−x. We can extend the concepts of the opposite number to the multidimension.
Definition of opposite particle in evolutionary optimization: givenp(x1,x2, . . . ,xD) be a particle in D-dimensional
space, wherex1,x2, . . . ,xDare real numbers andxi∈[lbi,ubi]. Then, the opposition of particlep(x1,x2, . . . ,xD) is defined
as in Eq. (11).
oxi=lbi+ubi−xi (11)
wherelbiandubiare the lower and upper boundary ofxi.
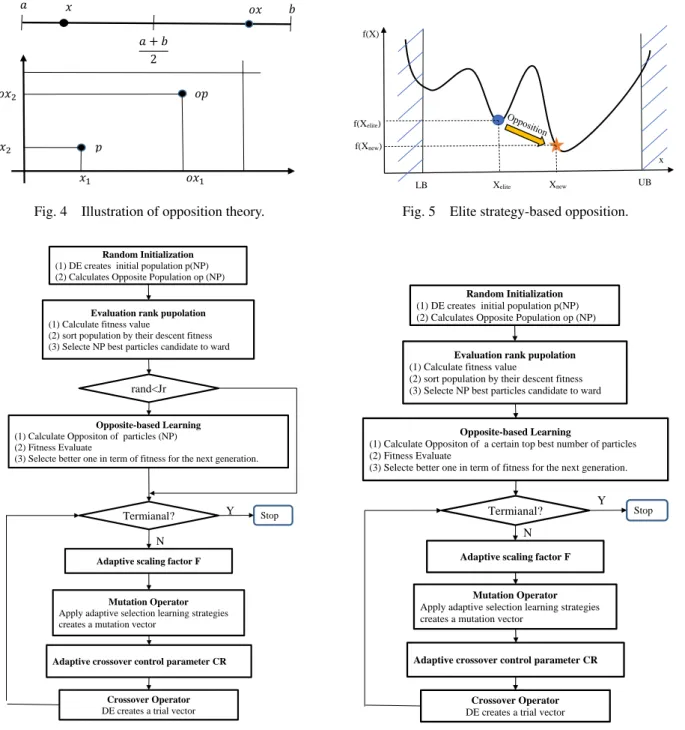
Figure 4 illustrates an example of an opposite number and its corresponding opposition in both one- and two-dimensional spaces.
Opposition-Based Learning:In OBL, both the particle and its corresponding opposition point are simultaneously evaluated based on their fitness value. The better one in term of fitness wins and is selected for reproduction in the next generation. Let f(x) be the objective function and f it(x) be the fitness function. If particlep ∈[a,b] is the current one in the searching population andopis its corresponding opposition, then in every generation of the evolutionary algorithm we compare the fitness value between f it(p) and f it(op). If f it(p)≥ f it(op), then particle pwins overopand continues to the next generation for the production new candidates; otherwise, withop.
3. Proposed new evolutionary algorithm based on OBL
In this section, we proposed two schemes of using OBL to improve the performance of the modified DE. The first scheme is jumping OBL (JOBL-DE), and the other one is elite OBL (EOBL-DE).
3.1. Proposed JOBL-DE
We enhance two main core impotence steps in ISADE, namely, the initialization population and reproducing new candidates for the next generation by evolutionary operators such as mutation, crossover, and selection. In the first step, OBL is applied for all particles (100%) at the initialization population. Different from the first step, in the second step, each particle has a chance to generate its opposition if a random number in [0,1] is less than jumping rate (Jr). The new proposed JOBL-DE implementation process is as in Algorithm 2.
Algorithm 2: JOBL-DE.
1: Initialization—Opposition-Based Learning operation:Generate and randomly initialize all NP numbers of populations within the boundary. After that, calculate their corresponding opposition. We have a total of 2NP number of populations. 2: Evaluate and rank population: Evaluate and rank all populations by their fitness value. After that, select first bestNP
particles for the next generation.
3: Adaptive scaling factor:Calculate adaptive scale factorsFas in Eq.(4) to Eq. (6).
4: Mutation operation:Apply adaptive selection learning strategy to create mutation vectorVin Eq. (1) to (3). 5: Adaptive crossover control parameterCr: Calculate adaptive crossover rateCrin Eq. (7) and Eq. (8). 6: Crossover operation:Trial vectorUis computed in this step using Eq. (9).
7: Selection Operation: In this step, the fitness value is used to evaluate for trial vectorUiGand target vectorXGi . The better one is selected for reproducing new offspring by Eq. (10).
8: Jumping Opposition-Based Learning operation:Each particle is selected randomly to perform opposition-based learning. After that, both the particle and its estimate opposition are compared to each other, and the better one in term of fitness value survives and Is selected for the next generation. Different from opposite-based learning of initialization, the detail about this step can see in the procedure of EOBL-DE Fig. 6.
9: Repeat Steps 2 to 8 until terminal condition.
3.2. Proposed EOBL-DE
To increase local searchability, we applied OBL to the top elite particles after evaluating the fitness of all particles. Therefore, the best nearby elite particles can be discovered and a new better candidate is selected for the next generation. In Fig 5, the position of the elite particle (blue circle symbol) and its corresponding opposition (red star symbol) can be seen. By applying OBL to elite particles (top best particles with the highest fitness value), we can enhance local searchability in this strategy. The new proposed EOBL-DE implementation process is presented as Algorithm 3.
Bui , Nguyen and Hasegawa, Journal of Advanced Mechanical Design, Systems, and Manufacturing, Vol.13, No.4 (2019) 𝑏𝑏 𝑎𝑎 𝑥𝑥 𝑜𝑜𝑥𝑥 𝑎𝑎 + 𝑏𝑏 2 𝑥𝑥1 𝑜𝑜𝑥𝑥1 𝑥𝑥2 𝑜𝑜𝑥𝑥2 𝑝𝑝 𝑜𝑜𝑝𝑝
Fig. 4 Illustration of opposition theory.
LB UB f(Xelite) Xelite Xnew f(X) x f(Xnew)
Fig. 5 Elite strategy-based opposition.
Random Initialization (1) DE creates initial population p(NP) (2) Calculates Opposite Population op (NP)
Evaluation rank pupolation (1) Calculate fitness value
(2) sort population by their descent fitness (3) Selecte NP best particles candidate to ward
Adaptive crossover control parameter CR
Crossover Operator DE creates a trial vector
Termianal?
Adaptive scaling factor F
Mutation Operator Apply adaptive selection learning strategies creates a mutation vectorin Eq. (2) to Eq. (7)
Y
N
Stop Opposite-based Learning
(1) Calculate Oppositon of particles (NP) (2) Fitness Evaluate
(3) Selecte better one in term of fitness for the next generation.
rand<Jr
Fig. 6 Jumping OBL (JOBL-DE) procedure.
Random Initialization
(1) DE creates initial population p(NP) (2) Calculates Opposite Population op (NP)
Evaluation rank pupolation
(1) Calculate fitness value
(2) sort population by their descent fitness (3) Selecte NP best particles candidate to ward
Adaptive crossover control parameter CR
Crossover Operator
DE creates a trial vector
Termianal?
Adaptive scaling factor F
Mutation Operator
Apply adaptive selection learning strategies creates a mutation vectorin Eq. (2) to Eq. (7)
Y N
Stop
Opposite-based Learning
(1) Calculate Oppositon of a certain top best number of particles (2) Fitness Evaluate
(3) Selecte better one in term of fitness for the next generation.
Fig. 7 Elite OBL (EOBL-DE) procedure.
Algorithm 3: EOBL-DE.
1: Steps 1–7 operations are the same asAlgorithm 2.
2: Elite Opposition-Based Learning operation: The top best particles (elite particles in the populations) are selected after ranking all populations by their fitness value. After that, we apply OBL to these elite particles in this step. Both the particle and its corresponding opposite point are evaluated and compared to each other; the better one in term of fitness is selected for the next generation. As a difference from opposite-based initialization learning, there is only some certain amount of best fitness whose opposition is calculated. Details about this step can be seen in the procedure in Fig. 7.
3: Repeat Steps 2 and 3 until terminal condition.
Figure 7 shows the procedure of elite opposition-based learning for modified differential evolution. By considering to use opposite-based learning to our optimization algorithm, the searching process benefits more in terms of convergence speed, stability, and less time consumption. During the simulation, we ran some benchmark tests and real engineering applications to verify the robustness of the new proposed algorithm.
4. Numerical experiment simulation
In this section, to show the effects of the proposed method in terms of convergence speed (time consumption), stability, and accuracy, we compare our new method with other methodologies, including the original DE and an improved version of DE for the robustness of optimization processing.
4.1. Benchmark-test problems
To evaluate the convergence speed and stability of each method, 19 well-known benchmark-test problems were used. These benchmarks are multiple dimensions (Molga, 2005) that contain multidimensional unimodal and multimodal functions: Sphere or first De Jong (f1), the Rosenbrock function known as "Banana" (f2), Griewank (f3), Rastrigin (f4), Ackley (f5), Ridge or Schwefel’s Problem 1.2 (f6), Levy (f7), Schawefel or Schwefel function 2.22 (f8), Schaffer function (f9), Alpine function (f10), Pathological function (f11), Axis Parallel Hyper-Ellipsoid (f12), Sum of Different Power (f13), Zakharov Function (f14), Exponential Problem (f15), Salomon Problem (f16), Bent Cigar Function (f17), Expanded Schaffer’s F6 Function (f18), and Schwefel Function (f19). The details of all benchmarks are summarized in Appendix A.
All benchmark-test functions are continuous. They can be divided into groups as follows:
Group 1:Unimodal, convex, and multidimensional.
Group 2:Multimodal, nonconvex, multidimensional, with a few local optimums.
Group 3:Multimodal, nonconvex, multidimensional, with many local optimums.
Group 4: Independent functions: If the function is independent, each variablexican be optimized independently.
Func-tions of this category are easy to solve.
Group 5:Dependent functions: If the function is dependent (nonseparable), then all its variables have a strong relation-ship with each other and cannot be independently optimized. Such functions are relatively difficult to solve.
All benchmark tests are formulated hereinafter as minimization problems, but this does not lose generality that can also be applied for maximization problems by the simple converting sign of the objective function.
4.2. Comparing the robustness of the new proposed algorithm and reference approaches
We compare the robustness of the two new proposed algorithms (JOBLDE and EOBLDE) with the original DE (Storn and Price, 1997) and reference methods ISADE (Bui et al., 2013) by measuring the number of function evaluation calls (FE) and the success rate. The number of FE is the most popular parameter that is used to evaluate the convergence speed of an optimization method. The smaller the FE is, the higher the convergence speed is. The second parameter that is used to show the stability of each algorithm is success rate (S R); one simulation is a success (S R=1) if it can reach the termination-error value () before reachingFEmax. Each test function is used to calculate bothS RandFE. Terminate
before reachingFEmaxif the error in the function value is=10−8or less.
In the experiment, we set a parameter such as number of dimensionsD =30, number of populations NP = 100, accurate=108, and maximum number of function evaluation callsFEmax=10000∗D=300000 for a fair performance
comparison. We also used F=0.5 and Cr=0.9 for the original DE algorithm. Our decision for using those values was based on proposed values from the literature DE (Storn and Price, 1997) and ISADE (Bui et al., 2013). All simulations were independently given 50 runs per test function. We used the same uniform random initialization for comparison pairs. This can be achieved by using a fixed seed for a random-number generator in MATLAB software.
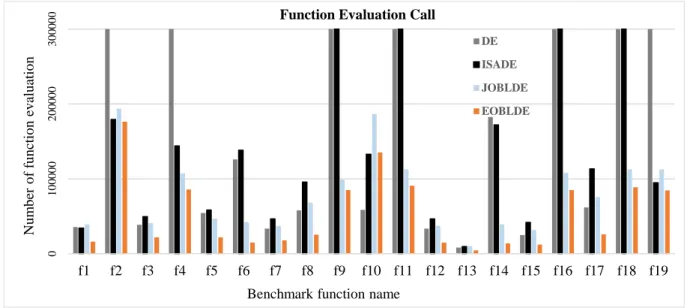
The simulation results of the two new proposed algorithms (JOBLDE and EOBLDE) with the original DE and reference method ISADE to solve all benchmark problems are given in Table 1 and Figure 8. As can be seen, ISADE, JOBLDE, and EOBLDE could reach the global optimal solutions for all benchmark-test problems except for f10, the success rate equaled 100%, and DE was not stable to reach the termination-error value ( =10−8). The success rate of DE was equal to zero on test problems f2, f4, f9, f16, f18, and f19. Therefore, we can say that the new methods, JOBLDE and EOBLDE, were more stable than DE and ISADE.
In terms of comparing number of function calls FE, JOBLDE and EOBLDE also reached the global solution at fewer function calls than the reference in all benchmark functions except test function f10. From the above comparisons, comments, and evaluations, we can see that the proposed methods could reach the global optimal optimum with fewer function evaluation calls than of the reference. With the nine benchmark tests, f4, f5, f8, f9, f11, f14, f16, f18 and f19, new approaches are much robust. Convergence speed to the global optimum solution can be significantly improved than that in EAs for the same termination-error value.
Bui , Nguyen and Hasegawa, Journal of Advanced Mechanical Design, Systems, and Manufacturing, Vol.13, No.4 (2019)
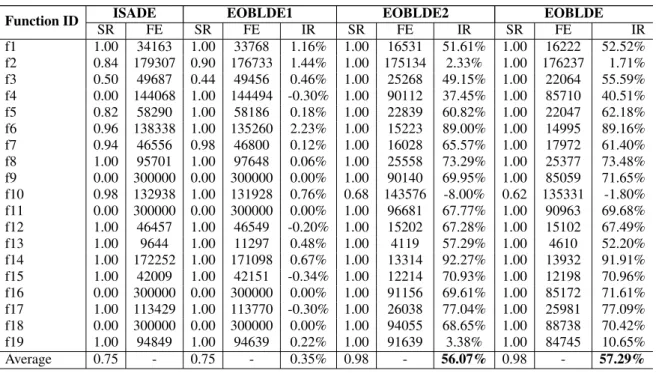
Table 1 Results for comparing robustness of the new proposed algorithm.
Function ID DE ISADE JOBLDE EOBLDE
SR FE SR FE SR FE SR FE IR f1 1.00 35688 1.00 34163 1.00 39255 1.00 16222 54.54% f2 0.00 300000 0.84 179307 1.00 193766 1.00 176237 41.25 f3 0.34 38641 0.50 49687 1.00 40759 1.00 22064 42.90% f4 0.00 300000 1.00 144068 1.00 107351 1.00 85710 71.43% f5 0.82 54385 1.00 58290 1.00 46712 1.00 22047 59.46% f6 1.00 126046 0.96 138338 1.00 42267 1.00 14995 88.10% f7 0.76 33618 0.94 46556 1.00 37269 1.00 17972 46.54% f8 1.00 57898 1.00 95701 1.00 68416 1.00 25377 56.17% f9 0.00 300000 0.00 300000 1.00 99038 1.00 85059 71.65% f10 1.00 58682 0.98 132938 0.58 186813 0.62 135331 -130.62% f11 0.00 300000 0.00 300000 1.00 112790 1.00 90963 69.68% f12 1.00 33614 1.00 46457 1.00 37413 1.00 15102 55.07% f13 1.00 8322 1.00 9644 1.00 10181 1.00 4610 44.61% f14 1.00 182620 1.00 172252 1.00 39307 1.00 13932 92.37% f15 1.00 24942 1.00 42009 1.00 31603 1.00 12198 51.09% f16 0.00 300000 0.00 300000 1.00 108121 1.00 85172 71.61% f17 1.00 61828 1.00 113429 1.00 75826 1.00 25981 57.98% f18 0.00 300000 0.00 300000 1.00 112636 1.00 88738 70.42% f19 0.00 300000 1.00 94849 1.00 112648 1.00 84745 71.75%
In the final review of the result, the last column of Table 2 shows the improvement rate of EOBLDE over reference DE. EOBLDE could improve the convergence speed by more than 40% of the improvement rate (IR) for all benchmark functions except test function f10. Comparing between the two new proposed algorithms (JOBLDE and EOBLDE), EOBLDE converged faster and more stably than JOBLDE.
Figures 9 to 14 show the behavior of all algorithms for six test problems, f2, f3 f5, f7, f12, and f13. The horizontal axis presents the number of iterations, while the vertical axis presents the function value. These graphs show that our algorithms (EOBLDE and JOBLDE) converged to the global optimum minimum value with accurate =108 at fewer iterations than the renaming reference algorithms.
0 1 0 0 00 0 2 0 0 00 0 3 0 0 00 0 f1 f2 f3 f4 f5 f6 f7 f8 f9 f10 f11 f12 f13 f14 f15 f16 f17 f18 f19 N um b er o f f unc ti o n eva lua ti o n
Benchmark function name
Function Evaluation Call
DE
ISADE
JOBLDE
EOBLDE
Fig. 8 Comparison of function calls and success rate on all benchmarks.
Last consideration in this section is the contribution of opposition-based learning in the EOBLDE; we used OBL at two different processes: the first is the creation of the initial population and the other is the creation of new particles during the evolution of the ISADE algorithm. To see the contribution of each process in the EOBLDE, we investigated which one is important to improve computational performance. In order to do that, we separated the two processes into two cases: in the first case, EOBLDE only uses OBL in the initial population and is called EOBLDE1; in the second case, EOBLDE only uses OBL in the main process to create new particles and it is called EOBLDE2. All sets of benchmarks
0 500 1000 1500 2000 2500 3000 iteration 10-10 10-8 10-6 10-4 10-2 100 102 104 fitness-value Rosenbrock function(f2) DE ISADE JOBLDE EOBLDE
Fig. 9 Convergence graph for f2.
0 100 200 300 400 500 600 iteration 10-10 10-8 10-6 10-4 10-2 100 102 104 fitness-value Griewank function(f3) DE ISADE JOBLDE EOBLDE
Fig. 10 Convergence graph for f3.
0 100 200 300 400 500 600 700 iteration 10-10 10-8 10-6 10-4 10-2 100 102 fitness-value
Ackley function(f5)
DE ISADE JOBLDE EOBLDE
Fig. 11 Convergence graph for f5.
0 50 100 150 200 250 300 350 400 450 500 iteration 10-10 10-8 10-6 10-4 10-2 100 102 104 fitness-value
Levy function(f7)
DE ISADE JOBLDE EOBLDE
Fig. 12 Convergence graph for f7.
0 50 100 150 200 250 300 350 400 450 500 iteration 10-10 10-8 10-6 10-4 10-2 100 102 104 fitness-value
Axis Parallel Hyper-Ellipsoid function (f12)
DE ISADE JOBLDE EOBLDE
Fig. 13 Convergence graph for f12.
0 10 20 30 40 50 60 70 80 90 100 iteration 10-10 10-8 10-6 10-4 10-2 100 fitness-value
Sum of Different Powerfunction (f13) DE ISADE JOBLDE EOBLDE
Fig. 14 Convergence graph for f13.
and parameters, same as above, are used to perform simulations for ISADE, EOBLDE1, EOBLDE2, and EOBLDE. Table 2 shows the improvement-rate (IR), function-evaluation-call (FE), and success-rate (S R) values obtained by all algorithms in 50 runs for each function.
As shown in Table 2, both EOBLDE1 and EOBLDE2 could improve computational performance compared with the reference IASDE, but EOBLDE2 was much better than EOBLDE1 in terms of average improvement rate (IR), that is, 56.07% compared with 0.35%. We also see that EOBLDE was better than both EOBLDE1 and EOBLDE2, so using opposition-based learning at two different processes of EOBLDE was the best choice in this study.
Bui , Nguyen and Hasegawa, Journal of Advanced Mechanical Design, Systems, and Manufacturing, Vol.13, No.4 (2019)
Table 2 Results of comparing EOBLDE1 and EOBLDE2.
Function ID ISADE EOBLDE1 EOBLDE2 EOBLDE
SR FE SR FE IR SR FE IR SR FE IR f1 1.00 34163 1.00 33768 1.16% 1.00 16531 51.61% 1.00 16222 52.52% f2 0.84 179307 0.90 176733 1.44% 1.00 175134 2.33% 1.00 176237 1.71% f3 0.50 49687 0.44 49456 0.46% 1.00 25268 49.15% 1.00 22064 55.59% f4 0.00 144068 1.00 144494 -0.30% 1.00 90112 37.45% 1.00 85710 40.51% f5 0.82 58290 1.00 58186 0.18% 1.00 22839 60.82% 1.00 22047 62.18% f6 0.96 138338 1.00 135260 2.23% 1.00 15223 89.00% 1.00 14995 89.16% f7 0.94 46556 0.98 46800 0.12% 1.00 16028 65.57% 1.00 17972 61.40% f8 1.00 95701 1.00 97648 0.06% 1.00 25558 73.29% 1.00 25377 73.48% f9 0.00 300000 0.00 300000 0.00% 1.00 90140 69.95% 1.00 85059 71.65% f10 0.98 132938 1.00 131928 0.76% 0.68 143576 -8.00% 0.62 135331 -1.80% f11 0.00 300000 0.00 300000 0.00% 1.00 96681 67.77% 1.00 90963 69.68% f12 1.00 46457 1.00 46549 -0.20% 1.00 15202 67.28% 1.00 15102 67.49% f13 1.00 9644 1.00 11297 0.48% 1.00 4119 57.29% 1.00 4610 52.20% f14 1.00 172252 1.00 171098 0.67% 1.00 13314 92.27% 1.00 13932 91.91% f15 1.00 42009 1.00 42151 -0.34% 1.00 12214 70.93% 1.00 12198 70.96% f16 0.00 300000 0.00 300000 0.00% 1.00 91156 69.61% 1.00 85172 71.61% f17 1.00 113429 1.00 113770 -0.30% 1.00 26038 77.04% 1.00 25981 77.09% f18 0.00 300000 0.00 300000 0.00% 1.00 94055 68.65% 1.00 88738 70.42% f19 1.00 94849 1.00 94639 0.22% 1.00 91639 3.38% 1.00 84745 10.65% Average 0.75 - 0.75 - 0.35% 0.98 - 56.07% 0.98 - 57.29%
4.3. Applying newly proposed method for solving real-world applications
To show the ability of the newly proposed method, some real-world constrained problems were used in this section. EOBLDE is very robust compared with JOBLDE and other methods.
A set of four well-known mechanical-design optimization problems were selected in this experiment. A more de-tailed description of these constrained engineering-design optimization problems is presented in Appendix B. These test problems have previously been used to evaluate the efficacy of many other methodologies in the optimization literature.
Some parameters were set for all experiments: number of population NP = 8∗D, and the terminal stopped at maximum function evaluationsFEmax. All simulations were independently given 50 runs per test problem.
To handle the constrained optimization problems, we first applied penalty methods (Alice and David,1996) to convert a constrained optimization problem to unconstrained problems. The basic formulas are shown below:
Constrained objective function:Minimize f(X)
WhereX∈Dis a vector of design variables of dimensionD, and f is a scalar objective function. - Inequality constraints:gi(X)≤0i=1. . .q
- Equality constraints:hj(X)=0 j=q+1. . .m
Whereq is the number of inequality constraints,m−q is the number of equality constraints,gi(X) andhj(X) are the
functions of inequality and equality constraints.
Boundary on variables:LB≤X≤U B
WhereLBandU Bare the lower and upper boundary of the variable
Unconstrained objective function:MinimizeF(x)= f(X)+cP(X)
Whereciis a positive constant, and termP(X) is the penalty function as in Eq. (12).
P(X)=1 2 m X i=1 max{0, gi(X)}2 (12)
Experiment results for the Welded Beam problem (E01): Some methods are given for making comparisons for this problem, such as the coevolutionary differential evolution method (CDE) (Huang et al., 2007), coevolutionary particle-swarm optimization (CPSO) (He and Wang, 2006), the GA-based coevolution model (CGA) (Coello, 2000), and study method EOBLDE. The best solutions found by the above methods are listed in Table 3, and their statistical objective values are shown in Table 4. From Table 3, it can be seen that the best solution found by EOBLDE was the best between those of all methods. From Table 4, we can see that the average searching quality of EOBLDE and the standard deviation of the objective function were also better than those of the others.
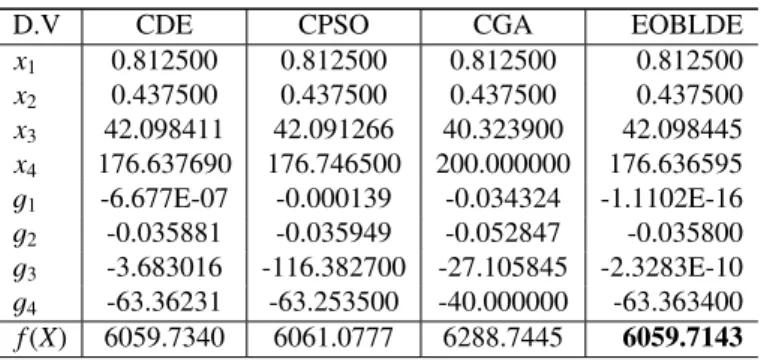
Experiment results for the Pressure Vessel problem (E02):We continued applying the methods of CDE, CPSO, CGA, and our EOBLDE to this problem. The best solutions obtained by the above approaches are listed in Table 5, and
Table 3 Best solutions found for the Welded Beam.
D.V CDE CPSO CGA EOBLDE
x1 0.203137 0.202369 0.208800 0.205729 x2 3.542998 3.544214 3.420500 3.470488 x3 9.033498 9.048210 8.99750 9.036623 x4 0.206179 0.205723 0.210000 0.205729 g1 -44.57856 -12.83979 -0.337812 -1.4790E-7 g2 -44.66353 -1.247467 -353.9026 -1.8863E-7 g3 -0.003042 -0.001498 -0.001200 -9.7584E-11 g4 -3.423726 -3.429347 -3.411865 -3.432983 g5 -0.078137 -0.079381 -0.083800 -0.080729 g6 -0.235557 -0.235536 -0.235649 -0.235540 g7 -38.02826 -11.68135 -363.2323 -4.4691E-8 f(X) 1.733462 1.728024 1.748309 1.724852
Table 4 Statistical results for the Welded Beam.
Methods Best Mean Worst Std
CDE 1.733461 1.768158 1.824105 0.022
CPSO 1.728024 1.748831 1.782143 0.013
CGA 1.748309 1.771973 1.785835 0.011
EOBLDE 1.724852 1.724856 1.725001 2.131E-5
their statistics of objective-function values are shown in Table 6. From Table 5, it can be seen that the best solution found by EOBLDE was the best between those of all approaches. From Table 6, it can be found that the average searching quality of EOBLDE was also better than those of reference methods.
Table 5 Best solutions found for the Pressure Vessel.
D.V CDE CPSO CGA EOBLDE
x1 0.812500 0.812500 0.812500 0.812500 x2 0.437500 0.437500 0.437500 0.437500 x3 42.098411 42.091266 40.323900 42.098445 x4 176.637690 176.746500 200.000000 176.636595 g1 -6.677E-07 -0.000139 -0.034324 -1.1102E-16 g2 -0.035881 -0.035949 -0.052847 -0.035800 g3 -3.683016 -116.382700 -27.105845 -2.3283E-10 g4 -63.36231 -63.253500 -40.000000 -63.363400 f(X) 6059.7340 6061.0777 6288.7445 6059.7143
Experiment results for the Speed Reducer problem (E03): Some well-known methods are given for making comparisons for this problem, such as the Adaptive Penalty Method, include AIS-GAH and APMbc (Bernardino et al., 2008), the simple real-coded steady-state genetic algorithm APMrc (Afonso et al., 2010), and our method EOBLDE. Table 7 shows the best solution found by our proposed algorithm and others from the literature, and their statistical objective-function values are shown in Table 8. In these experiments, we set the maximum number of objective-function evaluations to 36,000. From the test result, we can observe that all methods could essentially reach the same optimal design variables. The best value was found by our EOBLDE, APMbc, and APMrc, the same at (2996.3480). Table 7 shows the final values of the objective function for 50 independently runs (all solutions were feasible). As seen in Table 7, the best solution found by our method EOBLDE was the same as those found by the reference methods. The comparison of the statistical results of the different methods in Table 8 shows that the average searching quality of EOBLDE was also better than those of the other methods, and even the worst solution found by EOBLDE was better than the best solution found by the references.
Experiment results for Tension/compression Spring problem (E04): The four methods applied to this problem were CDE, CPSO, CGA, and our study method EOBLDE. The best solutions obtained by the above approaches are listed in Table 9, and their objective-function value is shown in Table 10. From Table 9, it can be seen that the best solution found by EOBLDE was the best among those of all approaches. From Table 10, it can be found that the average searching quality of EOBLDE was also better than those of others.
Bui , Nguyen and Hasegawa, Journal of Advanced Mechanical Design, Systems, and Manufacturing, Vol.13, No.4 (2019)
Table 6 Statistical results for the Pressure Vessel.
Methods Best Mean Worst Std
CDE 6059.7340 6085.2303 6371.0455 43.013 CPSO 6061.0777 6147.1332 6363.8041 86.454 CGA 6288.7445 6293.8432 6308.1497 7.413
EOBLDE 6059.7143 6093.8431 6370.7797 83.671 Table 7 Best solutions found for the Speed Reducer.
DV AIS-GAH APMbc APMrc EOBLDE
x1 3.500001 3.500000 3.500000 3.500000 x2 0.700000 0.700000 0.700000 0.700000 x3 17 17 17 17 x4 7.300008 7.300000 7.300000 7.300000 x5 7.800001 7.800000 7.800000 7.713888 x6 3.350215 3.350215 3.350215 3.350215 x7 5.286684 5.286683 5.286683 5.285353 f(X) 2996.3483 2996.3482 2996.3482 2.993.6132
Table 8 Statistical results for the Speed Reducer.
Methods Best Mean Worst Std
AIS-GAH 2996.3483 2996.3501 2996.3599 7.45E-3
APMbc 2996.3482 3033.8807 3459.0948 1.10E+2
APMrc 2996.3482 2997.4728 3051.4556 7.87
EOBLDE 2993.6132 2993.6165 2993.6296 0.33E-2 Table 9 Best solutions found for the Tension/Compression.
DV CDE CPSO CGA EOBLDE
x1(d) 0.051609 0.051728 0.051480 0.051689 x2(D) 0.354714 0.357644 0.351661 0.356718 x3(N) 11.410831 11.244543 11.632201 11.288947 g1(X) -0.000039 -0.000845 -0.002080 -2.220E-16 g2(X) -0.000183 -1.2600E-05 -0.000110 -1.1102E-16 g3(X) -4.048627 -4.051300 -4.026318 -4.053785 g4(X) -0.729118 -0.727090 -4.026318 -0.727728 f(X) 0.0126702 0.0126747 0.0127048 0.012665
Table 10 Statistical results for the Tension/Compression.
Methods Best Mean Worst Std
CDE 0.012670 0.012703 0.012790 2.70E-5 CPSO 0.012674 0.012730 0.012924 5.19E-5 CGA 0.012704 0.012769 0.012822 3.93E-5 EOBLDE 0.012665 0.012669 0.012713 9.01E-6
5. Conclusions
In this research, the two new schemes of applying OBL to improve the performance of self-adaptive control param-eters in difference-evaluation algorithms have been proposed to solve complex high-dimension optimization problems. The main idea is that we used the principle of opposition-based learning to generate a better candidate in the process of searching for the optimal solution in DE.
Nineteen benchmark problems and four real constrained mechanical optimizations were used to validate the ro-bustness of the new approaches. The new approaches performed well in all test benchmarks, and both the required function-evaluation calls (FE) and the success rate to the solutions were found. The simulation results show that the new approaches, especially EOBLDE, outperformed in all the objective test functions. The convergence speed of EOBLDE was better and more stable than that of DE and ISADE.
The new method, EOBLDE, is a powerful optimal algorithm. We can use this method as a tool for solving many real-world applications in the optimization design area. By proposing this new approach of the optimization algorithm, it gives more options to researchers and engineers in suitable optimal algorithms in their work.
6. Appendix A
f01 Shere function(1st De Jong): f(x)=Pn i=1x
2
i
f02 Rosenbrock function (Rosenbrock valley): f(x)=Pn
i=1[b(xi+1−x 2 i) 2+(a−x i)2] f03 Griewank function: f(x)=1+Pn i=1 x2 i 4000− Qn i=1cos( xi √ i) f04 Rastrigin function: f(x)=10n+Pn i=1(x 2 i −10cos(2πxi))
f05 Ackley function: f(x)=−a.exp(−b
q 1 n Pn i=1x 2 i)−exp( 1 n Pn i=1cos(cxi))+a+exp(1)
f06 Ridge function (Schwefel Problem 1.2): f(x1· · ·xn)=Pin=1(Pij=1xj)2
f07 Levy function: f(x)=sin2(4πx1)+Pin=−11(xi−1.0)2(1.0+sin(3πxi+1)2)+(xn−1)2(1+sin2(4πxn))
f08 Schawefel function (Schwefel 2.22 function): f(x)=Pn i=1|xi|+
Qn i=1|xi| f09 Schaffer function: f(x, y)=0.5+sin2(
√ x2+y2)−0.5 [1+0.001·(x2+y2)]2 f10 Alpine function: f(x)=Pn i=1|xisin(xi)+0.1xi| f11 Pathological function: f(x)=Pn−1 i=1 0.5+ (sin √ 100x2 i+x2i+1)2−0.5 1+0.001(x2 i+x 2 i+1−2xixi+1)2
f12 Axis Parallel Hyper-Ellipsoid: f(x)=Pn i=1ix
2
i
f13 Sum of Different Power: f(x)=Pn i=1|xi| i+1 f14 Zakharov Function: f(x)=Pn i=1x 2 i +( Pn i=10.5ixi) 2+(Pn i=10.5ixi) 4 f15 Exponential Problem: f(x)=−exp(−0.5Pn
i=1x 2
i)
f16: Salomon Problem: steepness: f(x)=1−cos(2π
q PD i=1x 2 i)+0.1 q PD i=1x 2 i
f17 Bent Cigar Function: f18: Schwefel Function: f(x)=418.9829d−Pn i=1xisin(
√
|xi|)
f19: Schwefel Function: f(x)= f(x1,x2, ...,xn)=418.9829d−Pni=1xisin( √
|xi|)
7. Appendix B
7.1. Welded-beam design problem (E01)
The problem is to design a welded beam for minimal cost, subject to some constraints (Ragsdell and Phillips, 1976). Figure 15 shows the welded-beam structure. The objective is to find the minimal fabrication cost, considering four design variables: x1(h),x2(l),x3(t),x4(b) and constraints of shear stressτ, bending stress in beamσ, buckling load on barPc,
and end deflection on beamδ. The optimization model is summarized in the next equation: Minimize: f(x)=1.10471x2 1x2+0.04811x3x4(14.0+x2) subject to: g1(x)=τ(x)−13,600≤0 ; g2(x)=σ(x)−30,000≤0 ; g3(x)=x1−x4 ≤0 ; g4(x)=0.10471x21+ 0.04811x3x4(14.0+x2)−5.0≤0 ; g5(x)=0.125−x1 ≤0 ; g6(x)=δ(x)−0.25≤0 ; g7(x)=6,000−Pc(x)≤0 With τ(x)= q (τ,)2+(2τ,τ,,) x2 2R+(τ,,) 2 ; τ,= √6,000 2x1x2 ; τ,,= MRJ M=6,00014.0+x2 2 ; R= q x2 2 4 + x 1+x3 2 2 ; J=2 ( x1x2 √ 2 " x2 2 4.0+ x 1+x3 2 2#) σ(x)=504x,000 4x23 ; δ(x)=(3065×,856106,)000x 4x33 Pc(x)=4.013(30×10 6) r x23x64 36.0 196.0 1− x3 r 30×106 4(12×106 ) 28.0 ! With 0.1≤x1,x4≤2.0, and 0.1≤x2,x3≤10.0.
7.2. Pressure-vessel design problem (E02)
Designing an air-storage tank that works under high-compression pressure of 3000 psi (Sandgren,1990). The initial-ization design is a cylindrical vessel with both ends by hemispherical heads Fig. 16. The objective is to get the lowest total cost. Design variables are end thicknessx1(T s), head thicknessx2(T h), inner radiusx3(R), and length of cylindrical lengthx4(L). This design is constrained to single-objective optimization as below:
Minimize: f(x)=0.6224x1x3x4+1.7781x2x23+3.1661x 2 1x4+19.84x21x3 subject to:g1(x)=−x1+0.0193x3≤0;g2(x)=−x2+0.00954x3 ≤0; g3(x)=−πx32x4−43πx33+1,296,000≤0;g4(x)=x4−240≤0 1×0.0625≤x1,x2≤99×0.0625, and 10≤x3,x4≤200.
2
© 2019 The Japan Society of Mechanical Engineers
Bui , Nguyen and Hasegawa, Journal of Advanced Mechanical Design, Systems, and Manufacturing, Vol.13, No.4 (2019)
[DOI: 10.1299/jamdsm.2019jamdsm0072]
4.3
The Welded Beam design
The objective is to minimize the cost
C
(
h, l, t, b
)
of the beam where
h
∈
[0
.
125
,
10]
, and
0
.
1
≤
l, t, b
≤
10
. The objective and constraints read
Deb
(
2000
)
C
(
h, l, t, b
) = 1
.
10471
h
2l
+ 0
.
04811
tb
(14
.
0 +
l
)
g
1(
τ
) = 13
,
600
−
p
(
τ
′)
2+ (
τ
′′)
2+
lτ
′τ
′′/α
≥
0
g
2(
σ
) = 30
,
000
−
504000
/
(
t
2b
)
≥
0
g
3(
b, h
) =
b
−
h
≥
0
g
4(
P
c) =
P
c−
6
,
000
≥
0
g
5(
δ
) = 0
.
25
−
2
.
1952
/
(
t
3b
)
≥
0
τ
′=
√
6000
2
hl
α
=
p
0
.
25(
l
2+ (
h
+
t
)
2)
P
c= 64746
.
022(1
−
0
.
0282346
t
)
tb
3τ
′′=
6000(14 + 0
.
5
l
)
α
2(0
.
707
hl
(
l
2/
12 + 0
.
25(
h
+
t
)
2))
C
(
h, l, t, b
) = 1
.
10471
h
2l
+ 0
.
04811
tb
(14
.
0 +
l
)
g
1(
τ
) = 13
,
600
−
τ
≥
0
g
2(
σ
) = 30
,
000
−
σ
≥
0
g
3(
b, h
) =
b
−
h
≥
0
g
4(
P
c) =
P
c−
6
,
000
≥
0
g
5(
δ
) = 0
.
25
−
δ
≥
0
The expressions for
τ
,
σ
,
P
c, and
δ
are given by:
τ
=
p
(
τ
′)
2+ (
τ
′′)
2+
lτ
′τ
′′/α
τ
′=
√
6000
2
hl
α
=
p
0
.
25(
l
2+ (
h
+
t
)
2)
σ
=
504000
t
2b
τ
=
2(0
.
707
hl
(
l
2/
12 + 0
.
25(
h
+
t
)
2))
l
h
t
F
b
Figure 4: The Welded Beam
The Table
5
shows a comparison of results where the best value found (final cost equal to
2.38122) corresponds to the AIS-GA
Cpresented in the reference
Bernardino et al.
(
2007
). The
Table
6
shows the design variables corresponding to the best solution found by each technique.
All the solutions are feasible and the number of function evaluations was set to 320,000 (200
individuals in the population).
Mecánica Computacional Vol XXIX, págs. 9287-9303 (2010)
9295
Copyright © 2010 Asociación Argentina de Mecánica Computacional http://www.amcaonline.org.ar Fig. 15 Welded-beam design-optimization problem
R
L TS
R
h
T
Figure 5: The Pressure Vessel.
Best Median Average St.Dev Worst fr ne
AIS-Coello 6061.123 − 6734.085 − 7368.060 − 150,000 AIS-GA 6060.368 − 6743.872 − 7546.750 − 80,000 AIS-GAC 6060.138 − 6385.942 − 6845.496 − 80,000 AIS-GAh 6059.855 6426.710 6545.126 1.24E+2 7388.160 50 80,000 APMbc 6065.822 6434.435 6632.376 5.15E+ 2 8248.003 50 80,000 SR 6832.584 7073.107 7187.314 2.67E+ 2 8012.651 50 80,000 APMrc 6059.715 6288.529 6344.079 2.78E+ 2 6928.386 49 80,000
Table 7: Values of the weight found for the Pressure Vessel design
AIS-Coello AIS-GA AIS-GAC AIS-GAH APMbc SR APMrc
Ts 0.8125 0.8125 0.8125 0.8125 0.8125 1.1250 0.8125
Th 0.4375 0.4375 0.4375 0.4375 0.4375 0.5625 0.4375
R 42.0870 42.0931 42.0950 42.0973 42.0492 58.1267 42.0984
L 176.7791 176.7031 176.6797 176.6509 177.2522 44.5941 176.6368
W 6061.1229 6060.3677 6060.138 6059.8546 6065.8217 6832.5836 6059.715
Table 8: Design variables found for the best solutions for the Pressure Vessel design
Mecánica Computacional Vol XXIX, págs. 9287-9303 (2010) 9297
Copyright © 2010 Asociación Argentina de Mecánica Computacional http://www.amcaonline.org.ar
Fig. 16 Pressure-vessel design-optimization problem.
7.3. Speed-reducer design problem (E03)
The design of the speed reducer (Golinski,1973) shown in Fig. 17, is considered with face width x1(l), module of teethx2(z1), number of teeth on second gearx3(z2), length of first shaft between bearingsx4(l1), length of second shaft between bearingsx5(l2), diameter of first shaftx6(d1), and diameter of second shaftx7(d2) (all variables continuous except
x3, that is, integer). The weight of the speed reducer is to be minimized subject to constraints on bending stress of the gear teeth, surface stress, transverse deflections of the shafts, and stresses in the shaft. The mathematical formulation of this problem is:
Minimize: f(x)=0.7854x1x22(3.3333x23+14.9334x3−43.0934)−1.508x1(x26+x27)+7.4777(x36+x73)+0.7854(x4x26+x5x27) subject to: g1(x) = x27.0 1x22x3 −1 ≤ 0; g2(x) = x397.5 1x22x23 −1 ≤ 0 g3(x) = 1.93x3 4 x2x3x26 −1 ≤ 0; g4(x) = 1.93x3 5 x2x3x47 −1 ≤ 0 g5(x) = 1101.0x3 6 s 745x4 x2x3 !2 +16.9×10⁶−1 ≤0 g 6(x) = 85.10x3 7 s 745.0x5 x2x3 !2 +157.5×10⁶−1 ≤0g 7(x) = x402x.03 −1 ≤0; g8(x)=5.0xx2 1 −1≤0; g9(x)= x1 12.0x2−1.0≤0g10(x)= 1.5x6+1.9 x4 −1≤0 ; g11(x)= 1.1x7+1.9 x5 −1≤0 2.6≤x1≤3.6; 0.7≤x2≤0.8; 17≤x3≤28; 7.3≤x4≤8.3; 7.8≤x5≤8.3; 2.9≤x6≤3.9; and 5.0≤x7≤5.5.
7.4. Tension/compression-spring design problem (E04)
We designed a tension/compression spring (Belegundu,1982). The objective function was minimal weight, while constraints were minimal deflections, shear stress, surge frequency, and limits on outside diameter and on design variables. The design variables were wire diameterx1(d), outer diameterx2(D), and number of turnsx3(N), as seen in Fig. 18. This design was constrained to single-objective optimization as below:
Minimize: f(x)=(x3+2)x2x21 constraints:g1(x)=1− x3 2x3 7,1785x4 1 ≤0; g2(x)= 4x2 2−x1x2 12,566(x2x31−x41)+ 1 5,108x2 1 −1≤0; g3(x)=1−140x2.45x1 2x3 ≤0; g4(x)= x11+.5x2−1≤0 0.05≤x1 ≤2, 0.25≤x2 ≤1.3, and 2≤x3≤15. 1 l l2 z1 z2 d 2 d1
Figure 3: The Speed Reducer
Best Median Average St.Dev Worst fr
ES-Coello 3025.0051 − 3088.7778 − 3078.5918 − AIS-GA∗ 2996.3494 2996.356 2996.3643 4.35E−3 2996.6277 50 AIS-GAC∗ 2996.3484 2996.3484 2996.3484 1.46E−6 2996.3486 50 AIS-GAH 2996.3483 2996.3495 2996.3501 7.45E−3 2996.3599 50 APMbc 2996.3482 2996.3482 3033.8807 1.10E+ 2 3459.0948 19 SR 2996.3483 2996.3488 2996.3491 1.01E−3 2996.3535 50 APMrc 2996.3482 2996.3482 2997.4728 7.87E+ 0 3051.4556 49
Table 3: Values found for the Speed Reducer design
ES-Coello AIS-GA∗ AIS-GAC ∗ AIS-GAH APMbc SR APMrc
x1 3.506163 3.500001 3.500000 3.500001 3.500000 3.500000 3.500000 x2 0.700831 0.700000 0.700000 0.700000 0.700000 0.700000 0.700000 x3 17 17 17 17 17 17 17 x4 7.460181 7.300019 7.300001 7.300008 7.300000 7.300001 7.300000 x5 7.962143 7.800013 7.800000 7.800001 7.800000 7.800001 7.800000 x6 3.362900 3.350215 3.350215 3.350215 3.350215 3.350215 3.350215 x7 5.308949 5.286684 5.286684 5.286683 5.286683 5.286683 5.286683 W 3025.0051 2996.3494 2996.3484 2996.3483 2996.3482 2996.3483 2996.3482
Table 4: Design variables found for the best solutions for the Speed Reducer design
A. LEMONGE, H. BARBOSA, C. BORGES, F. SILVA
9294
l
Fig. 17 Speed Reducer.
1 .5 C la ss ifi ca ti o n o f O p ti m iz at io n P ro b le m s 2 3 w h er e G is the shear mod ulus, F the compressive load on the spring, w the w eigh t of th e sp ri n g , ρ the w eigh t density of th e sp rin g, and Ks th e sh ea r st re ss co rr ec ti o n fa ct o r. Assume that the m aterial is spring steel with G = 1 2 × 1 0 6p si an d ρ = 0 . 3 lb /i n 3, an d the she ar stres s correction factor is Ks ≈ 1 . 0 5 . SOLUTION The d esign v ector is g iven by X x1 x2 x3 = d D N s and the objective function b y f( X ) = weight = π d 2 4 π D N ρ (E1 ) The constraints can be expressed as d efl ec ti o n = F = k 8 FD 3N d 4G ≤ 0 . 1 that is, g1 ( X ) = d 4G 8 0 FD 3N > 1 (E2 ) shear stress = Ks 8 FD 3πd ≤ 1 0 , 0 0 0 N(number of turns)
Fig. 18 Tension/Compression Spring.
References
Alice, S.E., David, C.W., Penalty functions Handbook of Evolutionary Computation, Section C 5.2. Oxford University Press and Institute of Physics Publishing, (1996).
Afonso C.C. Lemongea, Helio J.C. Barbosab, Carlos C.H. Borgesc and Francilene B.S. Silvad., constrained optimization problems in mechanical engineering design using a real-coded steady-state genetic algorithm, Mecanica Computa-cional Vol.XXIX, pages. 9287-9303 (articulo completo), Argentina, 15-18 November (2010).
Bernardino H., Barbosa H., and Lemonge A., A hybrid genetic algorithm for constrained optimization problems in me-chanical engineering. In Proceedings of the 2007 IEEE Congress on Evolutionary Computation,Singapore:IEEE Press, (2007) pp.646-653.
Bernardino H., Barbosa H., Lemonge A., and Fonseca L., A new hybrid AIS-GA for constrained optimization prob-lems inmechanical engineering. In Proceedings of the 2008 IEEE Congress on Evolutionary Computation, Hong Kong:IEEE Press, (2008) pp.1455-1462.
Belegundu, A., A Study of Mathematical Programming Methods for Structural Optimization, PhD thesis, Department of Civil Environmental Engineering, University of Iowa, Iowa, (1982).
Bui, T. Pham, H. Hasegawa, H., Improve self-adaptive control parameters in differential evolution for solving constrained engineering optimization problems. J Comput Sci Technol Vol.7, No.1 (2013), pp.59-74. DOI:10.1299/jcst.7.59. Coello, C.A.C., Use of a self-adaptive penalty approach for engineering optimization problems, Computers in Industry 41
(2000), pp.113-127.
David, H. W. and William, G.M., No Free Lunch Theorems for Optimization, IEEE TRANSACTIONS ON EVOLU-TIONARY COMPUTATION, APRIL, Vol.1, No.1 (1997), pp.68-82.
Dorigo, M., Optimization, Learning, and Natural Algorithms, PhD thesis, Politecnico di Milano, (1992).
El-Abd, M., Generalized opposition-based artificial bee colony algorithm, in 2012 IEEE Congress on Evolutionary Com-putation (CEC), (2012), pp.1-4.
Golinski, J., An Adaptive Optimization System Applied to Machine Synthesis, Mech. Mach. Theory, Vol.8, No.4 (1973), pp.419-436.
Holland J.H., Adaptation in Natural and Artificial Systems, University of Michigan Press, Ann Arbor, Michigan; re-issued by MIT Press (1992).
Huang, F. Wang, L. He, Q., An effective co-evolutionary differential evolution for constrained optimization, Applied Mathematics and Computation 186 (2007), pp.340-356.
He, Q. Wang, L., An effective co-evolutionary particle swarm optimization for constrained engineering design problems, Engineering Applications of Artificial Intelligence Vol.19, No.7 (2006), doi:10.1016/j.engappai.2006.03.003. Karaboga, D. Basturk, B., An artificial bee colony algorithm for numeric function optimization, in Proc. of the IEEE
Swarm Intelligence Symposium May (2006), Indiana, USA, pp.12-14.
Kennedy J, Eberhart R., Particle swarm optimization, [J] IEEE International Conference on Neural Networks Conference Proceedings. Perth, Aust, (1995), pp.1942-1948.
Molga, M. Smutnicki, C., Test functions for optimization needs. (online), available from:
<http://www.zsd.ict.pwr.wroc.pl/files/docs/functions.pdf>, (accessed, 2005).
Rahnamayan, H. Tizhoosh, R. and Salama, M. A., Opposition-Based Differential Evolution Algorithms, in IEEE Congress on Evolutionary Computation, 2006. CEC 2006, (2006), pp.2010-2017.
Ragsdell, K,. and Phillips, D., Optimal Design of a Class of Welded Structures using Geometric Programming, J. Eng. Ind, Vol.98, No.3 (1976), pp.1021-1025.
Rahnamayan, S. Tizhoosh, H. R. and Salama, M. M. A., Opposition-Based Differential Evolution, U.K. Chakraborty (Ed.): Advances in Differential Evolution, SCI 143, (2008), pp.155-171.
Rahnamayan, S. Tizhoosh, H. R. and Salama, M. M. A., A novel population initialization method for accelerating evolu-tionary algorithms, Comput. Math. Appl., Vol.53, No.10 (2007), pp.1605-1614.
Rahnamayan, S. Tizhoosh, H. R. and Salama, M. M. A., Opposition versus randomness in soft computing techniques, Appl. Soft Comput., vol.8, No.2 (2008), pp.906-918.
Storn R. , and Price K., Differential Evolution-A Simple and Efficient Heuristic for Global Optimization over Continuous Spaces, Journal Global Optimization, Vol.11 (1997), pp.341-359.
Shaw, B. Mukherjee, V. and Ghoshal, S. P., A novel opposition-based the gravitational search algorithm for combined economic and emission dispatch problems of power systems, Int. J. Electr. Power Energy Syst., Vol.35, No.1 (2012), pp.21-33.
Saha, S. K. Dutta, R. Choudhury, R. Kar, R. Mandal, D. and Ghoshal, S. P., Efficient and Accurate Optimal Linear Phase FIR Filter Design Using Opposition-Based Harmony Search Algorithm, The Scientific World Journal, vol.2013, Article ID 320489, 16 pages (2013). https://doi.org/10.1155/2013/320489.
Shaw, B. Mukherjee, V. and Ghoshal, S.P., A novel opposition-based gravitational search algorithm for combined eco-nomic and emission dispatch problems of power systems, Int. J. Electr. Power Energy Syst., Vol.35, No.1 (2012), pp.21-33.
Bui , Nguyen and Hasegawa, Journal of Advanced Mechanical Design, Systems, and Manufacturing, Vol.13, No.4 (2019)
Tizhoosh H. R., Opposition-Based Learning: A New Scheme for Machine Intelligence, in International Conference on Computational Intelligence for Modelling, Control and Automation, 2005 and International Conference on Intelligent Agents, Web Technologies and Internet Commerce, Vol.1 (2005) pp.695-701.
Tizhoosh, H.R., Reinforcement Learning Based on Actions and Opposite Actions, presented at the ICGST International Conference on Artificial Intelligence and Machine Learning (AIML-05), Cairo, Egypt, (2005) pp.94-98.
Tooyama, S. Hasegawa, H., Adaptive plan system with genetic algorithm using the variable neighborhood range control. IEEE Congress on Evolutionary Computation, CEC’09. (2009), pp.846-853, DOI:10.1109/CEC.2009.4983033. Sandgren, E., Nonlinear Integer and Discrete Pro-gramming in Mechanical Design Optimization, J.Mech. Des.-T. ASME,
Vol.112, No.2 (1990), pp.223-229.
Ventresca, M. and Tizhoosh, H. R., Improving the Convergence of Backpropagation by Opposite Transfer Functions, in International Joint Conference on Neural Networks, 2006. IJCNN’06, (2006), pp.4777-4784.
Ventresca, M. and Tizhoosh, H. R., Numerical condition of feedforward networks with opposite transfer functions, in IEEE International Joint Conference on Neural Networks, 2008. IJCNN 2008. (IEEE World Congress on Computa-tional Intelligence),(2008), pp.3233-3240.
Ventresca, M. and Tizhoosh, H.R., Opposite Transfer Functions and Backpropagation Through Time, in IEEE Symposium on Foundations of Computational Intelligence, (2007), pp.570-577.
Wang, H. Wu, Z. Rahnamayan, S. Liu, Y. and Ventresca, M., Enhancing particle swarm optimization using generalized opposition-based learning, Inf. Sci., Vol. 181, No. 20 (2011), pp.4699-4714.
Wang, H. Wu, Z. and Rahnamayan, S., Enhanced opposition-based differential evolution for solving high-dimensional continuous optimization problems, Soft Comput., Vol.15, No.11 (2011), pp.2127-2140.