An incremental approach for real-time Big Data visual analytics
Ignacio Garc´ıa, Rub´en CasadoDepartment of Research and Innovation Treelogic
Asturias, Spain
Abdelhamid Bouchachia Machine Intelligence Group
Department of Computing Bournemouth University, UK
Abstract—In the age of Big Data, the real-time interac-tive visualization is a challenge due to latency of executing calculation over terabytes (even, petabytes) datasets. The execution of an operation has to finish before its outcome is displayed, which would be an issue in those scenarios where low-latency responses are required. To address such a requirement, this paper introduces a new approach for real-time visualization of extremely large data-at-rest as well as data-in-motion by showing intermediate results as soon as they become available. This should allow the data analyst to take decisions in real-time.
Keywords-big data, streaming processing, visualization, incremental computation.
I. Introduction
Big Data, an already familiar term, has been gener-ally defined as a massive volume of structured, semi-structured and/or unstructured data, which may not be effectivelzy managed and processed using traditional databases and software techniques. Big Data is com-monly characterized by the 3Vs [1] : volume, velocity, and variety. Volume refers to the size of the data to be processed. Variety refers to the nature and structure of the information that characterize Big Data. Velocity, on the other hand, refers to the high frequency of data generation as well as the evolving dynamics of the data.
There are real-world analytics use cases that are typically identified by the 3Vs requiring scalability, low-latency responses and management of diverse and multi-modal information. Other use cases are geared towards value (the 4th V of big data definition) that indicates the quality and the impact of the data. These two needs are, of course, complementary and this is the reason why the Big Data field has been split in two main areas called Data Engineering and Data Science. A key approach to extract value from data is Visual Analytics. Visual analytics is commonly defined as the science of analytical reasoning facilitated by interactive visual interfaces [2]. It is quite appealing to combine analytics and interactive visualization to cope with the size, complexity, and velocity of data by actively involving the user in the analysis of the data, making
thus this later a lot tractable. A key challenge of visual analytics is to meet the requirements of Big Data in supporting real-time interaction while considering the challenges of volume, velocity and variety. Despite the emerging advances to achieve low latency for ad-hoc queries, it is still necessary to rethink efficient software architecture styles to enable real-time interaction.
The rest of the paper is structured as follows. Section II overviews the state-of-the art of visual analytics for Big Data. Section III describes the proposed approach to achieve interactive visualization for Big Data. Re-sults are discussed in Section IV. Finally, Section V concludes the paper.
II. Background andState-of-the-art
The main objective of data visualization [3] is to rep-resent knowledge more intuitively and effectively by using different graphs. To convey information easily by providing knowledge hidden in the complex and large-scale data sets, both aesthetic form and functionality are necessary. Information that has been abstracted in some schematic forms, in addition to attributes or variables, is also valuable for data analysis. This way is much more intuitive [4] than sophisticated approaches. For Big Data applications, it is particularly difficult to use visualization because of the large size and high dimensionality of data. However, current Big Data visualization tools suffer poor functional performance and lack scalability and efficiency in terms of response time. It is necessary to tackle these problems. Even, Contributing to the effort of developing analytics tools for efficiently dealing with massive datasets and continuous unbounded streams of data visualization issues, the present paper introduces a novel architec-ture using incremental visual methods. The proposed approach should allow analysts and end-users to ex-plore Big Data (both data-at-rest and data-in- motion) faster and help them make important decisions on time. It consists of developing an Incremental Ana-lytics Engine that will sit on top of a distributed big data platform and that use partial results in order of complexity O(1) to provide outcomes.
successful techniques for data-intensive applications such as history mechanisms proposed in [5] require more efficiency.
Big datasets are ubiquitous in many domains, such as finance, discrete manufacturing, monitoring, inter-net, telecommunication, biology or even sports [6]. It is not uncommon that millions of readings from high-frequency sensors are subsequently stored in relational database management systems (RDBMS), to be later accessed using visual data analysis tools. Modern data analysis tools must support a fluent and flexible use of visualizations and still be able to squeeze a bil-lion records into a milbil-lion pixels [6]. In this regard, one challenge for the scientific community is the de-velopment of compact data structures that support algorithms for rapid data filtering, aggregation, and display rendering. These issues are yet unsolved for existing RDBMS-based visual data analytics tools such as Tableau Desktop [7], SAP Lumira [8], QlikView [9], Tibco Spotfire [10] and Datawatch Desktop [11]. While they provide flexible and direct access to rela-tional data sources, they do not consider an automatic, visualization- related data filtering or aggregation and are not able to quickly and easily visualize high-volume historical data. For example they redundantly store copies of the raw data as tool-internal objects, requiring significant amounts of system memory. This causes long response time for the users and even-tually indefinitely in case the system memory is ex-hausted and gets stuck. Apart of commercial solutions, a number of open-source visual toolkits exist (such as InfoVis Toolkit [12], Prefuse [13], Improvise [14] and D3 [15].); each covers a specific set of functionalities for visualization, analysis and interaction. Using exist-ing toolkits instead of implementexist-ing new ones from scratch provides much efficiency [16], although the level of maintenance, development and user commu-nity support of open-source code can vary drastically. The major shortcoming of exiting tools, commercial and open-source, lies in the fact that they are dedi-cated to batch data (data-at-rest), not in data streams (data-in-motion). However, there exist some successful domain-specific tools such as ELVIS [17], that is a highly interactive system to analyze system log data, but cannot be applied to real-time streams. SnortView [18] focuses on the intrusion detection, while Event Visualizer [19] provides real-time visualizations for event data streams for real- time monitoring as well as various exploration mechanisms. On the other hand, authors in [20] propose a real-time visualization system to enhance situational awareness from network traffic data using LiveRAC [21]. Once analyzed and aggre-gated, time-series are displayed in a zoomable tabular interface to enable interactive exploration. Another tool
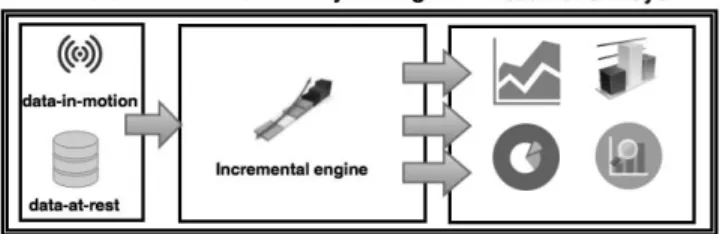
Fig. 1. Incremental analytics engine
which focuses on monitoring of time series data is VizTree [22], [23], that allows to visualize real-time anomaly detection after transforming the time series into symbols.
Compared to existing literature, the approach intro-duced in the present paper aims to deal with: 1) Vi-sualization of data. 2) Enabling real-time interaction with big data-in-motion. To deal with these issues, we propose to build an innovative real-time visual analytics system, capable of addressing the scalability issues. Such a system is designed, implemented and integrated into Apache Flink [24] providing novel in-cremental visual methods. Inin-crementality here means to not process the whole dataset at once, but to split a dataset into small data chunks and process them, allowing users to obtain partial approximated results in real time instead of waiting until the process ends. The reason of choosing Apache Flink is its superiority compared to other Big Data streaming engines such as Apache Spark and Apache Storm in terms of low latency, fault- tolerance, flexible stream handling (win-dowing), and high throughput [24]. This approach will allow both expert as well as users (analysts) to explore Big Data (both data-at-rest and data- in-motion) faster to make well-informed decisions on time.
The obtained results are discussed in Section IV. III. Incremental approach
We propose an incremental multilayered architecture based on three main components (see Figure 1): Data Collector, Incremental analytics engine and Visualiza-tion Layer.
The Data Collector is in charge of continuously getting new data from data sources and sending them to the next processing layer. The Incremental Analytics Engine processes data using the online incremental algorithms and outputs up-to- date results which are then visualized by the third layer. The visualization of the results at various time points allows the users to track and interact with those results in real-time. A. Data Collector
This module is in charge of continuously collecting new stream data points from the data sources. As
soon as a data chunk (window) becomes available, it is sent the next layer to cope with the high velocity of the stream. The process of data collection is done incrementally in line with the approach we propose. B. Incremental Analytics Engine
The incremental analytics engine processes data in-crementally, mostly using the concepts of recursivity and approximation. The algorithmic processing of each batch will lead to results that are communicated to the next layer for visualization.
for (double value in values ) { avg += value ;
avg = avg / values . length ; }
end(avg );
Fig. 2. Traditional average computation
Online incremental analytics algorithms can range from simple statistical moments (e.g., average, median, sum, max, min, etc.) to advanced machine learning and data mining algorithms such classifiers and clustering algorithms. For instance, Figure 2 depicts how the average of streaming data points is calculated with a traditional approach.
In order to send the final result to the visualization layer, the offline AVG computation needs to wait until all the data points are processed. Instead, Figure 3 summarizes a naive online version of the AVG compu-tation. This version depicts a poor implementation of the incremental average, since a new result is sent for each new element processed leading to communication overhead. In addition, it assumes that only one partial result (e.g. there is no avg for each different key) is generated and the whole computation occurs in a single node (no distributed architecture). As explained earlier in section III-A, input data are partially received and then processed chunk-wise.
for (double value in values ){ avg += value ;
cont = cont +1 send (avg/cont ); }
Fig. 3. Incremental average calculation
To realize the incrementallity in an efficient way, we make use of mechanisms offered by big data streaming engines. These later introduce concepts such as win-dowing that splits data streams into finite sequence of data points. By using windows, it is possible to execute aggregations on unbounded data streams. We process
data in windows of size N (denoted asWINDOW SIZEin Figure 4) to generate a partial result. When a window is filled, it automatically calls to theapply(...)method that initiates the computation for that window. Ev-ery incremental operation executed over the window needs the result of the previous one to successfully calculate the new average. Normally it is necessary to save not only the new average, but also the number of windows used for calculating that partial result. That information is called state.
Figure 5 of code summarizes the normal flow for stream processing in Apache Flink, using the win-dow concept: TheIncrementalOperation()class
pro-DataStream dataStream = stream . keyBy ("key")
. countWindow ( WINDOW_SIZE )
. apply (new IncrementalOperation ()) . addSink (new WebsocketSink ());
Fig. 4. Flink average calculation
vides the logic necessary to calculate approximated results, window by window. As an example of in-cremental operation, Figure 5 shows the schema of
IncrementalAverageOperation implementation of its
apply (...)function.
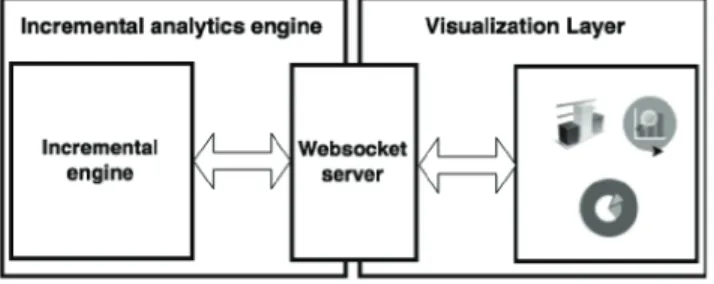
As incremental operations continuously send results to the visualization layer, a continuous and full-duplex communication between the incremental analytics en-gine and the visualization layer is required. For this reason, we have decided to use Websockets [25]. Web-socket is a protocol providing full-duplex communi-cation channels over a single TCP connection. It is an independent TCP-based protocol and it is designed to be implemented in web browsers and web servers, but it can be used by any client or server application. We will use Websocket protocol (ws://) instead of HTTP or other application protocols because these do not provide bidirectional communication (in a normal web scenario, architectures are based on request-response protocols like HTTP).
When a window computation ends, DataStream
class automatically calls the invoke() method of the
WebsocketSink class, which is in charge of sending results to the visualization layer. Figure 6 depicts how incremental analytics engine and visualization layer are connected. Once a partial result is computed, it is sent to the websocket server and then to the visualiza-tion layer.
C. Visualization Layer
This layer is a web-based library that allows users to real-time graphically visualize results of incremental
ValueState state = getRuntimeContext (). getState ();
double[] values = getWindowValues ();
// calculate new avg using the new elements // and the previous result
double actualAVG = calculate (state , values );
// Update window state with new values
updateWindowState (state , actualAVG );
// Send partial result to WebsocketSink
collector . collect ( actualAVG );
Fig. 5. Flink average calculation
operations carried out by the incremental analytics enginelayer. Visualizations are performed using a set of minimalist graphs that visualization layer provides such as line, bar, pie or stream graphs are some of the basic visualization elements available in this library. All of the components of the visualization layer have been developed using Javascript, since it is the de facto programming language for creating interactive applications on the web.
Like all modern programming languages, Javascript is implemented following a certain scripting language specifications. Ecmascript6 (commonly known as ES6) is the latest Javascript specification language which we use for developing the visualization layer. ES6 is not fully supported by all the modern browsers yet, but they are tending to implement the most of its features, such as arrow functions, class orienting, modulating, etc.
This layer continuously receives partial results from the incremental analytics engine layer. To successfully implement this functionality, we need two core com-ponents: 1) A websocket connector that receives the results from the incremental analytics engine layer. 2) A graph library that contains the basic graphical elements used to visualize data.
Fig. 6. Real-time incremental communication
1) Websocket Connector: Websocket is a technology [26], based on the websocket protocol ws [25], that makes it possible to establish a continuous full-duplex
connection stream between a client and a server. Although the ws protocol is platform independent, clients are typically based on web browsers. The visualization layer provides a Javascript websocket connector that enables a bidirectional communication between web-browsers and the WebsocketSink com-ponent developed and explained in Section III-B. This connector is in charge of receiving and sending data and acts as a proxy between the visualization and the analytics layers.
2) Graph Library: Our graph library is a visualiza-tion tool that allows users to real-time visualize data. This library has been built using the Scalable Vector Format (SVG) as the format to show data to users. SVG is a language for describing two-dimensional graphics in XML format. It allows for three types of graphics objects: vector graphic shapes, images and text. Graphical object can be grouped, transformed and composited into previously rendered objects. It also includes nested transformations, clipping paths, alpha masks, filter effects and template objects [27]. After analyzing other graphic technologies such as Canvas [28] or WebGL [29], we opted for SVG due to its simplicity and easy user-interaction API. To deal with SVG API and facilitate the graph creation, we have built the library on top of D3.js [30]. D3.js is a Javascript [31] library for manipulating documents based on data. D3.js provides the full capabilities of modern browsers and is developed using data-driven approach to DOM manipulation [30].
IV. Results
In order to evaluate our approach, two incremental functions have been implemented: average (AVG) and maximum (MAX). These functions calculate approxi-mate results by taking data chunks and accumulating partial results for next iterations (see section III-B).
For this experiment we have chosen three sample datasets in CSV format. These datasets contain data obtained from a set of different air quality sensors placed in Asturias, a region of the north-west of Spain. These sensors emit, every minute, a data register that contains the current date in ISO format [32], latitude and longitude of the sensor and the value of chem-ical compounds such as O3 (ozone) and SO2 (sulfur dioxide), measured in μg/m3.
The experiment consists of incrementally calculating the maximum and mean value for a specific chemical compound (O3) and calculate the time it takes to get all the partial results in an interval in which margin of error is less than 5% regarding the real value, as well as the time taken to process the entire dataset. To carry out the experiment we have taken different file sizes for the datasets: 1GB, 8GB and 15GB, all of them with
Table I
Average and maximum computation results
Final Computation(s) ≤5%(s) 1GB 8GB 15GB 1GB 8GB 15GB Avg Conv 11,6 113,1 232,1 - - -Inc 14,1 118 230,2 1,78 1,58 1,58 Max Conv 9,3 114 242 - - -Inc 10,2 126 235,4 1,622 1,45 2,114
a standard window size (WINDOW SIZE) of 100 stream data points.
For traditional computations, results only show the time taken to process the entire datasets, whilst for re-sults of the incremental version show the time needed to obtain values with a margin of error less than 5% (without processing the entire dataset), as well as the final computation time. We used a quad-core processor (IntelR Core TM I5-4460 3.20 GHz) with 8GB RAMandUbuntu 14.04.1 LTS.
As Table I depicts, the time taken by incremental (Inc. row) and conventional (Conv. row) methods for calculating the final result is very similar, remaining the complexity of both algorithms to O(N) (whereNis the total number of data points). The main advantage of the incremental approach is the capability it has to provide partial and approximate results without needing to process the entire dataset, unlike traditional computation methods that output the final result after processing the whole dataset. Incremental methods show reliable results (≤5%) 100 times faster than tra-ditional ones, which is ideal for those scenarios where short response time is required. The main drawback is that there is a penalization for the final result in the incremental computation, and it is not completely exact (due to incremental operations can lose decimal precision in iterative operations).
V. Conclusions andFutureWork
Despite significant effort made to real-time process and visualize data, it is still challenging to deal with large datasets of terabytes or petabytes items. Big Data technologies provide mechanisms to process data in a distributed manner, but algorithms complexity remains depending on the number of data records.
Our incremental approach provides a solution with complexity O(1). The main benefit of this approach is that end-users do not need to wait until the Big Data process ends. They can visualize approximate results. This is very useful for those scenarios in which a Big Data process takes so long. Furthermore, incremental
operation can predict final range values by just analyz-ing a part of data, because some incremental operation like average tends to stabilize after analyzing a portion of data.
As a future work it would be interesting to imple-ment more complex increimple-mental operations such as variance, standard deviation or coefficient of variation. The incremental analytics engine layer provides an API that easily allows developers to add new incremen-tal operations. Furthermore, it will be interesting to analyze the possible non-commutative operations and the applicability that incremental algorithms have to calculate not only incremental results over stationary data, but also to detect data anomalies, a scenario in which results can vary and do not converge to a stable value.
Acknowledgment
The research leading to these results has received funding from the European Union (Horizon 2020, Ref: 687691), under the research project PROTEUS: Scalable Online Machine Learning for Predictive Analytics and Real-Time Interactive Visualization.
References
[1] R. Casado and M. Younas, “Emerging trends and technologies in big data processing,” Concurrency and Computation-Practice & Experience, vol. 27, no. SEPTEMBER 2014, pp. 2078–2091, 2015. [Online]. Available:<Go to ISI>://WOS:000353351800018 [2] J. J. Thomas and K. a. Cook, “Illuminating the path: The
research and development agenda for visual analytics,” IEEE Computer Society, vol. 54, no. 2, p. 184, 2005. [3] D. Keim, C. Panse, M. Sips, and S. North, “Visual Data
Mining in Large Geospatial Point Sets,”IEEE Computer Graphics and Applications, vol. 24, no. 5, pp. 36–44, 2004. [4] D. Simeonidou, R. Nejabati, G. Zervas, D. Klonidis, A. Tzanakaki, and M. J. O’Mahony, “Dynamic optical-network architectures and technologies for existing and emerging grid services,”Journal of Lightwave Technology, vol. 23, no. 10, pp. 3347–3357, 2005.
[5] J. Heer, J. D. Mackinlay, C. Stolte, and M. Agrawala, “Graphical histories for visualization: Supporting anal-ysis, communication, and evaluation,” in IEEE Trans-actions on Visualization and Computer Graphics, vol. 14, no. 6, 2008, pp. 1189–1196.
[6] J. Davey, F. Mansmann, J. Kohlhammer, and D. Keim, “Visual analytics: Towards intelligent interactive inter-net and security solutions,” Lecture Notes in Computer Science (including subseries Lecture Notes in Artificial In-telligence and Lecture Notes in Bioinformatics), vol. 7281 LNCS, pp. 93–104, 2012.
[7] Anonymous, “Tableau Software; Free Tableau Reader Enables Organizations and Analysts to Share the Power of Visual Analysis,”Computer Weekly News, p. 144, 2008.
[8] S. Lumira, “Visualize your data with SAP Lumira.” [Online]. Available: http://saplumira.com/
[9] QLikeView, “QLikeView.” [Online]. Available: http://www.qlik.com/products/qlikview
[10] T. Spotfire, “TibcoSpotfire.” [Online]. Available: http://spotfire.tibco.com/
[11] Datawatch, “Datawatch Desktop.” [Online]. Available: http://www.datawatch.com/our-products/
[12] J. D. Fekete, “The InfoVis Toolkit,” inProceedings - IEEE Symposium on Information Visualization, INFO VIS, 2004, pp. 167–174.
[13] J. Heer, S. K. Card, and J. a. Landay, “Prefuse: a Toolkit for Interactive Information Visualization,” Proceedings of the SIGCHI conference on Human factors in computing systems - CHI ’05, p. 421, 2005.
[14] C. Weaver, “Building Highly-Coordinated Visualiza-tions in Improvise,” IEEE Symposium on Information Visualization, pp. 159–166, 2004.
[15] M. Bostock, V. Ogievetsky, and J. Heer, “D3 data-driven documents,”IEEE Transactions on Visualization and Com-puter Graphics, vol. 17, no. 12, pp. 2301–2309, 2011. [16] D. a. Keim, F. Mansmann, J. Thomas, and D. Keim,
“Visual Analytics : How Much Visualization and How Much Analytics ?”ACM SIGKDD Explorations Newslet-ter, vol. 11, no. 2, pp. 5–8, 2010.
[17] C. Humphries, N. Prigent, C. Bidan, and F. Majorczyk, “ELVIS: Extensible Log VISualization,” in Proceedings of the Tenth Workshop on Visualization for Cyber Security, 2013, pp. 9–16. [Online]. Available: http://doi.acm.org/10.1145/2517957.2517959
[18] H. Koike and K. Ohno, “SnortView: visualization sys-tem of snort logs,”Conference on Computer and Commu-nications Security, p. 143, 2004.
[19] F. Fischer, F. Mansmann, and D. a. Keim, “Real-time visual analytics for event data streams,”Proceedings of the 27th Annual ACM Symposium on Applied Computing -SAC ’12, p. 801, 2012.
[20] D. M. Best, S. Bohn, D. Love, A. Wynne, and W. a. Pike, “Real-time visualization of network behaviors for situa-tional awareness,”Proceedings of the Seventh International Symposium on Visualization for Cyber Security - VizSec ’10. ACM., pp. 79–90, 2010.
[21] P. McLachlan, T. Munzner, E. Koutsofios, and S. North, “LiveRAC : Interactive Visual Exploration of System Management Time-Series Data,” Human Factors, pp. 1483–1492, 2008.
[22] J. Lin, E. Keogh, and S. Lonardi, “Visualizing and Discovering Non-Trivial Patterns In Large Time Series Databases,” Information Visualization, vol. 4, no. 2, pp. 61–82, 2005.
[23] J. Lin, E. Keogh, S. Lonardi, J. P. Lankford, and D. M. Nystrom, “Visually mining and monitoring massive time series,”Proceedings of the 2004 ACM SIGKDD inter-national conference on Knowledge discovery and data mining - KDD ’04, p. 460, 2004.
[24] Apache Software Foundation, “Apache Flink,” Apache.Org, 2015.
[25] I. Hickson, “The websocket api,” 2010. [26] ——, “The websocket api,” 2010.
[27] W3C SVG Working Group, “Scalable Vector Graphics (SVG),” http://www.w3.org/TR/SVG/, vol. 1, no. February 2007, 2011. [Online]. Available: http://www.w3.org/TR/SVG/
[28] O. Whatwg.org, “The Canvas Element,” 2011. [Online]. Available: http://www.whatwg.org/specs/ web-apps/current-work/multipage/the-canvas-element.html [29] C. Marin, “WebGL Specification,”
Tech. Rep., 2011. [Online]. Available: https://www.khronos.org/registry/webgl/specs/1.0/
[30] M. Bostock, V. Ogievetsky, and J. Heer, “D3 data-driven documents,”IEEE Transactions on Visualization and Com-puter Graphics, vol. 17, no. 12, pp. 2301–2309, 2011. [31] D. Flanagan, JavaScript: The Definitive Guide, 2006, no.
January 1997.
[32] M. Wolf and C. Wicksteed, “Date and time formats,” W3C NOTE NOTE-datetime-19980827, no. September 1997, pp. 12–13, 1997. [Online]. Available: http://www.w3.org/TR/NOTE-datetime