4579
J. Dairy Sci. 97 :4579–4593
http://dx.doi.org/ 10.3168/jds.2013-7530
© American Dairy Science Association®, 2014 .
ABSTRACT
The intensification process of the livestock sector has been characterized in recent decades by increasing output of product per hectare, increasing stocking rate, including more concentrated feed in the diet, and im-proving the genetic merit of the breeds. In dairy farm-ing, the effects of intensification on the environmental impact of milk production are not completely clarified. The aim of the current study was to assess the envi-ronmental impacts of dairy production by a life cycle approach and to identify relations between farming intensity and environmental performances expressed on milk and land units. A group of 28 dairy farms lo-cated in northern Italy was involved in the study; data collected during personal interviews of farmers were analyzed to estimate emissions (global warming poten-tial, acidification, and eutrophication potentials) and nonrenewable source consumption (energy and land use). The environmental impacts of milk production obtained from the life cycle assessment were similar to those of other recent studies and showed high variabil-ity among the farms. From a cluster analysis, 3 groups of farms were identified, characterized by different lev-els of production intensity. Clusters of farms showed similar environmental performances on product basis, despite important differences in terms of intensification level, management, and structural characteristics. Our study pointed out that, from a product perspective, the most environmentally friendly way to produce milk is not clearly identifiable. However, the principal compo-nent analysis showed that some characteristics related to farming intensification, such as milk production per cow, dairy efficiency, and stocking density, were nega-tively related to the impacts per kilogram of product, suggesting a role of these factors in the mitigation strategy of environmental burden of milk production on a global scale. Considering the environmental burden on a local perspective, the impacts per hectare were positively associated with the intensification level.
Key words: milk production , intensive farming , envi-ronmental impact , life cycle assessment
INTRODUCTION
In recent decades, the European livestock sector has shown a general trend toward enlarging farm size and increasing intensification in terms of output per hect-are. The intensification of production is generally char-acterized by increasing stocking rate, including more concentrated feed in the diet and improving the genetic merit of the breeds (Alvarez et al., 2008). Such evolu-tion has also affected the Italian dairy sector, which has shown a strong decrease in the total number of dairy cows over the last 30 yr (from 2.6 million in 1980 to 1.6 million presently) and an increase in the number of cows per farm (from 7.9 to 31.8 in the same period; ISTAT, 2012). Furthermore, in northern Italy, favor-able climatic and infrastructure conditions have led to a very high livestock concentration with a consequent intensive utilization of natural resources (i.e., land, air, water) and high environmental pressure. Intensification of livestock production systems is generally considered detrimental from an environmental point of view. A study from New Zealand (Basset-Mens et al., 2009) showed that increasing the number of cows per land unit (with higher N-fertilization and more land used to grow maize for silage instead of permanent grass) reduced dairy farm eco-efficiency in terms of both milk production and land use functions. Penati et al. (2011), assessing environmental sustainability of a group of alpine dairy farms, found that the best environmental performances were obtained by the farms character-ized by low stocking density, low production intensity, high feed self-sufficiency, and large land availability in the valley floor. But other results from the literature showed some positive effects of the intensification of livestock production in terms of environmental impact mitigation. A review study by Crosson et al. (2011) concluded that increased output per hectare obtained through intensification can reduce emissions per kilo-gram of product. Kristensen et al. (2011) identified herd efficiency and farming intensity as relevant strategies for environmental impact reduction. Yan et al. (2013)
How can farming intensification affect the
environmental impact of milk production?
L. Bava , A. Sandrucci ,10=XFDOL0*XHUFLDQG$7DPEXULQL'LSDUWLPHQWRGL6FLHQ]H$JUDULHH$PELHQWDOL8QLYHUVLWjGHJOL6WXGLGL0LODQR9LD&HORULD0LODQR,WDO\
Received September 27, 2013. Accepted March 16, 2014.
4580 %$9$(7$/
Journal of Dairy Science Vol. 97 No. 7, 2014
found that, as milk production increases, a mitigation of environmental impact is observed. Casey and Holden (2005) suggested that, to improve the environmental efficiency of dairy farms, a move toward fewer cows producing more milk at lower stocking rates is required. This represents an extensification in terms of area but an intensification in terms of animal husbandry sys-tems.
Life cycle assessment (LCA) is a generally accepted method for estimating the environmental impact of ag-ricultural products on a global perspective. The main environmental effects quantified in LCA studies on dairy systems are the acidifying and eutrophic effects on watercourses, the global warming effect, and the utilization of resources such as land and nonrenewable energy during the production of milk (O’Brien et al., 2012).
Even if climate change is a global issue, for envi-ronmental aspects with a local connotation (especially acidification and eutrophication), environmental impact should be evaluated not only per unit of product but also per hectare of land. In particular, eutrophication pertains directly to the leaching and run-off of nitrate and phosphate to the ground and surface water; there-fore, this parameter contains a local aspect (Oudshoorn et al., 2011). Many authors showed significantly worse environmental performances of the intensive livestock systems when the impacts were expressed in terms of land unit (Haas et al., 2001; Casey and Holden, 2005).
The first objective of the current study was to analyze the environmental performances of a sample of dairy farms, both on a global and on a local perspective, through an LCA approach. The second objective was to identify the relation between environmental impacts and main farm characteristics, focusing in particular on farming intensity.
MATERIALS AND METHODS
System Description and Data Collection
A group of 28 dairy cattle farms were involved in the current study. All the farms were located in northern Italy and were members of a cheese factory producing Grana Padano. All cows were Italian Holstein kept in permanent confinement without pasture. This rearing system is the most commonly used in the north of Italy.
Data were collected through personal interviews of farmers. Questions were addressed to obtain precise in-formation about cropping systems and field operations, fuel consumption, number of animals and housing sys-tems, and manure storage and animal rations. More-over, data regarding the inputs entering the farms were acquired, including amount of purchased feeds (both
roughages and concentrates), fertilizers and pesticides, bedding materials, and number and origin of purchased replacement animals.
In each farm, forages (hays and silages) and TMR were sampled and analyzed for the content of DM ash, CP, ether extract, and crude fiber by AOAC Interna-tional (1995) methods; starch by AOAC InternaInterna-tional (1998) methods; NDF analyzed following the protocol of Mertens (2002); and ADF and ADL by the method of Van Soest et al. (1991). Data obtained from the anal-yses were used for the estimation of digestibility of the feeding rations. The amount of milk produced by each farm was provided by the cheese factory, whereas the amount of meat (as animal liveweight) was estimated on the basis of the number of animals sold for slaughter and their liveweight declared by the farmers.
Composition of concentrated feed was estimated on the basis of the raw materials reported on the com-mercial labels using CPM-Dairy Ration Analyzer Beta V3 software (Cornell-Penn-Miner, 2004). Table 1 sum-marizes the inventory of the most important data used for impact assessment. All the data are expressed as the average value of the 28 dairy farms.
The income over feed cost (IOFC) was used as
eco-nomic indicator of farm profitability, as proposed by Hutjens (2007), and it was calculated as the income from milk minus feeding costs (self-produced and pur-chased feed) per cow per day.
Emission Estimation
Greenhouse Gas Emissions On Farm. Table 2 shows the models used for on-farm greenhouse gas emission (GHG) estimation. Methane (CH4) emissions from livestock enteric fermentations were estimated us-ing an equation from Ellis et al. (2007). To convert the energy of enteric methane in kilograms of methane emitted, the factor 55.65 MJ/kg of CH4 (IPCC, 2006a) was used. Methane emissions from manure manage-ment were estimated using the Tier 2 method suggested by the Intergovernmental Panel on Climate Change (IPCC, 2006a). Volatile solid excretion was estimated considering gross energy of the diets (kJ/kg of DM) evaluated using an equation of Ewan (1989). Digestibil-ity of the feed was estimated using a calculation model developed for each type of forage and concentrate feed on the basis of the equation proposed by INRA (2007). Feed nutritional characteristics were obtained from the laboratory analyses.
In the current study, animal nitrogen excretion was estimated as proposed by the IPCC (2006a) Tier 2 method considering the nitrogen intake (on the basis of CP% of the diet) minus the nitrogen retained by the animals and excreted with milk. Nitrous oxide (N2O)
Journal of Dairy Science Vol. 97 No. 7, 2014
285,1'8675<72'$< 4581
emissions from manure storages occurred in direct and indirect forms, and in both cases they were estimated using the Tier 2 method from IPCC (2006a). Direct and indirect N2O losses from fertilizer application were estimated following the Tier 2 and Tier 1 methods sug-gested by IPCC (2006b), respectively; the amount of nitrogen applied to the soils from synthetic fertilizers and from manure (slurry and solid) plus the nitrogen from crop residues were accounted for in the estimation.
Carbon dioxide (CO2) emissions from fuel
combus-tion were estimated on the basis of fuel consumpcombus-tion of each farm. Emissions occurring during field operations (i.e., plowing, harrowing, sowing, harvesting, and so on) were estimated using the processes of the Ecoinvent (2007) database; whereas, for other fuel consumptions (i.e., use for feeding mixer), the emission factor used was 3.12 kg of CO2/kg of diesel, as proposed by Nem-ecek and Kägi (2007). Emissions from livestock respira-tion and the variarespira-tion in soil carbon stocks were not accounted for.
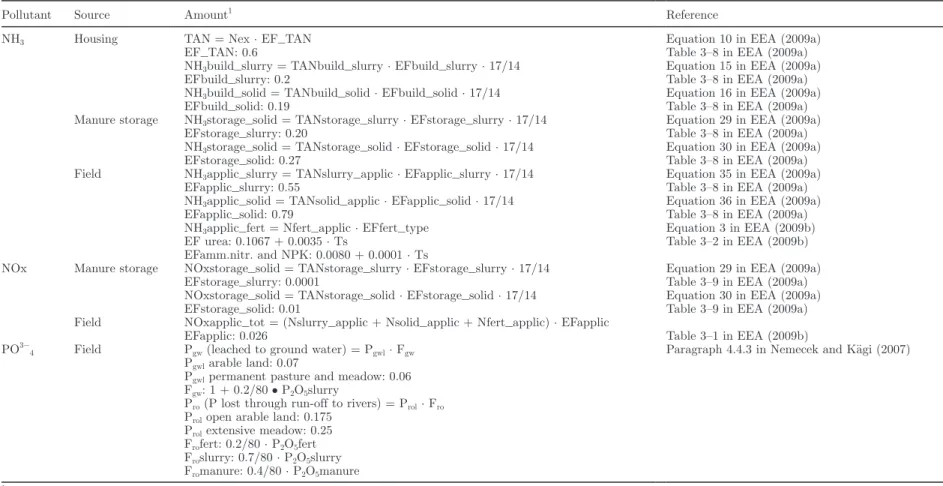
Other Emissions On Farm. Table 3 reports the models used for the estimation of acidifying and
eu-trophic substances emitted on farm. Ammonia (NH3)
and nitrogen oxide (NOx) emissions that occur during animal housing, manure storage, and spreading were estimated following the method proposed by the Eu-ropean Environment Agency (EEA. 2009a,b) on the basis of the total amount of nitrogen excreted by the animals. The Tier 2 method used a mass flow approach
based on the concept of a flow of total ammonia ni-trogen through the manure management systems. The
NH3-N and NOx emission factors, as a proportion of
total ammonia nitrogen, were specific for each manure type (slurry or solid) and each step in manure handling
(EEA, 2009a). The NH3 and NOx emitted during
ma-nure spreading and application of synthetic fertilizers were estimated following EEA (2009b) guidelines. The amount of nitrogen leached was estimated following the IPCC (2006b) model (Table 2). To estimate emissions of PO4
3-, the amount of phosphorus lost in dissolved form to surface water (run-off) and leached was consid-ered as proposed by Nemecek and Kägi (2007).
Off-Farm Processes. The emissions related to off-farm activities were calculated using LCA software, Simapro PhD 7.3.3 (PRé Consultants, 2012), and were modeled using the databases reported in Table 4. The processes considered included the production chain of commercial feed (from crop growing to feed factory processing), production of purchased forages and bed-ding material, rearing of purchased replacing heifers, production of chemical fertilizers and pesticides, and diesel and electricity used in the farms. Transportation was accounted for only in feed, bedding materials, and purchased replacement animals.
As farms bought a quota of their replacement heif-ers, a simplified LCA was performed to assess the im-pacts associated to heifer rearing, considering animals sold at 24 mo of age, average feed intake, average diet Table 1. Inventory data (average of the 28 farms)
Item Unit Mean SD Minimum Maximum
Land
Farm land ha 40.7 27.8 8.5 120
Permanent grassland % land 52.1 23.8 12.9 100
Maize land for silage % land 36.5 20.3 0.0 87.1
NEL yield MJ/ha 74,965 20,924 34,901 134,248
Nitrogen yield kg/ha 180 38.2 103 238
N synthetic fertilizers kg/ha 84.3 51.1 0.0 202 Pesticides (active substances) g/ha 791 614 0.0 1,849
Herd
Dairy cows n 90.3 52.0 17.0 195
Livestock unit (LU) n 143 86.7 25.7 308
Milk production kg of FPCM1/cow per day 27.1 4.3 18.1 35.4
Production intensity kg of FPCM/ha 19,764 7,955 12,005 46,455 Meat production2 kg/farm per year 130 45.6 53.1 223
Manure type
Solid manure % 40.3 38.0 0.0 100.0
Liquid slurry % 59.7 38.0 0.0 100.0
Feed
Feed produced on farm t of DM/LU per year 3.8 1.2 1.6 6.5 Purchased forages t of DM/LU per year 0.3 0.4 0.0 1.4 Purchased concentrates t of DM/LU per year 1.7 0.7 0.4 3.0
Energy
Diesel use kg/LU per year 88.6 21.3 54.0 141
Electricity use KWH/LU per year 211 79.9 52.3 336
1FPCM = fat- and protein-corrected milk. 2
4582 %$ 9 $ (7 $/
Journal of Dairy Science V
ol. 97 No. 7, 2014
Table 2. Models and emission factors (EF) used for the estimation of greenhouse gas emissions on farm
Pollutant Source Amount1 Reference
CH4 Enteric CH4 (MJ) = 2.16 (±1.62) + 0.493 (±0.192) · DMI (kg) − 1.36 (±0.631) · ADF (kg)
+ 1.97 (±0.561) · NDF (kg)
Ellis et al. (2007)
Manure storage CH4 = VS × B0 · 0.67 · MCF/100 · MS Equation 10.23 in IPCC (2006a)
VS = [GE · (1 − DE/100) + (UE · GE)] · [(1 − Ash)/18.45] Equation 10.24 in IPCC (2006a)
GE (kJ) = 17,350 + (234.46 · EE%) + (62.8 · CP%) − (184.22 · Ash %) Ewan (1989)
DE: feed digestibility INRA. 2007
MCF solid storage: 4 IPCC (2006a)
MCF liquid slurry: 17 MCF pit storage: 27
N2O direct Manure storage N2O = Nex · MS · EF · 44/28 Equation 10.25 in IPCC (2006a)
Nex = Nintake · (1 − N retention) Equation 10.31 in IPCC (2006a)
N intake: DMI · (CP %/100/6.25)
N retention: N retained per animal with milk and weight gain Equation 10.33 in IPCC (2006a)
EF solid storage: 0.005 (0.0027 − 0.01) Table 10.21 in IPCC (2006a)
EF liquid slurry: 0.005 EF pit storage: 0.002
Field N2O = (Nsn + Non + Ncr) · EF · 44/28 Equation 11.2 in IPCC (2006b)
Non: annual amount of N from managed animal manure applied to soil (Nex − Frac_loss + N bedding) Equation 10.34 in IPCC (2006a)
Frac_loss solid storage: 40% (10 − 65) Table 10.23 in IPCC (2006a)
Frac_loss liquid slurry: 40% (15 − 45) Frac_loss pit storage: 28% (10 − 40)
EF: 0.01 (0.003 − 0.03) Table 11.1 in IPCC (2006b)
N2O indirect Manure storage N2OG = N volatilization · EF · 44/28 Equation 10.27 in IPCC (2006a)
Nvolatilization: Nex · MS · Frac_GasMS/100
Frac_GasMS solid storage: 30 (10 − 40) Table 10.22 in IPCC (2006a)
Frac_GasMS liquid slurry: 40 (15 − 45) Frac_GasMS pit storage: 28 (10 − 40)
EF: 0.01 (0.002 − 0.05) Table 11.3 in IPCC (2006b)
Field N2O(ATDN) = [(Nsn · Frac_GasF) + (Non · Frac_GasM)] · EF · 44/28 Equation 11.9 in IPCC (2006b)
Frac_GasF: 0.1 (0.03 − 0.3) Table 11.3 in IPCC (2006b)
Frac_GasM: 0.2 (0.05 − 0.5) Table 11.3 in IPCC (2006b)
EF: 0.01 (0.002 − 0.05) Table 11.3 in IPCC (2006b)
N2O(L) = (Nsn + Non) · Frac_Leach · EF · 44/28 Equation 11.10 in IPCC (2006b)
Frac_Leach: 0.3 (0.1 − 0.8)
EF: 0.0075 (0.0005 − 0.025) Table 11.3 in IPCC (2006b)
CO2 Field operations Ecoinvent (2007)
Diesel combustion2 CO
2 = kg diesel · EF Nemecek and Kägi (2007)
EF: 3.12 kg of CO2/kg of diesel
1VS = daily volatile solid excreted (kg of DM /animal); B
0 = maximum methane-producing capacity for manure (m3); MCF = methane conversion factors for each given manure
management system (%); MS = fraction of livestock manure handled using each given manure management system (dimensionless); GE = gross energy intake (MJ/ d); DE% = energy digestibility of feed (%); (UE · GE) = urinary energy expressed as fraction of GE (dimensionless); EE% = ether extract of feed (% DM); Nex = annual N excretion (kg of
N/animal); EF = emission factor for direct N2O emissions from a given manure management system (kg of N2O-N/kg of N in manure management system); Nsn = annual amount
of synthetic fertilizer N applied to soils (kg of N); Non = annual amount of animal manure, compost, sewage sludge and other organic N additions applied to soils (kg of N); Ncr = annual amount of N in crop residues (above and below ground), including N-fixing crops, and from forage/pasture renewal, returned to soils (kg of N); Frac_loss = fraction of managed manure N that is lost in a given manure management system (%); N_bedding = annual amount of N from bedding (kg of N/animal); N volatilization = annual amount of
manure N that is lost due to volatilization of NH3 and nitric oxide compounds (NOx; kg of N); Frac_GasMS = fraction of managed manure N that volatilizes as NH3 and NOx in a
given manure management system (%); Frac_GasF = fraction of synthetic fertilizer N that volatilizes as NH3 and NOx (% ); Frac_GasM = fraction of applied organic N fertilizer
materials and of urine and dung N deposited by grazing animals that volatilizes as NH3 and NOx (%); Frac_Leach = N fraction lost through leaching and runoff (%).
Journal of Dairy Science V ol. 97 No. 7, 2014 285,1'8675 < 7 2'$ < 4583
Table 3. Models and emission factors (EF) for the estimation of ammonia, nitric oxide, and phosphate emissions on farm
Pollutant Source Amount1 Reference
NH3 Housing TAN = Nex · EF_TAN Equation 10 in EEA (2009a)
EF_TAN: 0.6 Table 3–8 in EEA (2009a)
NH3build_slurry = TANbuild_slurry · EFbuild_slurry · 17/14 Equation 15 in EEA (2009a)
EFbuild_slurry: 0.2 Table 3–8 in EEA (2009a)
NH3build_solid = TANbuild_solid · EFbuild_solid · 17/14 Equation 16 in EEA (2009a)
EFbuild_solid: 0.19 Table 3–8 in EEA (2009a)
Manure storage NH3storage_solid = TANstorage_slurry · EFstorage_slurry · 17/14 Equation 29 in EEA (2009a)
EFstorage_slurry: 0.20 Table 3–8 in EEA (2009a)
NH3storage_solid = TANstorage_solid · EFstorage_solid · 17/14 Equation 30 in EEA (2009a)
EFstorage_solid: 0.27 Table 3–8 in EEA (2009a)
Field NH3applic_slurry = TANslurry_applic · EFapplic_slurry · 17/14 Equation 35 in EEA (2009a)
EFapplic_slurry: 0.55 Table 3–8 in EEA (2009a)
NH3applic_solid = TANsolid_applic · EFapplic_solid · 17/14 Equation 36 in EEA (2009a)
EFapplic_solid: 0.79 Table 3–8 in EEA (2009a)
NH3applic_fert = Nfert_applic · EFfert_type Equation 3 in EEA (2009b)
EF urea: 0.1067 + 0.0035 · Ts Table 3–2 in EEA (2009b)
EFamm.nitr. and NPK: 0.0080 + 0.0001 · Ts
NOx Manure storage NOxstorage_solid = TANstorage_slurry · EFstorage_slurry · 17/14 Equation 29 in EEA (2009a)
EFstorage_slurry: 0.0001 Table 3–9 in EEA (2009a)
NOxstorage_solid = TANstorage_solid · EFstorage_solid · 17/14 Equation 30 in EEA (2009a)
EFstorage_solid: 0.01 Table 3–9 in EEA (2009a)
Field NOxapplic_tot = (Nslurry_applic + Nsolid_applic + Nfert_applic) · EFapplic
EFapplic: 0.026 Table 3–1 in EEA (2009b)
PO3−4 Field Pgw (leached to ground water) = Pgwl · Fgw Paragraph 4.4.3 in Nemecek and Kägi (2007)
Pgwl arable land: 0.07
Pgwl permanent pasture and meadow: 0.06
FgwČ32O5slurry
Pro (P lost through run-off to rivers) = Prol · Fro
Prol open arable land: 0.175
Prol extensive meadow: 0.25
Frofert: 0.2/80 · P2O5fert
Froslurry: 0.7/80 · P2O5slurry
Fromanure: 0.4/80 · P2O5manure
1
TAN = total ammoniacal-N; Nex = annual average N excretion per head (kg of N/animal); EF_TAN = emission factor of TAN; build_slurry = liquid slurry in the livestock build-ings; build_solid = solid manure in the livestock buildbuild-ings; storage_solid = solid manure in storages; storage_slurry = liquid slurry in storages; applic_slurry = application of liquid
slurry to the field; applic_solid = application of solid manure to the field; NH3 applic_fert =emission from fertilizer application to the field; N fert_applic = total N from fertilizer
application; EF fert_type = emission factor for fertilizer type; Amm nitr = ammonium nitrate; NPK = nitrogen-phosphorus-potassium fertilizer; Ts = mean spring temperature
(°C); NOx = nitric oxide compounds (NO + NO2); Pgw = quantity of phosphorus leached to ground water (kg/ha); Pgwl = average quantity of phosphorus leached to ground water
for each land use category (kg/ha); Fgw =correction factor for fertilization by slurry; Pro = quantity of phosphorus lost through runoff to rivers (kg/ha); Prol = average quantity of
4584 %$9$(7$/
Journal of Dairy Science Vol. 97 No. 7, 2014
composition, standard housing conditions, and manure management.
Impact Assessment
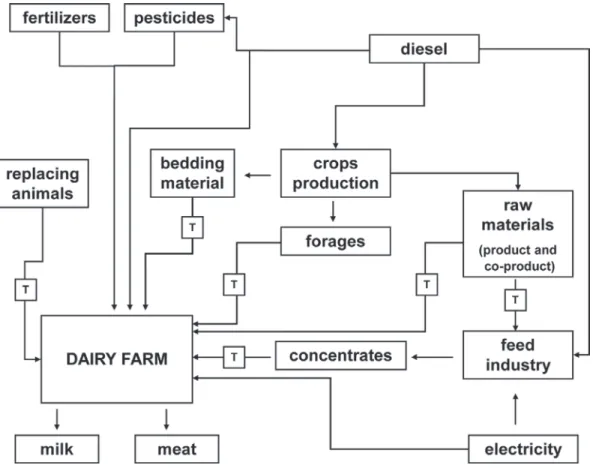
The environmental impact of milk production in each dairy farm was evaluated through a detailed cradle-to-farm-gate LCA (Belflower et al., 2012). The system boundaries included all the on-farm processes plus the off-farm activities linked to the production of external inputs (Figure 1).
The selected environmental impact categories were global warming, acidification, eutrophication, nonre-newable energy use, and land use (O’Brien et al., 2012). The impact assessment was performed with the EPD (2008) 1.03 method, updated with IPCC (2007)
global-warming potential (GWP) conversion factors (100-yr
time horizon). Land use was estimated on the basis of total area (on- and off-farm land).
On a global perspective the functional unit (FU)
was established as 1 kg of fat- and protein-corrected
milk (FPCM) leaving the farm gate (Thomassen et
Table 4. Inventory of off-farm processes Process Reference Feed production
Crop Ecoinvent, 2007; Baldoni and Giardini, 2002; Ribaudo, 2002; data from the current study Milk powder Nielsen et al., 2007
Feed processing Nielsen et al., 2007
Forage production Ecoinvent, 2007; Baldoni and Giardini, 2002; Ribaudo, 2002; data from the current study Bedding material production Ecoinvent, 2007
Rearing animals Data from the current study
Fertilizer production Patyk and Reinhardt, 1997; Ecoinvent, 2007 Pesticide production Ecoinvent, 2007
Energy production Ecoinvent, 2007 Transportation Ecoinvent, 2007
Journal of Dairy Science Vol. 97 No. 7, 2014
285,1'8675<72'$< 4585
al., 2008) estimated using the formula FPCM (kg) = raw milk (kg) × (0.337 + 0.116 × % fat + 0.060 × % protein) from Gerber et al. (2010). The biological al-location method developed by IDF (2010) for the dairy farming system was calculated using the formula AF = 1 − 5.7717 × R, where AF = allocation factor for milk; R = M meat/M milk; M meat = sum of liveweight of all animals sold, including bull calves and culled ma-ture animals; and M milk = sum of sold FPCM. The environmental impacts were also estimated from a local point of view, assuming 1 ha of farm land as FU.
Statistical Analysis
Statistical analysis was performed using SAS 9.2 software (SAS Institute, 2001) and was carried out in 3 steps. The first step was performed through a
prin-cipal component analysis (PCA; PROC PRINCOMP)
to study the relationships among total environmental impacts per kilogram of milk and per hectare, their on-farm contributions, and several quantitative vari-ables related to farming intensity, including production level (kg of FPCM/cow per day), dairy efficiency (kg of FPCM/kg of DMI), number of dairy cows, stocking rate as livestock units (LU; LU/ha), total farm land (ha), shares of maize land for silage and grassland on total farm land, and IOFC (€/cow per day). In the second step, farms were grouped through a CLUSTER procedure (using average linkage method) considering as variables total farm land (ha), number of dairy cows, stocking rate (LU/ha), production level (kg of FPCM/ cow per day), percentage of grass hay and maize silage on DMI, percentage of maize land for silage on farm land, dairy efficiency (kg of FPCM/kg of DMI), and feed self-sufficiency (expressed as the ratio between the DM produced on farm and the total DM used for animal feeding). For each cluster, average farm char-acteristics and environmental impacts on a global (FU = 1 kg of FPCM) and local (FU = 1 ha of farm land) scale were computed. Moreover a Pearson correlation
analysis was used to identify the relationship between farm characteristics and each environmental impact expressed per hectare of farm land.
RESULTS
Environmental Impacts of Milk Unit
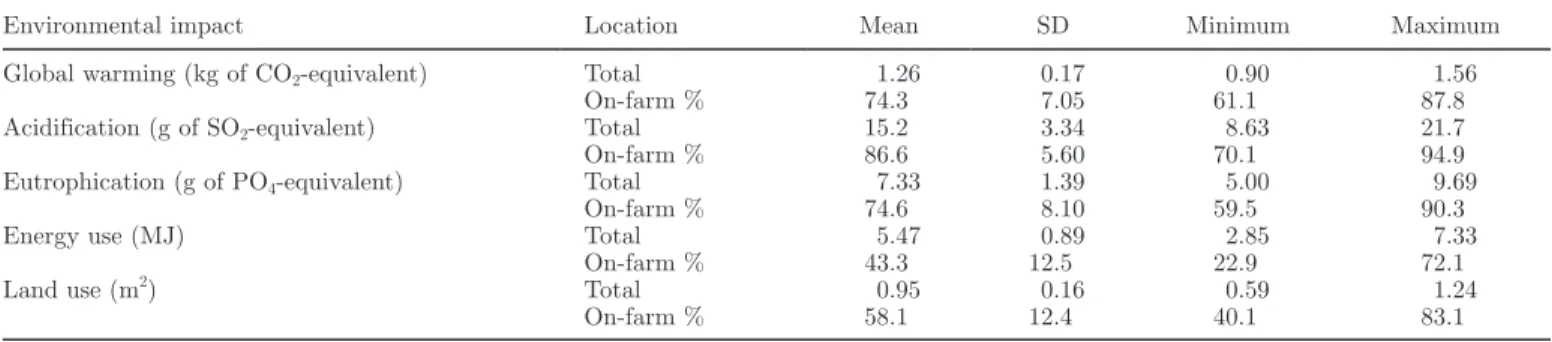
Table 5 reports the average results of the environ-mental impact assessment of milk production in the farms under consideration expressed per milk unit. The on-farm percentage of GHG emissions was much higher compared with the off-farm one. The most important contributor to global warming was enteric and manure storage emission (52.9 ± 4.40%), followed by emis-sions related to the production of concentrated feed (19.9 ± 6.78%). Almost all the acidification was due to on-farm activity and the main role was played by farm crop production (39.1 ± 8.54%), animal housing (22.7 ± 2.63%), and manure storage (22.5 ± 5.25%). Also, for eutrophication, on-farm contribution was the most important factor; in particular, farm crop produc-tion was the major driver (51.6 ± 7.89%), whereas, in off-farm processes, the production of concentrate feed accounted for 21.2 ± 7.66% of total eutrophica-tion potential. In nonrenewable energy use, the on- and off-farm contributions were similar; the production of concentrated feed covered 46.6 ± 13.9% of the total energy consumption alone. Similar to energy consump-tion, land use did not show any important difference between on- and off-farm shares; crop production for purchased concentrated feed contributed 33.0 ± 10.8% of total impact alone, followed by growing of purchased forages (5.82 ± 7.58%).
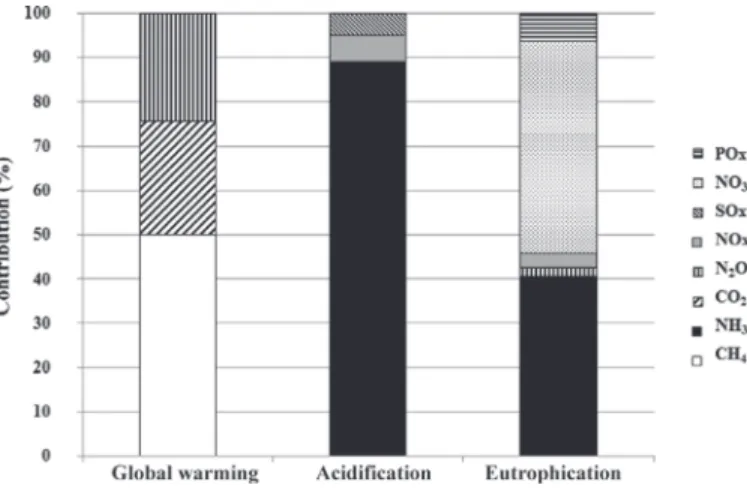
Figure 2 shows the average contributions of different substances to GWP, acidification, and eutrophication. Overall, methane was responsible for 49.9 ± 3.64% of total GHG emission, followed by carbon dioxide and nitrous oxide, which had similar weights (25.4 ± 2.59 and 24.5 ± 3.25%, respectively). Enteric fermentation
Table 5. Total environmental impacts expressed per kilogram of fat- and protein-corrected milk (FPCM) for the 28 dairy farms and on-farm contributions
Environmental impact Location Mean SD Minimum Maximum Global warming (kg of CO2-equivalent) Total 1.26 0.17 0.90 1.56
On-farm % 74.3 7.05 61.1 87.8
Acidification (g of SO2-equivalent) Total 15.2 3.34 8.63 21.7
On-farm % 86.6 5.60 70.1 94.9
Eutrophication (g of PO4-equivalent) Total 7.33 1.39 5.00 9.69
On-farm % 74.6 8.10 59.5 90.3
Energy use (MJ) Total 5.47 0.89 2.85 7.33
On-farm % 43.3 12.5 22.9 72.1
Land use (m2) Total 0.95 0.16 0.59 1.24
4586 %$9$(7$/
Journal of Dairy Science Vol. 97 No. 7, 2014
was the most important source of CH4, as 74.3 ± 8.87% of total methane was produced in the gastrointestinal tract of the animals.
Ammonia emission accounted for 88.8 ± 2.34% of acidification potential. Ammonia volatilized mainly during application of manure on farm soils (41.4 ± 9.36% of total ammonia emission) and during animal housing and manure storage (25.6 ± 2.87 and 25.1 ± 5.66% of total ammonia emission, respectively). Nitrate leaching was the main contributor to eutrophication potential (47.8 ± 4.01%), followed by volatilized NH3 (40.3 ± 4.61%), whereas the role of phosphate losses was less important (only 6.13 ± 1.43%). The percent-age of nitrate leached during on-farm crop production was higher than the fraction related to purchased feed (concentrates and forages), at 67.1 ± 10.4 and 29.6 ± 10.9% of total nitrogen leached, respectively.
Interaction Between Farm Characteristics and Environmental Impact
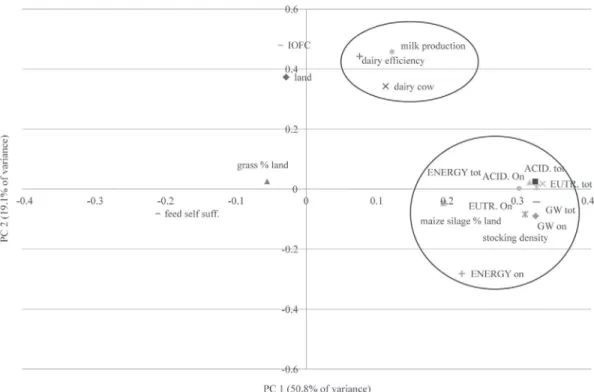
The results obtained from the PCA are plotted in Figures 3 and 4 and the eigenvectors are reported in Tables 6 and 7. Figure 3 shows the multivariate corre-lation between farm characteristics and environmental impacts per kilogram of FPCM. The first dimension ex-plains 38.7% of the total variance, whereas the second dimension explains 20.1%. Total impacts [total global warming (GWtot), total land use (LANDtot), and total energy use (ENERGYtot)] and their on-farm quotas, expressed in terms of kilograms of milk produced, are in the same area and highly correlated with each other and with feed self-sufficiency. On-farm land use and on-farm energy use are strongly related to feed self-suf-ficiency because the higher the quota of feed produced on farm, the higher their impact. Total and on-farm
acidification and eutrophication are very close to the percentage of land used for maize silage production, which needs high N fertilization.
The farm characteristics enclosed in the upper-left area of Figure 3 are inversely related to the total im-pact per kilogram of milk. The distance between the variables on the first dimension of the graph means that improving milk production and dairy efficiency, on one hand, and increasing stocking density and the share of grassland on farm land, on the other hand, may re-sult in a reduction of all the impacts per kilogram of product. Dairy efficiency is one of the parameters that mainly influences profitability, expressed as IOFC, of a dairy farm; in fact, they are in the same area of Figure 3. Stocking density and feed self-sufficiency are on the opposite sides of the graph in Figure 3 and inversely related as a consequence of the higher amount of feeds generally bought from the market in the high-stocking density farms. Figure 4 shows the multivariate correla-tion between farm characteristics and environmental impacts per hectare of land. All environmental impact categories are close to each other, to the percentage of land for maize silage, and to the stocking density. On the first dimension (principal component 1), which explains 50.8% of the variance, all impact categories, expressed on unit of land, are inversely related to feed self-sufficiency.
The Pearson correlation analysis identified stocking density and feed self-sufficiency as the major drivers of environmental burden per hectare of farm land for all the impact categories. In particular, global warming (kg of CO2-equivalent/ha of farm land) showed a strong positive correlation with stocking density (r = 0.91;
P < 0.001) and a negative correlation with feed self-sufficiency (r = −0.71; P < 0.001). Significant positive correlations were shown between the percentage of land used to grow maize for silage and all on-farm impact categories, especially acidification and eutrophication (0.55; P < 0.01 and 0.58; P < 0.01, respectively).
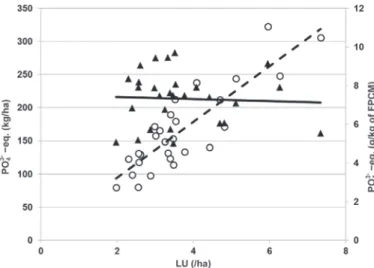
Figure 5 shows the relationship between stocking den-sity and eutrophication, expressed both per kilogram of FPCM and per hectare of farm land. The number of LU per hectare did not affect the emission per kilogram of milk, whereas it is a key point when the impact is expressed in land units.
Farming Intensity and Environmental Performances
The cluster analysis clearly identified 3 groups of farms differing in terms of intensity level (Table 8). The first one (high) included 10 farms characterized by a high level of intensification: high milk production per hectare, high percentage of arable land on total land, large land area sowed with maize for silage, high Figure 2. Contribution of different substances to the impact
Journal of Dairy Science Vol. 97 No. 7, 2014
285,1'8675<72'$< 4587
Figure 3. Principal component analysis (environmental impact expressed per kilogram of fat- and protein-corrected milk). PC = principal component; GW = global warming (kg of CO2 equivalents); EUTR = eutrophication (g of PO4 equivalents); ACID = acidification (g of SO2
equivalents); LAND = land use (m2); ENERGY = energy use (MJ); tot = total impact; on = on-farm fraction of impact; IOFC = income over
feed cost (€/cow per day); IOFC = income over feed cost (€/cow per day).
Figure 4. Principal component analysis (environmental impact expressed per hectare of farm land). PC = principal component; GW = global warming (kg of CO2 equivalents); eutrophication (g of PO4 equivalents); ACID = acidification (g of SO2 equivalents); ENERGY = energy
4588 %$9$(7$/
Journal of Dairy Science Vol. 97 No. 7, 2014
stocking density, high milk yield per cow, high dairy efficiency, high use of concentrate and maize silage in the cow rations instead of grass hay. The second cluster (medium) consisted of 7 farms less intensive in com-parison with the farms of first cluster. The third group (low) included 11 farms identified as the least intensive on the basis of their characteristics.
Total farm land was different among the 3 groups, with the highest value in the medium cluster and lower values in the others. The percentage of arable land of the low group was lower compared with the other 2
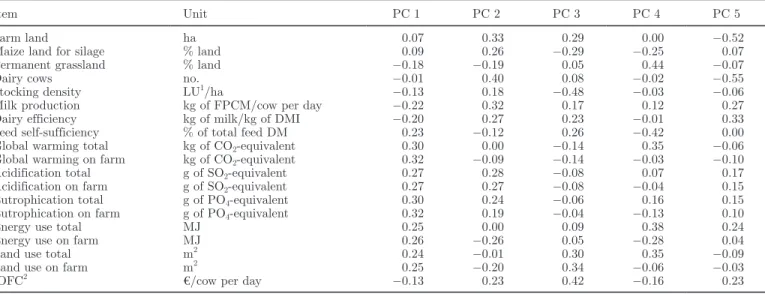
groups; high had the higher quota of land used to grow maize for silage in comparison with the low group. The number of livestock units showed the same trend among the groups observed for the farm land. Stock-ing rate was generally high; in the high group it was particularly elevated compared with the other groups. The milk production levels of high and medium were higher compared with low; similarly, the dairy efficien-cy, which is strongly related to the level of productivity, showed better results in high and medium farms. High farms had lower feed self-sufficiency compared with the Table 6. Eigenvectors corresponding to the principal components (PC) retained for the 28 dairy farms (impacts expressed per kilogram of fat- and protein-corrected milk; FPCM); the first 5 PC had eigenvalues greater than 1
Item Unit PC 1 PC 2 PC 3 PC 4 PC 5
Farm land ha 0.07 0.33 0.29 0.00 −0.52
Maize land for silage % land 0.09 0.26 −0.29 −0.25 0.07 Permanent grassland % land −0.18 −0.19 0.05 0.44 −0.07
Dairy cows no. −0.01 0.40 0.08 −0.02 −0.55
Stocking density LU1/ha −0.13 0.18 −0.48 −0.03 −0.06
Milk production kg of FPCM/cow per day −0.22 0.32 0.17 0.12 0.27 Dairy efficiency kg of milk/kg of DMI −0.20 0.27 0.23 −0.01 0.33 Feed self-sufficiency % of total feed DM 0.23 −0.12 0.26 −0.42 0.00 Global warming total kg of CO2-equivalent 0.30 0.00 −0.14 0.35 −0.06
Global warming on farm kg of CO2-equivalent 0.32 −0.09 −0.14 −0.03 −0.10
Acidification total g of SO2-equivalent 0.27 0.28 −0.08 0.07 0.17
Acidification on farm g of SO2-equivalent 0.27 0.27 −0.08 −0.04 0.15
Eutrophication total g of PO4-equivalent 0.30 0.24 −0.06 0.16 0.15
Eutrophication on farm g of PO4-equivalent 0.32 0.19 −0.04 −0.13 0.10
Energy use total MJ 0.25 0.00 0.09 0.38 0.24
Energy use on farm MJ 0.26 −0.26 0.05 −0.28 0.04
Land use total m2 0.24 −0.01 0.30 0.35 −0.09
Land use on farm m2 0.25 −0.20 0.34 −0.06 −0.03
IOFC2 €/cow per day −0.13 0.23 0.42 −0.16 0.23
1LU = livestock units. 2
IOFC = income over feed cost.
Table 7. Eigenvectors corresponding to the principal components (PC) retained for the 28 dairy farms (impacts expressed per hectare); the first 4 PC had eigenvalues greater than 1
Item Unit PC 1 PC 2 PC 3 PC 4
Farm land ha −0.03 0.37 0.35 −0.47
Maize land for silage % land 0.20 −0.05 0.40 0.15
Permanent grassland % land −0.06 0.03 −0.58 −0.32
Dairy cows LU1/ha 0.11 0.34 0.30 −0.49
Stocking density no. 0.31 −0.08 −0.08 −0.10
Milk production kg of FPCM2/cow per day 0.12 0.46 −0.20 0.17
Dairy efficiency kg of milk/kg of DMI 0.08 0.44 −0.16 0.35 Feed self-sufficiency % of total feed DM −0.21 −0.08 0.41 0.25 Global warming total kg of CO2-equivalent 0.33 −0.04 −0.10 −0.09
Global warming on farm kg of CO2-equivalent 0.33 −0.09 −0.04 −0.08
Acidification total g of SO2-equivalent 0.33 0.03 0.03 0.05
Acidification on farm g of SO2-equivalent 0.32 0.02 0.06 0.06
Eutrophication total g of PO4-equivalent 0.34 0.02 0.02 0.01
Eutrophication on farm g of PO4-equivalent 0.33 0.01 0.11 0.05
Energy use total MJ 0.30 0.00 −0.11 0.03
Energy use on farm MJ 0.22 −0.28 0.10 0.18
IOFC3 €/cow per day −0.04 0.48 0.02 0.37
1LU = livestock units. 2
FPCM = fat- and protein-corrected milk.
Journal of Dairy Science Vol. 97 No. 7, 2014
285,1'8675<72'$< 4589
other groups which had similar values. Considering the economic performances, no differences were observed between the average IOFC of the 3 clusters.
Analyzing the environmental impact on the product basis, only few differences were observed among the groups, and overall they should be considered similar (Table 9). Low farms showed higher on-farm energy use compared with the high ones. High farms had lower on-farm land use impact compared with the other 2
groups, whereas low had lower off-farm land use than high and medium.
The results change widely if the environmental im-pacts are evaluated on land unit, as shown in Table 10. High had higher total environmental impact per hectare of farm land for all the categories in comparison to the other 2 groups, which were similar to each other. A similar trend was observed for on-farm GWP, acidi-fication, and eutrophication, which were higher in high than in medium and low. No differences were found regarding on-farm energy use.
DISCUSSION
Environmental Impacts of Milk Unit
The estimated GWP for the production of 1 kg of FPCM was comparable to the value found by Guerci et al. (2013) and in agreement with Castanheira et al. (2010), who similarly obtained a higher contribu-tion of on-farm activities to GHG emission compared with off-farm activities. The acidification and the eutrophication potentials were similar to Castanheira et al. (2010), but higher compared with findings re-ported by O’Brien et al. (2012) and Basset-Mens et al. (2009). Total nonrenewable energy use was consistent with the results reported by Thomassen et al. (2008) for conventional Dutch dairy farms. Considering land use, the total impact and on-farm contribution were similar to O’Brien et al. (2012) and Basset-Mens et al. (2009). The contributions of the different substances to GWP were comparable with Castanheira et al. (2010). Figure 5. Relation between stocking density and eutrophication
expressed per kilogram of fat- and protein-corrected milk (FPCM) and per hectare of farm land. Open circles () represent eutrophica-tion per hectare and stocking density: y = 42.025x + 10.561; R2 = 0.74. Triangles () represent eutrophication per kilogram of FPCM and stocking density: y = −0.0543x + 7.5317; R2 = 0.0025. LU = livestock unit.
Table 8. Characteristics of the clusters
Item Unit
Intensity level
High Medium Low
Mean SD Mean SD Mean SD
Farm 10 7 11
Farm land ha 34.9 8.17 81.4 21 20 9.84
Arable crops % of total land 54.1 17.4 61.7 20.2 34.5 25.6 Maize for silage % of total land 45.7 18.6 38.5 13.3 26.9 22.5
Livestock unit (LU) n 157 37.1 258 36.1 55 21.5
Stocking density LU1/ha 4.71 1.44 3.31 0.8 2.97 0.67
Daily milk production kg of FPCM2/cow 28.9 2.03 28.1 2.29 24.7 5.66
Production intensity kg of FPCM/ha per year 25,917 9,043 17,771 4,875 15,439 4,668 Dry matter intake kg/cow per day 21.22 1.3 21.2 1.92 12.0 2.12 Dairy efficiency kg of milk/kg of DMI 1.36 0.16 1.33 0.07 1.22 0.18 Forage concentrate ratio 1.33 0.33 1.37 0.58 2.21 1.56 Maize silage intake % DMI 30.41 6.84 34.7 3.04 22.75 17.3 Grass hay intake % DMI 15.64 11.5 17.9 9.23 27.47 14.4 Feed self-sufficiency % of total feed DM 54.63 10.4 69.2 12.5 71.72 14.4
IOFC3 €/cow per day 5.96 1.23 6.76 0.82 5.78 1.27
1
LU = livestock units.
2FPCM = fat- and protein-corrected milk. 3
4590 %$9$(7$/
Journal of Dairy Science Vol. 97 No. 7, 2014
Similarly, several other studies reported CH4 to be the predominant contributor to the total climate change emissions (Flysjö et al., 2011; Kristensen et al., 2011; O’Brien et al., 2012), whereas Thomassen et al. (2008) found a methane contribution to total climate change of only 34% in the conventional system and of 43% in the organic system. Enteric methane is generally rec-ognized as the major driver of GHG emissions in milk production, and the abatement of enterically derived CH4 is considered one of the most promising strategies for the reduction of GHG emissions from the dairy sec-tor (Mc Geough et al., 2012).
The main contribution of ammonia to total acidifi-cation potential was found also by Thomassen et al. (2008) and Castanheira et al. (2010), who observed that NH3 emissions have a strong impact on the total
acidification potential, whereas SO2 and NOx play a
minor role. Castanheira et al. (2010) reported NH3 and
NO3 as the major contributors to total
eutrophica-tion potential, whereas Thomassen et al. (2008) found phosphate to be more important in terms of impact on eutrophication. In the study of O’Brien et al. (2012), nitrate losses occurring on-farm were around 90% for the seasonal grass-based dairy system, but only about 30% for the confinement dairy system.
Interaction Between Farm Characteristics and Environmental Impact
The negative relationships shown by the PCA be-tween total environmental impact per milk unit, on one side, and dairy efficiency and milk production level, on the other, are in agreement with numerous results from the literature. In fact, feed conversion efficiency of the Table 9. Environmental impacts expressed per kilogram of fat- and protein-corrected milk corresponding to each cluster of farms
Item Location
Intensity level
High Medium Low
Mean SD Mean SD Mean SD
Global warming (kg of CO2-equivalent) Total 1.26 0.17 1.27 0.13 1.25 0.21
On farm 0.90 0.13 0.95 0.09 0.96 0.21
Off farm 0.36 0.09 0.32 0.08 0.29 0.13
Acidification (g of SO2-equivalent) Total 16.0 3.07 16.2 4.05 13.9 2.91
On farm 13.9 2.79 14.3 4.24 12.0 2.89
Off farm 2.13 0.51 1.94 0.48 1.86 1.09
Eutrophication (g of PO4-equivalent) Total 7.59 1.24 7.71 1.10 6.86 1.63
On farm 5.45 0.82 5.96 1.38 5.23 1.65
Off farm 2.14 0.56 1.75 0.51 1.63 0.74
Energy use (MJ) Total 5.44 1.17 5.44 0.66 5.51 0.80
On farm 2.00 0.42 2.19 0.38 2.77 0.91
Off farm 3.44 0.98 3.25 0.54 2.74 1.01
Land use (m2) Total 0.89 0.16 1.02 0.18 0.97 0.14
On farm 0.44 0.13 0.59 0.14 0.64 0.14
Off farm 0.45 0.09 0.43 0.11 0.32 0.13
Table 10. Environmental impacts expressed per hectare corresponding to each cluster of farms
Item Location
Intensity level
High Medium Low
Mean SD Mean SD Mean SD
Global warming (kg of CO2-equivalent) Total 36,269 10,026 26,094 8,130 22,475 5,907
On farm 25,992 7,500 19,384 5,542 16,935 3,618
Off farm 10,277 3,088 6,711 2,845 5,540 3,442
Acidification (g of SO2-equivalent) Total 464 154 316 56 252 85.5
On farm 404 141 276 63.5 216 66.6
Off farm 60.0 17.8 40.2 18.2 36.2 28.6
Eutrophication (g of PO4-equivalent) Total 218 65.6 155 31.6 123 35.0
On farm 158 51.7 118 22.6 92.0 24.5
Off farm 60.3 18.2 37.1 19.8 30.7 18.3
Energy use (MJ) Total 152,327 36,184 111,278 32,997 99,317 26,930 On farm 56,063 12,714 43,844 8,653 47,436 10,663 Off farm 96,264 28,116 67,434 26,867 51,881 30,655
Journal of Dairy Science Vol. 97 No. 7, 2014
285,1'8675<72'$< 4591
animals is known to be an effective strategy in miti-gating the environmental impact per unit of product (Hermansen and Kristensen, 2011; Yan et al., 2013); according to Capper et al. (2008), a general increase in productivity might positively affect the environmental sustainability of milk. Guerci et al. (2013) showed that farming strategies based on high production intensity and high dairy efficiency could mitigate environmen-tal impact per kilogram of milk. The mitigation effect of enhancing dairy efficiency is based on the dilution of environmental costs associated with maintenance. Moreover high-producing cows usually receive low-fiber rations, reducing their methane emission per kilogram of milk.
The negative correlation between stocking density and total impact (per kilogram of FPCM) is a little surprising, especially when eutrophication and acidifi-cation potentials are considered. But farms with high stocking density were also characterized by high pro-duction levels and high dairy efficiency.
Grassland, instead of arable land, seemed to have a positive effect on the environmental impact, but its role was not clear due to the opposite effects of many factors. Generally grassland needs less fertilization than arable land and this has positive effects on GWP, eu-trophication, and acidification, but arable crops (e.g., maize silage) have higher yield per hectare and require less field operations and less energy compared with grass hay production (Rotz et al., 2010).
Profitability, expressed as IOFC, shows a negative relationship with total environmental impact per ki-logram of FPCM. Farms with cows more efficient in converting feed to milk have higher income per cow and lower impacts per milk unit.
Regarding environmental impact per hectare of land, PCA showed that the farm management characteristics mostly related to the different impact categories were stocking density and percentage of land for maize silage production. High LU per hectare means a high quantity of organic nitrogen on soil and low feed self-sufficiency. With respect to percentage of land for maize silage pro-duction, its positive relationship with environmental impact per hectare depends mainly on the high demand of maize in terms of nitrogen application (organic and chemical), which is positively related to environmental impact per unit of land, as found by Casey and Holden (2005).
Farming Intensity and Environmental Performances
The current study did not show any difference be-tween the environmental impact per milk unit of the 3 clusters of farms, despite important differences among the groups in terms of farm characteristics and farming
intensity. On the contrary, when the functional unit was the hectare of farm land, most of the impacts were much higher in the group of farms with high intensity levels. In general, intensification, defined as increased output per hectare, invariably led to increased emissions when expressed on an area basis; however, the result was less obvious when expressed on a product basis (Crosson et al., 2011). Basset-Mens et al. (2009) highlighted bet-ter environmental performances for the low-input dairy systems compared with more intensive systems from both a product and local perspective; similar results were obtained by O’Brien et al. (2012) for a grass-based farm versus a confinement system. van der Werf et al. (2009) observed no difference in terms of environmental impact between conventional and organic dairy systems when milk sold was considered as functional unit; how-ever, on a land basis, the conventional systems showed a significantly higher environmental burden compared with the organic systems. Similar results were found by Haas et al. (2001), who reported significantly worse environmental performances in the intensive system than in the extensive system when the impact was ex-pressed on land unit. Casey and Holden (2005) found a significant positive linear correlation between stocking
rate and the amount of CO2-equivalent per hectare,
but no relationship between stocking rate and GHG emissions per kilogram of milk. Similarly, Oudshoorn et al. (2011) found that no correlation between surplus N per hectare and emission of GHG per kilogram of ECM existed.
As a consequence, when the environmental impacts related to the product unit are considered, the iden-tification of the more sustainable production strategy seems to be difficult. Several studies compared organic versus conventional farms or grass-based versus confined farms; some authors attributed better environmental performances to the low-input systems (Belflower et al., 2012; O’Brien et al., 2012), others associated the more intensive systems with a potential reduction of the environmental pressure (Thomassen et al., 2008; Kristensen et al., 2011), still other researchers reported different results depending on the impact category con-sidered (Cederberg and Mattsson, 2000).
CONCLUSIONS
When assessing the environmental impact per milk unit, it is difficult to clearly identify the relationship between farming intensity and environmental per-formances, despite important differences in terms of farm intensification level, management, and structural characteristics. However, the PCA showed that some characteristics related to farming intensification, par-ticularly milk production per cow, dairy efficiency, and
4592 %$9$(7$/
Journal of Dairy Science Vol. 97 No. 7, 2014
stocking density, were negatively related to the impact per kilogram of product; this suggests a role of these factors in the mitigation strategy of the environmental impact of milk production on a global scale. Besides an important role in global environmental impact (i.e., climate change), livestock systems are often responsible for local and not less important impacts (i.e., eutro-phication of soils and water). Considering the environ-mental burden on a local perspective, the impacts were positively associated with the intensification level.
$&.12:/('*(0(176
This research was supported by Plan for R&S (Re-search and Development), Region of Lombardy DG Agricoltura, Italy. Project no. 1726—Individuazione di modelli di aziende zootecniche per produzioni di eccel-lenza di latte e derivati.
REFERENCES
Alvarez, A., J. del Corral, D. Solís, and J. A. Pérez. 2008. Does inten-sification improve the economic efficiency of dairy farms? J. Dairy Sci. 91:3693–3698.
AOAC International. 1995. Official Methods of Analysis. 15th ed. AOAC International, Washington, DC.
AOAC International. 1998. Official Methods of Analysis. 16th ed. AOAC International, Washington, DC.
Baldoni, R., and L. Giardini. 2002. Coltivazioni Erbacee, Foraggere e Tappeti Erbosi. Pàtron Editore, Bologna, Italy.
Basset-Mens, C., S. Ledgard, and M. Boyes. 2009. Eco-efficiency of in-tensification scenarios for milk production in New Zealand. Ecol. Econ. 68:1615–1625.
Belflower, J. B., J. K. Bernard, D. K. Gattie, D. W. Hancock, L. M. Risse, and C. A. Rotz. 2012. A case study of the potential environ-mental impacts of different dairy production systems in Georgia. Agric. Syst. 108:84–93.
Capper, J. L., E. Castañeda-Gutiérrez, R. A. Cady, and D. E. Bau-man. 2008. The environmental impact of recombinant bovine so-matotropin (rbST) use in dairy production. Pages 9668–9673 in Proc. Natl. Acad. Sci. USA, 15th ed. University of Illinois, Urbana. Casey, J. W., and N. M. Holden. 2005. The relationship between
greenhouse gas emissions and the intensity of milk production. Ireland. J. Environ. Qual. 34:429–436.
Castanheira, É. G., A. C. Dias, L. Arroja, and R. Amaro. 2010. The environmental performance of milk production on a typical Portu-guese dairy farm. Agric. Syst. 103:498–507.
Cederberg, C., and B. Mattsson. 2000. Life cycle assessment of milk production—A comparison of conventional and organic farming. J. Clean. Prod. 8:49–60.
Cornell-Penn-Miner. 2004. CPM Dairy. Dairy cattle ration analyzer, version 3.0.6. Cornell University, Ithaca, NY.
Crosson, P., L. Shalloo, D. O’Brien, G.J. Laniganc, P.A. Foley, T.M. Boland, and D.A. Kenny. 2011. A review of whole farm systems models of greenhouse gas emissions from beef and dairy cattle pro-duction systems. Anim. Feed Sci. Tech. 166:29–45. http://dx.doi. org/10.1016/j.anifeedsci.2011.04.001.
Ecoinvent. 2007. Ecoinvent Centre 2007, Ecoinvent Data v2.0—Final reports Ecoinvent 2000 No. 1–15. Swiss Centre for Life Cycle In-ventories, Dübendorf, Switzerland.
EEA (European Environment Agency). 2009a. 4.B Animal husbandry and manure management GB2009 update. From the EMEP/EEA air pollutant emission inventory guidebook 2009. Accessed May 2012. http://www.eea.europa.eu/publications/emep-eea-emission- inventory-guidebook-2009/part-b-sectoral-guidance-chapters/4-
agriculture/4-b/4-b-animal-husbandry-and-manure-management. pdf/view.
EEA (European Environment Agency). 2009b. 4.D Crop production and agricultural soils. From the EMEP/EEA air pollutant emission inventory guidebook 2009. Accessed May 2012. http://www.eea. europa.eu/publications/emep-eea-emission-inventory-guidebook- 2009/part-b-sectoral-guidance-chapters/4-agriculture/4-d/4-d- crop-production-and-agricultural-soils.pdf/view.
Ellis, J. L., E. Kebreab, N. E. Odongo, B. W. McBride, E. K. Okine, and J. France. 2007. Prediction of methane production from dairy and beef cattle. J. Dairy Sci. 90:3456–3466.
EPD (Environmental Product Declarations) 2008. SimaPro 7.7.3 PhD, Database\Professional\Methods\EPD 1.03 version. EPD, Amers-foort, the Netherlands.
Ewan, R. C. 1989. Predicting the energy utilization of diets and feed ingredients by pigs. Pages 215–218 in Energy Metabolism of Farm Animals. Y. van der Honing and W.H. Close, ed. EAAP Publica-tion No. 43. Pudoc, Wageningen, the Netherlands.
Flysjö, A., M. Henriksson, C. Cederberg, S. Ledgard, and J. E. En-glund. 2011. The impact of various parameters on the carbon foot-print of milk production in New Zealand and Sweden. Agric. Syst. 104:459–469.
Gerber, P., T. Vellinga, C. Opio, B. Henderson, and H. Steinfeld. 2010. Greenhouse Gas Emissions from the Dairy Sector. A Life Cycle Assessment. Food and Agriculture Organization of the United Na-tions, Animal Production and Health Division, Rome, Italy. Guerci, M., L. Bava, M. Zucali, A. Sandrucci, C. Penati, and A.
Tam-burini. 2013. Effect of farming strategies on environmental impact of intensive dairy farms in Italy. J. Dairy Res. 80:300–308. Haas, G., F. Wetterich, and U. Köpke. 2001. Comparing intensive,
extensified and organic grassland farming in southern Germany by process life cycle assessment. Agric. Ecosyst. Environ. 83:43–53. Hermansen, J. E., and T. Kristensen. 2011. Management options to
reduce the carbon footprint of livestock products. Anim. Front. 1:33–39.
Hutjens, M. F. 2007. Practical approaches to feed efficiency and appli-cations on the farm. Penn State Dairy Cattle Nutrition Workshop, November 13–14, Grantville, PA. Accessed May 2012. http:// www.dairyweb.ca/Resources/PDCNW2007/Hutjens.pdf.
IDF (International Dairy Federation). 2010. A common carbon foot-print approach for dairy. The IDF guide to standard lifecycle assessment methodology for the dairy sector. In the Bulletin of the IDF No 445/2010. International Dairy Federation, Brussels, Belgium.
INRA (Institut national de la recherche agronomique). 2007. Alimen-tation des bovins, ovins et caprins. Besoins des animaux—Valeurs des aliments. Tables Inra 2007. INRA, Versaille, France.
IPCC (Intergovernmental Panel on Climate Change). 2006a. Emis-sions from livestock and manure management. Chapter 10 in IPCC Guidelines for National Greenhouse Gas Inventories. Vol. 4: Agriculture, Forestry and Other Land Use. Accessed May 2012. http://www.ipcc-nggip.iges.or.jp/public/2006gl/pdf/4_Volume4/ V4_10_Ch10_Livestock.pdf.
IPCC (Intergovernmental Panel on Climate Change). 2006b. N2O
Emissions from managed soils, and CO2 emissions from lime and
urea application. Chapter 11 in IPCC Guidelines for National Greenhouse Gas Inventories. Vol. 4: Agriculture, Forestry and Other Land Use. Accessed May 2012. http://www.ipcc-nggip.iges. or.jp/public/2006gl/pdf/4_Volume4/V4_11_Ch11_N2O&CO2. pdf.
IPCC (Intergovernmental Panel on Climate Change). 2007. Direct global warming potential. In IPCC Fourth Assessment Report. Climate Change 2007: Working Group I: The Physical Science Ba-sis. Accessed June 2012. http://www.ipcc.ch/publications_and_ data/ar4/wg1/en/ch2s2-10-2.html.
ISTAT. 2012. Istituto nazionale di statistica. Accessed Dec. 2012. http://www3.istat.it/.
Kristensen, T., L. Mogensen, M. T. Knudsen, and J. E. Hermansen. 2011. Effect of production system and farming strategy on green-house gas emissions from commercial dairy farms in a life cycle approach. Livest. Sci. 140:136–148.
Journal of Dairy Science Vol. 97 No. 7, 2014
285,1'8675<72'$< 4593
Mc Geough, E. J., S. M. Little, H. H. Janzen, T. A. McAllister, S. M. McGinn, and K. A. Beauchemin. 2012. Life-cycle assessment of greenhouse gas emissions from dairy production in eastern Cana-da: A case study. J. Dairy Sci. 95:5164–5175.
Mertens, D. R. 2002. Gravimetric determination of amylase-treated neutral detergent fiber in feeds using refluxing in beakers or cru-cibles: Collaborative study. J. AOAC Int. 85:1217–1240.
Nemecek, T., and T. Kägi. 2007. Life cycle inventories of Swiss and European agricultural production systems. Final Report Ecoinvent V2.0 No. 15a. Agroscope Reckenholz-Taenikon Research Station, Swiss Centre for Life Cycle Inventories, Zurich and Dübendorf, Switzerland
Nielsen, P. H., A. M. Nielsen, B. P. Weidema, R. Dalgaard, and N. Halberg. 2003. Life Cycle Assessment food database. Accessed May 2012. http://www.lcafood.dk.
O’Brien, D., L. Shalloo, J. Patton, F. Buckley, C. Grainger, and M. Wallace. 2012. A life cycle assessment of seasonal grass-based and confinement dairy farms. Agric. Syst. 107:33–46.
Oudshoorn, V., C. A. G. Sørensen, and I. J. M. de Boer. 2011. Eco-nomic and environmental evaluation of three goal-vision based scenarios for organic dairy farming in Denmark. Agric. Syst. 104:315–325.
Patyk, A., and G. A. Reinhardt. 1997. Düngemittel- Energie- und Stoffstrohmbilanzen (Fertilizer- Energy- and Massbalances). Vieweg, Heidelberg, Germany.
Penati, C., P. B. M. Berentsen, A. Tamburini, A. Sandrucci, and I. J. M. de Boer. 2011. Effect of abandoning highland grazing on
nutri-ent balances and economic performance of Italian Alpine dairy farms. Livest. Sci. 139:142–149.
PRé Consultants. 2012. SimaPro 7.3.2 PhD, LCA software. Amers-foort, the Netherlands. Accessed May 2012. http://www.pre.nl. Ribaudo, F. 2002. Prontuario di Agricoltura. Calderini Edagricole,
Bo-logna, Italy.
Rotz, C. A., F. Montes, and D. S. Chianese. 2010. The carbon foot-print of dairy production systems through partial life cycle assess-ment. J. Dairy Sci. 93:1266–1282.
SAS Institute. 2001. User’s Guide, Version 9.0. SAS Institute Inc., Cary, NC.
Thomassen, M. A., K. J. van Calker, M. C. J. Smits, G. L. Iepema, and I. J. M. de Boer. 2008. Life cycle assessment of conventional and organic milk production in the Netherlands. Agric. Syst. 96:95–107.
van der Werf, H. M. G., C. Kanyarushoki, and M. S. Corson. 2009. An operational method for the evaluation of resource use and environ-mental impacts of dairy farms by life cycle assessment. J. Environ. Manage. 90:3643–3652.
Van Soest, P. J., J. B. Robertson, and B. A. Lewis. 1991. Methods of dietary fiber, neutral detergent fiber and nonstarch polysaccha-rides in relation to animal nutrition. J. Dairy Sci. 74:3583–3597. Yan, M. J., J. Humphreys, and N. M. Holden. 2013. Life cycle assess-ment of milk production from commercial dairy farms: The influ-ence of management tactics. J. Dairy Sci. 96:4112–4124.