Abstract—This paper deals with network performance
simulation and quality of Triple-play services in IP networks. Based on our designed analytical model, the application has been created by means of which it is possible to predict qualitative parameters for QoS in IP networks, with regard to policies applied for packet processing by routers and with regard to the level of total network utilization. The contribution of this paper lies in designing a new model capable of predicting the quality of Triple-play services respecting queuing policy and transmission speed of interfaces on routers in packet networks.
Keywords—Delay, E-Model, MOS, Network Performance
Monitoring, Packet Loss, PSNR, QoS, SSIM, Triple Play
I. INTRODUCTION
ETWORK convergence that took place during the early 90’s of the last century, as well as appearance of NGN (Next Generation Network) concept, allowed the transfer of formerly separate services (voice, video and data) by one common network infrastructure. However, this transition brought some difficulties, as packet networks based on IP protocol had not been designed to transfer delay-sensitive traffic. The difficulties appeared especially at the transfer of voice because, without any supplementary mechanisms securing the quality of service, such a transfer was not capable of providing a high-quality interactive communication similar to standard PSTN. Constant network monitoring, along with network performance intervening as needed, seems to be a method for securing at least minimal QoS level in packet network. Therefore, the purpose of the model described in this paper is to provide a simple monitoring tool capable of predicting qualitative QoS parameters according to network status. The application aims to be an alternative to expensive monitoring tools, as well as a helpful tool for designing network infrastructure with regard to securing at least minimal QoS level.
Manuscript received February 22, 2014. This work was supported by Grant of SGS No. SP2014/72 and and has been partially supported by the project No. CZ.1.07/2.3.00/20.0217 "The Development of Excellence of the Telecommunication Research Team in Relation to International Cooperation" within the frame of the operation programme "Education for competitiveness" financed by the Structural Funds and from the state budget of the Czech Republic.
J. Frnda and J. Rozhon are PhD. students with the Department of Telecommunications, VSB-Technical University of Ostrava, 17. listopadu 15, 708 00 Ostrava-Poruba, Czech Republic (phone: +420-596991641, e-mail: [email protected] and [email protected]).
M. Voznak is an assoc. professor with the Department of Telecommunications, VSB-Technical University of Ostrava, 17. listopadu 15, 708 00 Ostrava-Poruba, Czech Republic (phone: +420-596991699, e-mail: [email protected]).
Peppino Fazio is an assistant professor with the DIMES Dept., University of Calabria, Arcavacata di Rende, 87036 (CS), Italy (e-mail: [email protected]).
II. STATE OF THE ART
Recently growing interest in voice and video transfer through packet networks based on IP protocol caused that analyses of these services and their behaviour in such networks became more intensive. Logically, the highest emphasis is being put on the transfer of voice, since this service is the most sensitive to an overall network status. Papers [1]–[3] focus on degradation of voice service caused by delay and packet loss. These works use a simplified version of calculation model based on recommendation ITU-T G.107 (also known as E-model) [4] to evaluate the quality of speech, adjusting the model to be suitable especially for packet networks. At the same time, results are used to compare the application results to real practical experiments. Since the final delay and packet loss are factors depending on full network utilization and QoS policy applied to prioritized data flow processing by routers, it is necessary to consider this link as well.
Next articles [5], [6] and [10] analyse in detail the impact of network utilization and set policies on variable component of total delay. In [7] especially the impact of the buffer size for Jitter and packet loss in network is being studied. The analysis of video quality focuses on resistance of video codecs towards packet loss in network which cause the artefacts in video [8], [9]. The measurements in these works show dependence of resolution and bitrate on decrease of video quality through increasing packet loss rate in network – the higher the bitrate and resolution are, the better their resistance towards unwanted effects is. What is still missing, though, is the application of those experiments results to real use. Therefore, this paper attempts to bring a tool which, according to the application of mathematical models based on actual results, would be capable of providing with reliable information on Triple play services quality. Nowadays, the inclination to NGN concept is huge, that is why monitoring of efficiency and evaluation of impacts on QoS is highly important and necessary in order to secure the competitiveness of any multimedia services provider.
III. METHODOLOGY
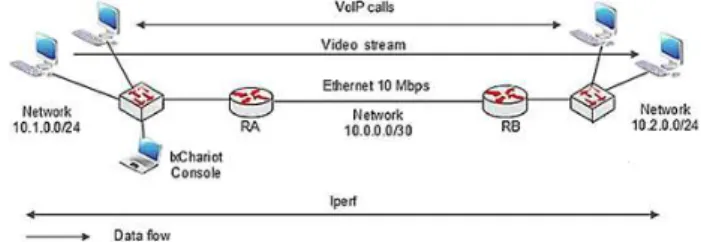
This paper follows directly our previous experiments studying the impact of full network utilization and performance of data prioritization on the final quality of service [5]. For further upgrade of the model, it was essential to analyse the link between different level of network utilization and Triple play services quality (mainly the quality of voice and video). To be able to make practical measurements, the network pictured on Fig. 1 was designed. In order to generate VoIP calls (5 for each test and every test has been performed 10 times), the tool IxChariot from Ixia company was used. The video was streamed by VLC player.
Network Performance QoS Estimation
Jaroslav Frnda, Miroslav Voznak, Peppino Fazio and Jan Rozhon
Linux tool iperf was used for utilization of the network to specific levels.
Fig. 1. Measurement scheme
MSU VQMT tool served to compare a streamed video with
the original one, so that the impact of network utilization could be analysed. Implementation of the proposed computional model was carried out by authors in programming language C#.
A. Measured parameters
E-model, defined by recommendation G.107 by ITU-T [4],
was used as an objective evaluation method for voice service. This model is based on calculation of R-factor, as follows: in which:
– basic signal-to-noise ratio
– sum of all degradation factors appearing simultaneously with the voice transfer
– represents degradation caused by the voice transfer delay – factor representing the impairment of quality caused by packet loss
= advantage factor (from 0 to 20; based on the type of the user equipment)
Previously mentioned recommendation includes also a set of recommended values which enable to simplify the calculation, so that it corresponds with packet networks. Following parameters are important, regarding the QoS in packet networks, namely Network delay, Jitter and Packet loss [6]. These parameters are included in two factors used to calculate the R-factor, in ID (2) and in above mentioned IE-EFF [4].
= + (2) In relation (2), represents the factor of impairment caused by echo (Echo-cancellation has been solved in ITU-T G.168 recommendation), and represents the factor of impairment caused by too long transfer delay. By keeping all the default values during the calculation, the R-factor reaches a final value of 93.35 [1], [4]. In order to meet user’s expectations, the value of 70 or more is needed. Simplified calculation of the R-factor uses the following final formula:
= 93.35 − − (3) Except from the R-factor values, a rating scheme of 1 – 5, called MOS (Mean Opinion Score), can be used as an evaluation scale. Conversion of the R-factor values to MOS scale values is described in previously mentioned recommendation. Objective evaluation methods for video services are based on mathematical comparison of individual frames and evaluating the similarity between them.
PSNR is defined via the mean squared error (MSE) which
represents squared deviation between a tested and an original sample and the maximum possible pixel value of the image as follows: [9], [14]:
= 10log !"# , [dB] (4)
The SSIM method considers perception of image by human
eye. It evaluates the visual impact of brightness shifts in image, variations in contrast and other detected errors of the image in comparison to original. SSIM referential values are on scale 0 – 1; with 0 meaning zero similarity to original and 1 meaning two completely identical images. Final SSIM value is a combination of three parameters, with original signal x and encoded signal y being defined as follows [8], [11], [14]:
)*+, ,- = [.*+, ,-]/ [0*+, ,-]1[2*+, ,-]3 (5)
• Element .*+, ,- compares the brightness of signal; • Element 0*+, ,- compares the contrast of signal; • Element 2*+, ,- measures the structure of
correlation;
• and α >0, β >0, γ >0 measures the weight of
individual elements.
Four levels of utilization were used to analyse the dependence of network utilization on the quality of voice and video – 25%, 50%, 75% and 100%. The voice service was represented by two codecs with the highest assessment according to PESQ ranking – G.711 A-law and G.729. The video service was represented by two currently the most used video codecs for digital broadcasting – 2 and MPEG-4(h.264). Routers were not set to any specific data processing policy (Best Effort).
Ethernet bandwidth consumption of voice codec G.711 is approximately 3 times bigger than G.729 (90.4 vs 34.4 kbps). Codec G.729 also contains implementation of PLC algorithm, hence offers better resistance during the higher level of packet loss in network [6]. For the purposes of mathematical formulation of the R-factor values drop with regard to the level of network utilization, it is essential to analyse the ratio of constituent factors a (packet loss and total – mouth to ear – delay) at such occurrence. Following tables gives information about the measurement results.
TABLEI
DEPENDENCE OF NETWORK UTILIZATION AND QOS FOR THE VOICE SERVICE
Network utilization MOS R-factor G.711 G.729 G.711 G.729 Only 5 calls 4.37 4.03 91.45 81.31 25 % 4.33 4.03 90.22 80.15 50 % 4.28 4.03 88.92 80.1 75 % 3.44 3.99 68.49 76.96 100 % 2.92 3.89 56.81 76.08
TABLE II
PACKET LOSS DURING THE VOICE SERVICE TESTING (%)
Codec/Network utilization Only 5 calls 25 % 50 % 75 % 100 % G.711 0.1 0.25 0.41 1.44 2.45 G.729 0.02 0.03 0.15 0.42 0.51 Another group of measurements was carried out to express the factor, using Linux tool netem. This tool is capable of setting required packet loss in Ethernet interface of a network adapter. The results of measurements showed following regressive equations (6), (7):
For codec G.711 PCM
4 = 5*6 + *7 ∗ 9 - - , := 99.37 % (6) Y = X = packet loss (%)
a = −207.44 b = 536.251 For codec G.729 CS-ACELP
4 = 5*6 + *7 ∗ 9 - - , := 99.34 % (7) Y = X = packet loss (%)
a = 91.1429 b = 157.535
Following diagrams describe functions of designed models, along with correspondence comparison to results from other papers. According to the diagrams, better results for G.729 can be seen in case of bigger data loss.
Fig. 2. factor as a function for G.711
Fig. 3. factor as a function for G.729
The second factor, , is being expressed by regressive equation used in our previous work and specified at the beginning of the interval, as follows [5]:
For at interval of 0-180 ms
4 = *6 + *7 ∗ 9:--: (8)
Y = X = total delay (ms) a = −0.606899 b = 0.0000602265 For at interval over 180 ms
4 = 6 +>#:, := 99.83 % (9) Y = X = total delay (ms)
a = 7.87441 b = −1192.81
If both of these factors are specified, it is possible to check the equation (3) for realized measures.
TABLE III
LIST OF INDIVIDUAL PARAMETERS FOR G.729 FROM IXCHARIOT
PROGRAMME, ACQUIRED DURING THE TESTING
MOS Average R-value Average End-to-End delay Average [ms] One-Way Delay Average [ms] Jitter Average [ms] 3.82 75.28 219.34 92 52.310
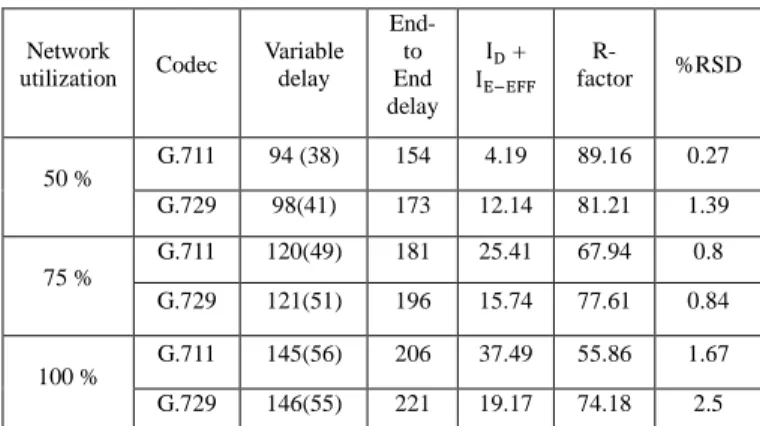
Table III shows that factor consists of two major components. Fixed delay (transformation to digital form, creation of voice packet,...) reached the average value of 61 ms for G.711 and 75 ms for G.729. The second component, variable delay that includes the time necessary for packet processing in routers, and variation of Jitter delay [6], [13] is influenced by network performance and it is necessary to experimentally measure it. Overall End-to-End delay is sum of fixed and variable delay. Table IV describes the results of variable delay for two routers through which the network was utilized, along with a factors.
TABLE IV
CALCULATION OF THE R-FACTOR BY IMPLEMENTING EQUATIONS AND
VALUES OBTAINED BY MEASUREMENTS.
Network utilization Codec Variable delay End-to End delay IA + IB BCC R-factor %RSD 50 % G.711 94 (38) 154 4.19 89.16 0.27 G.729 98(41) 173 12.14 81.21 1.39 75 % G.711 120(49) 181 25.41 67.94 0.8 G.729 121(51) 196 15.74 77.61 0.84 100 % G.711 145(56) 206 37.49 55.86 1.67 G.729 146(55) 221 19.17 74.18 2.5
NOTE: NUMBER IN BRACKETS DETERMINES THE SIZE OF JITTER WITHIN VARIABLE DELAY, DELAY VALUES ARE EXPRESSED IN MILLISECONDS
The relative standard deviation (%RSD) is a statistical measure of the precision for a series of repetitive measurements. The RSD is calculated from the standard deviation and is commonly expressed as a percentage (%). Due to the very low calculated values of RSD, it can be pronounced that mentioned regressive equations implemented for the application are truly accurate. An interesting fact is
0 1 2 3 4 5 6 7 8 0 10 20 30 40 50 60 70 packet loss [%] Ie−eff model [1] [12] 0 1 2 3 4 5 6 7 8 5 10 15 20 25 30 35 40 packet loss [%] Ie−eff model [1] [2] [3] [12]
that the delay caused by two routers is quite big (94-38=56 ms) already at network utilization of 50%. The conclusion from [6] is confirmed, since it emphasizes the importance of network performance type. During our measurements, we were equipped not only with voice calls in network performance, but also with a streamed video and several UDP flows generated by iperf. Such a huge data extent resulted in decrease of network efficiency already at its half-sized utilization. The delay values on routers acquired by measurements, as well as Jitter value, will be applied for the calculation of total delay with regard to number of used routers and network utilization at individual sections expressed by percentage (0% 50% 75% 100%).
For calculation of buffer size to eliminate Jitter delay, minimally 1.5 times larger size of buffer, compared with measured average delay, is required [13]; the application is based on this recommendation. In order to use an adequate delay value on routers with regard to network section utilization, a simple equation with measured values can be implemented for the application:
= 44.5963 + 45.3578**9-: (10) In which stands for delay on the two routers and X stands for utilization of the section (0.5; 0.75; 1).
When implementing QoS policy other than Best Effort, results of measurements are processed [5]. The last delay component which needs to be focused on is Jitter, or more precisely the buffer size on receiving side. In case the buffer is set on low level, its fast filling is usually followed by packet drop. On the other hand, setting the buffer on too high level causes a disproportionate increase of one-way delay. The application based on previously mentioned recommendation and results acquired by measurements calculates the appropriate buffer size. It also offers an option to set any buffer size, however, it is necessary to consider this factor when making an overall evaluation of final quality of service. For the purposes of such an evaluation, following Table V was compiled, using the results from [7].
TABLEV
MEASURED JITTER BUFFER LOSS [7]
Jitter [ms] Buffer size [ms] Average buffer loss [%] 20 40 0.1 20 60 0.03 40 40 5.98 40 60 1.45 80 40 14.75 80 60 7.9
The Table V shows that if the buffer is more than double-sized, there is a minimal chance of packet loss increase. On the contrary, if the buffer size is approximately the same or smaller than average Jitter, it results in significant packet loss increase.
The ratio between Jitter and buffer size may be expressed as
follows:
D>= −4.65399 + 9.71812*X (11)
In which D> represents the increase of packet loss in network (%) and X represents the ratio between Jitter and buffer on the scale 0.5 – 2.
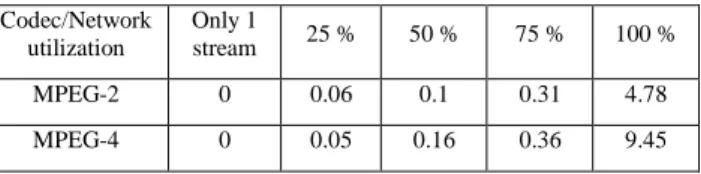
The results of quality of video measurements stress an enormous impact of packet loss in network. Since streamed broadcasting via the Internet known as IPTV is a one-way service, the delay does not play such a significant role in this case. Newer codec MPEG-4 uses stronger compression than its predecessor. While streaming the video that demands much higher capacity than voice, more significant packet loss was detected. The values of packet loss for both, MPEG-2 and MPEG-4, expressed in percentage, can be seen in Table VII.
TABLEVI
DEPENDENCE OF NETWORK UTILIZATION AND QOS FOR VIDEO SERVICE
Network utilization MPEG-2 MPEG-4(h.264) PSNR [dB] SSIM PSNR [dB] SSIM Only 1 stream 51.835 0.989 51.235 0.989 25% 49.124 0.985 46.511 0.965 50% 47.16 0.976 32.001 0.949 75% 40.72 0.961 24.531 0.919 100% 27.234 0.929 17.036 0.763 TABLEVII
PACKET LOSS VALUES DURING THE TESTING OF VIDEO SERVICE (%)
Codec/Network utilization Only 1 stream 25 % 50 % 75 % 100 % MPEG-2 0 0.06 0.1 0.31 4.78 MPEG-4 0 0.05 0.16 0.36 9.45
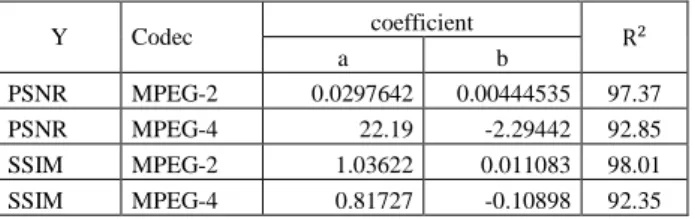
The decrease in QoS, altogether with the analyzed impact of packet loss on final quality of video, was processed into following regressive equations in which X stands for percentage packet loss ratio in network and Y represents final result in PSNR or SSIM metric. Verification of these mentioned formulas are published in our previous paper [5] and they have been used for creating of prediction model. Regressive equations are shown in Tab. VIII and their coefficients in Tab. IX.
TABLEVIII
REGRESSIVE EQUATIONS OF VIDEO SERVICE [5]
MPEG-2 MPEG-4(h.264)
PSNR 4 = 1
6 + 75.E *9- 4 = 6 + 7 ∗ .E
*9-SSIM 4 = 1
*9-TABLEIX
COEFFICIENTS OF REGRESSIVE EQUATION MODELS FOR VIDEO [5]
Since the application focuses on the whole scale of Triple-play services, there is one service left – data. We have dealt with this service as well in previously mentioned paper [5], which detected the ratio between network capacity and actually reached speed of ftp service with regard to utilization and implemented QoS policy. This ratio has been used for calculation of data service speed from end user entered value of downloading speed.
B. Application settings
Overall application settings:
• Calculation of MOS and the R-factor, based on prediction of total delay, Jitter buffer, selected packet loss and network utilization
• Calculation of SSIM and PSNR for video with regard to selected packet loss in network
• Bandwidth for data service within Triple-play
Following parameters are possible to set for the purposes of application settings specification:
• Bandwidth uplink and downlink at end user
• Number of routers, their configured policies and utilization of individual sections
• Distance between communicating points
The application will offer an option to change the total delay, De-Jitter buffer size and packet loss values.
IV. CONCLUSION
The aim of this paper was to bring a new simulating model able to predict objective QoS parameters of Triple play services in IP network. The accuracy of mathematical models was verified through a method of comparing the calculation with results of actual experiments. Measured results then served as predefined scenarios concerning packet loss in network, delay at specific policy implementation and selected network utilization. The use of proposed models provides the application with an ability to react immediately to any changes of default settings and adapt to a specific status as much as possible. Further improvement of the application is expected.
The next step should be an analysis of the impact of security and coding mechanisms implemented on QoS parameters. Security is a highly discussed topic nowadays, and protocols such as IPsec, SSL/TLS, SRTP or ZRTP are
becoming more and more frequently used to secure the content of voice or video. Therefore, the proposed analytical computational model should take into account various security measures in network as well.
REFERENCES
[1] M. Voznak, "E-model modification for case of cascade codecs arrangement," International Journal of Mathematical Models and Methods in Applied Sciences, Volume 5, Issue 8, 2011, Pages 1439-1447.
[2] R. G. Cole and J. H. Rosenbluth, "Voice over IP performance monitoring," ACM SIGCOMM Computer Communication, New York, 2001.
[3] Managing Voice Quality with Cisco Voice Manager (CVM) and Telemate. Cisco Systems Inc. Avaiable at: http://www.cisco.com/en/US/products/sw/voicesw/ps556/products_tech _note09186a00800946f8.shtml
[4] ITU-T G.107, The E-model, a computational model for use in
transmission planning, ITU-T Recommendation G.107, ITU-T Geneva, Switzerland: May 2010.
[5] J. Frnda, M. Voznak, J. Rozhon, M. Mehic, “Prediction Model of QoS for Triple Play Services,” 21st Telecommunications Forum TELFOR 2013, November 26-28, 2013, Belgrade, Serbia
[6] Mansour J. Karam, Fouad A. Tobagi, “Analysis of delay and delay jitter of voice traffic in the Internet,” Computer Networks 40: 711-726 (2002) [7] A. Kovac, M. Halas, “E-model mos estimate precision improvement and modelling of jitter effects,” Advances in Electrical and Electronic Engineering, Volume 10, Issue 4, 2012, pp. 276-281.
[8] Y. Changhoon and A. C. Bovik, "Evalution of temporal variation of video quality in packet loss networks." Signal Processing: Image Communication, 2011, pp 34-38.
[9] N. Feamster and H. Balakrishnan, "Packet Loss Recovery for Streaming Video", 12th International Packet Video Workshop, Pittsburgh, PA, April 2002.
[10] K. Molnar, V. Vrba, “DiffServ-based user-manageable quality of service control system,” 7th International Conference on Networking, ICN 2008, Cancun, Mexico, 2008, Article number 4498208, pp. 485-490.
[11] Z. Wang, E.P. Simoncelli and A.C. Bovik, "Multi-scale structural similarity for image quality assessment," In Proc. 37th IEEE Asilomar conference on Signals, Systems and Computers, 2002.
[12] ITU-T G.113, Transmission impairments due to speech processing,
ITU-T Recommendation G.113, ITU-T Geneva, Switzerland. 2001 [13] B. Kyrbashov, I. Baronak, M. Kovacik and V. Janata, "Evaluation and
investigation of the delay in voip networks," Radioengineering, Volume 20, Issue 2, June 2011, Pages 540-547.
[14] M. Uhrina, J. Hlubik, M. Vaculik, “Correlation Between Objective and Subjective Methods Used for Video Quality Evaluation,” In Journal Advances in Electrical and Electronic Engineering, Volume 11, Number 2, December 2013, ISSN: 1804-3119
Y Codec coefficient R: a b PSNR MPEG-2 0.0297642 0.00444535 97.37 PSNR MPEG-4 22.19 -2.29442 92.85 SSIM MPEG-2 1.03622 0.011083 98.01 SSIM MPEG-4 0.81727 -0.10898 92.35