Paper prepared for InterNoise 2009, Ottawa, Canada
Non-responsiveness of conventional measures of road traffic
noise to an urban truck restriction strategy
A.L. Brown1 Deanna Tomerini2
Urban Research Program Griffith University
Nathan, Brisbane, 4111 Australia
Joseph Carroll3 Heggies
Level 1, 240 Waterworks Road Ashgrove QLD 4060
Australia
Norman D. Scott4
Department of Transport and Main Roads Queensland
Australia
ABSTRACT
This study reports the acoustic results of heavy vehicle restrictions on an urban road corridor. It is not the traffic strategy itself that is the focus of this paper, but the insensitivity of conventional measures of road traffic noise to the resultant changes in heavy vehicle flows, and hence to assessing the effectiveness of the heavy vehicle strategies in reducing noise exposure and human response to noise. Community reaction to noise from heavy vehicles is a major constraint in urban freight management and the effects of control strategies must be able to be measured. Heavy vehicle management on an urban corridor in Brisbane, Australia, lead to a measureable reduction in their flows. Noise monitoring, nine sets of measurements over 30 months, showed no change in conventional measures of road traffic noise (LA10 and LAeq). However, the level and incidence of the maxima of pass-by noise events in the traffic stream did show a change. If human reaction to road traffic noise depends only on the conventional measures of noise, there is no issue. If, as the literature suggests, effects such as sleep disturbance depend critically on the number and level of noise events, conventional traffic noise measures provide an unresponsive set of indicators on which to base, and assess, heavy vehicle management strategies.
1. INTRODUCTION
An urban corridor in Brisbane, Australia, links various motorways with major industrial areas and is an important regional freight route, but it also serves as both an urban arterial road and a local access road to residential properties. It is characterised by traffic streams that carry a high proportion of commercial vehicles, particularly articulated heavy vehicles. Measures to reduce the volumes of heavy vehicles on this corridor have been implemented over several years in an
1
Email address: lex.brown@griffith.edu.au
2 Email address: d.tomerini@griffith.edu.au 3 Email address: Joseph.Carroll@heggies.com
attempt to reduce a range of effects, particularly road traffic noise at night, on residents living adjacent to the roadway—the community having previously identified heavy vehicles in the traffic stream as a significant problem for them.
In June, 2005, the toll for heavy vehicles on a route (LGM) that was parallel to the study corridor (BUC) was removed, as a trial, to encourage heavy vehicles on the study corridor to voluntarily reroute to the toll roadway. The toll removal operated only during the night hours (10.00 pm to 5.00 am) with the intent of reducing noise from heavy vehicles along the corridor during the hours when most residents were sleeping—but would have had no effect on heavy vehicle flows on the corridor during the day-time hours, or on traffic other than trucks at any hour. After two years, in July 2007, the toll reduction strategy was replaced by a restriction on through-vehicle movements of heavy vehicles on the corridor, with 24 hour enforcement of this restriction by automatic number plate recording at both ends of the corridor. The system detects, and penalizes, heavy vehicles that utilize the corridor in less than a specified period, and is directed at preventing through movements, but allowing those that have business within the corridor to continue to utilize it without penalty. Again, this management strategy would have no effects on traffic flows other than certain classes of heavy vehicles (described further below) using the corridor.
As noise was one of the main drivers for adopting these traffic management strategies, the responsible authority (Main Roads, Queensland) implemented a noise monitoring program for the corridor, involving measurements of road traffic noise on nine separate occasions from February 2005 (before any heavy vehicle management) until August/September 2007 (heavy vehicle restriction in force). This paper examines the results of this longitudinal noise monitoring study on the corridor, particularly in terms of the sensitivity of conventional measures of road traffic noise (LA10 and LAeq) in assessing the attempts to reduce the effects of noise from heavy vehicles on adjacent residents.
2. CHANGES IN HEAVY VEHICLE FLOWS ON THE CORRIDOR
The corridor under study was 11.5 km in length, in three separate sections (BUC Sections A, B and C) with traffic entering or leaving the corridor in various places such that the traffic volumes were not identical on each section. Total two-way vehicular flows on different sections, and in different periods throughout the study, ranged from 35 000 to 55 000 vehicles per day. The corridor roadway was of variable width, with four to six lanes of traffic in different sections, and with posted speed limits ranging from 60km/h to 80 km/h. Residential development fronts much of the corridor.
As the management strategy concerned heavy vehicles only, the focus here is on changes in the volumes of heavy vehicles through the study period. Quite apart from the effects of the traffic management strategies described above, heavy vehicle flows in this area are highly variable from day to day, depending on a range of unidentified factors probably related to seasonal flow of commodities, shipping deliveries, restocking schedules etc. Further, over the period of the study, overall traffic volumes in the region continued to grow as a result of population changes and land use changes, at an annual rate of some 3.5%.
Table 1 shows the available total two-way counts of heavy vehicles on the three Sections of the BUC corridor at the nine measurement periods throughout the study. There is large inherent variability in heavy vehicle numbers, as evidenced by both increases and decreases in the first two columns of Table 1—before any management was introduced. Despite this, there is some evidence that heavy vehicles tended lower after the commencement of the toll-free trial, returned to pre-trial numbers by the end of the trial, then generally dropped with the enforcement of the heavy vehicle restriction. While comparable data is not available for the whole period, the effect
of the enforcement of heavy vehicle restriction is unambiguous for counts of Austroads1 vehicle Class 4 and above—shown in parentheses in Table 1. The numbers of vehicles of this class dropped between 11% and 44% on different sections of the study corridor. It should be noted that the toll-free trial applied only to vehicles of Austroads vehicle Class 4 and above, and the restriction enforcements only to vehicles with a GVM greater than 4.5 tonnes (articulated vehicles) hence reductions in the number of these heavier types of vehicle using the corridor would have been even greater than suggested by the available data reported in Table 1.
Table 1: Comparison of average number of heavy vehicles per day on different sections of the corridor over the period of the study. Heavy vehicles counts include vehicles of Austroads Class 3 and above* (Austroads Class 4 and above** in parentheses). Percentages are the changes in the Class 4, and above, heavy vehicle count from pre- to
post-enforcement of the heavy vehicle restrictions.
Prior to toll-free trial
During toll-free trial During restriction enforcement Location Feb 2005 Apr 2005 Jun 2005 Oct 2005 Feb 2006 Nov 2006 Mar 2007 June 2007 Aug/Sep 2007 BUC Section A 4852 4842 4746 4654 5041 5028 (2648) 4432 (2087) (-21.2%) 5730? (2344) (-11.5%) BUC Section B 4031 4685 4226 4954 5380 5398 (2735) 3551 (1520) (-44.4%) 4914 (2116) (-22.6%) BUC Section C 4594 4060 4227 4482 4722 4783 4603 (2359) 3923 (1909) (-19.1%) 4839 (2104) (-10.8%) LGM A (5385) (6155) (+14.3%) (7142) (+32.6%) LGM B (4565) (4792) (+5.0%) (5353) (+17.3%)
*Two axle trucks and buses, vehicles with three or more axles, and articulated vehicles **Vehicles with three or more axles, and articulated vehicles
For comparison purposes, Table 1 also shows changes in the numbers of Class 4 and above vehicles on the roadway to which the heavy vehicles on the study corridor are likely to have been diverted (LGM, locations A & B). On this route, the numbers of this class of heavy vehicles increased between 5% and 33% with the introduction of the enforcement.
A separate analysis is available of changes in the number of heavy vehicles (Austroads vehicle Class 3 and above) using the study corridor in the 10.00 pm to 5.00 am period against the number of heavy vehicles in the 24 hour period, before and during the toll-free trial (comparable data are not available for the restriction enforcement period). While the absolute numbers of heavy vehicles were highly variable across different periods and days of measurement, the regression analysis results shown in Figure 1, for all the before (“prior”) and after (“during”) toll-free trial periods, establish that the number of heavy vehicles using the corridor late at night were less, for any given number of heavy vehicles in 24 hours, after the toll-free trial was introduced than before the trial.
Figure 1: Number of heavy vehicles using the study corridor in the 10:00 pm to 5.00 am period as a function of the total 24 hour heavy vehicle volume. The regression lines are based on all heavy vehicle counts on all section of the
corridor at all periods to the beginning of the restriction enforcement (from Brown et al.2)
For the purposes of this paper, the conclusion that can be drawn from the data in Table 1 and Figure 1 is that the number of heavy vehicles flowing on the study corridor decreased as a result of the sequential heavy vehicle management measures that had been implemented. The change was particularly for the heavier classes of vehicle after restrictions were enforced, but also evident earlier, after the introduction of the toll-free trial.
3. CHANGES IN CONVENTIONAL NOISE MEASURES
The noise exposures at various dwellings along the corridor were measured over the period Feb 2005 to Aug/Sep 2007, at four different locations (BUC3 to BUC6), with measurements one metre from the façade of dwellings that fronted the corridor. Repeat measurements were made over two to four days at each site in each period. There was minimal variation between different measurement days, and reported measurements are the average over two to four days.
Queensland practice for measurement of road traffic noise is to use the LA10(18hour). Table 2 shows these levels at each of the four sites over the nine repeat measurements for the duration of the study. There are between-site differences in levels because of different distances from the roadway (5m to 23m), but the Table shows that there is little to no change in within-site levels at any of the sites throughout the 30 months of the study. Neither the toll-free trial nor the enforced restriction on heavy vehicle through movements on the corridor resulted in any change in noise level exposure when traffic noise levels were measured using the conventional noise monitoring scale LA10(18hour) during the 6.00 am - 12.00 midnight period. Noise measurements were also made at two locations (LGM 1 and 2) on the roadway to which the diverted heavy vehicle traffic is likely to have been relocated (LGM noise measurements were free field). They show a trend of increasing noise levels over the study period. It can be noted that this roadway has few residential land uses close to the roadway
Because the toll-free trial operated only during the seven-hour period 10.00 pm to 5.00 am, unconventional seven-hour noise levels were also measured. Tables 3 and 4 show LA10(7hour) and
Table 2: LA10(18hour) noise levels at each of the study sites over all periods LA10(18hour) dB Prior to toll-free trial
During toll-free trial During restriction enforcement Location Feb 2005 Apr 2005 Jun 2005 Oct 2005 Feb 2006 Nov 2006 Mar 2007 May 2007 Aug/Sep 2007 BUC 3 77 78 78 77 79 77 78 79 78 BUC 4 80 81 81 80 80 80 80 82 81 BUC 5 72 72 71 71 71 72 72 73 71 BUC 6 76 76 76 76 76 76 77 78 76 LGM 1 77 76 76 77 78 78 80 80 79 LGM 2 81 82 80
LAeq(7hour) for the sites for each of the nine measurement periods. The latter, LAeq(7hour), approximates the Lnight indicator adopted by the European Union, though for a period one hour shorter, and commencing one hour later, than the eight hours utilized in that indicator.
Table 3: LA10(7hour) noise levels at each of the study sites over all periods
LA10(7hour) dB Prior to toll-free trial
During toll-free trial During restriction enforcement Location Feb 2005 Apr 2005 Jun 2005 Oct 2005 Feb 2006 Nov 2006 Mar 2007 May 2007 Aug/Sep 2007 BUC 3 73 73 73 73 74 73 72 73 73 BUC 4 73 73 73 73 73 73 72 73 73 BUC 5 65 65 64 64 64 65 64 65 65 BUC 6 68 68 68 69 68 69 68 68 69 LGM 1 69 69 68 70 70 71 71 71 71 LGM 2 72 74 75
Again, Tables 3 and 4 demonstrate that there is effectively no change in exposure at any of the sites on the study corridor throughout the 30 months of the study. To the extent that the noise measurements are indicative of the exposure of residents along the corridor, the levels, during both the day and the night, are high.
4. NON-RESPONSIVENESS OF NOISE INDICATORS
The heavy vehicle reduction strategies had an effect on reducing the flow of these vehicles on the corridor. However, neither the toll-free trial nor the enforced restriction on heavy vehicle through movements resulted in any change in noise level exposure when traffic noise levels were measured using LA10 or LAeq, even when the noise measurement period contained only the night hours when the heavy vehicle reduction strategies would be expected to have the most effect—
Table 4: LAeq(7hour) noise levels at each of the study sites over all periods LAeq(7hour) dB Prior to toll-free trial
During toll-free trial During restriction enforcement Location Feb 2005 Apr 2005 Jun 2005 Oct 2005 Feb 2006 Nov 2006 Mar 2007 May 2007 Aug/Sep 2007 BUC 3 69 69 69 70 70 69 69 70 69 BUC 4 71 71 70 70 70 71 70 71 71 BUC 5 63 63 62 62 61 63 62 63 63 BUC 6 66 66 66 66 66 66 66 66 66 LGM 1 69 69 68 69 69 70 69 70 71 LGM 2 71 72 72
though reduction in night-time traffic noise exposure was one of the major objectives sought through the strategy. The immediate conclusion is that the heavy vehicle reduction strategies would have failed to reduce noise effects on residents in adjacent dwellings.
However, the above conclusion is based on the assumption that the conventional measures of road traffic noise (in this case LA10(18hour)), or even measures using conventional scales (LA10 or LAeq) over a seven hour period of the night (10.00 pm to 5.00 am) tell the full story with respect to potential noise effects on the community. There is considerable literature regarding human response to the number of noise events in the traffic stream, at least with respect to sleep disturbance. Sleep disturbance primarily depends on the number and acoustical properties of single noise events. While the European Union has identified that the Lnight indicator should be used for night time noise exposure, it additionally recognizes that it may be advantageous to use maximum SPL LAmax,or sound exposure levels (SEL), as supplementary noise indicators for night period protection. Lower traffic densities during the night usually produce intermittent exposure to single noise events. Traffic noise induced alterations in sleep structure depend crucially on the number of noise events, the level of single noise events, the placement of noise events within the night, and on noise-free intervals between noise events3. Because it is possible for the level and number of noise events in a road traffic stream to vary, but without significant concomitant change in the conventional noise scales4, further analysis of change in noise exposure along the corridor is warranted.
5. NOISE EVENTS
An attempt was made to examine how noise events in the traffic stream changed on the study corridor as a result of the heavy vehicle management strategies. Whereas conventional road traffic noise measurement, using statistical and equivalent-energy descriptors, is well established, a rigorous approach to the monitoring of the number and level of noise events from a road traffic stream is, at this stage, underdeveloped. Some observations with respect to issues that need to be addressed in future noise event monitoring are described in Section 6.
Unattended equipment measured the number of events where the LAmax exceeded particular levels, and sorted these into 5dB bins. Figure 2 is an example of the results of the noise event monitoring at one site on the corridor, showing the number of noise events for each hour of the day, for which the LAmax exceeded levels of 70 db to 90 dB.
Figure 2. Example from one site in the study corridor of the number of noise events in the traffic stream (for which the LAmax of the noise event exceeded various levels) for each hour of the day.
Using data of the type illustrated in Figure 2, it is possible to examine how the number of noise events of different levels changed in the study corridor throughout the 30 months of the heavy vehicle management strategy. Figure 3 provides an example of changes in the number of noise events exceeding 90 dBA and 85 dBA (levels at which a significant proportion of the maxima are caused by heavy vehicles in the traffic stream) during the night period (10.00 pm to 5.00 am) at one site on the corridor. The figure shows that, while noise event counts vary day to day—even though LA10 or LAeq show no such variation—the average number of high level noise events has changed over the study period, particularly after the enforcement stage of the heavy vehicle management strategies. These is a selected result from one measurement site in the corridor, and not all sites, for reasons that are not clear (but see the discussion in the next section) exhibit identical results. It should be noted, when examining Figure 3, that the management strategies applied to only a very small fraction of the vehicle types using the study corridor, and that total overall traffic flow would have continued to grow during the 30 months of the study. Further confirming evidence of the effect of the heavy vehicle management strategy on changes in the number of noise events in the study was provided by concomitant increases in the number of high-level noise events at the sites (LGM 1 and 2) on the roadway to which heavy vehicles from the study corridor are likely to have diverted.
This analysis is indicative that, while reduction of the number of heavy vehicles in a traffic stream may not result in changes to conventional measures of road traffic noise, other measures of traffic noise exposure, namely the number of high level noise events, may change in response to the changes in the traffic composition. The consequence is that human effects of noise that may depend on the number and level of noise events in the traffic stream, predominantly but not necessarily limited to sleep disturbance, may change as a result of heavy vehicle management strategies, but not be detected by conventional measures of road traffic noise.
Figure 3. Change in the number of noise events ≥85 dB and ≥90 dB per hour during the night (10.00 pm to 5.00 am) at one site on the study corridor, over all periods. The lines show the average number of noise events from repeat
measurements over several (usually two) nights.
6. OBSERVATIONS ON THE MEASUREMENT OF NOISE EVENTS
Several observations can be made regarding current limitations in knowledge and practice of noise event monitoring. These need further research to develop protocols for noise event monitoring in the traffic stream in ways which can provide valid and reliable counting of maxima levels from vehicles in the traffic stream and, for traffic noise management purposes, attribution of these maxima to particular types of vehicle sources. Firstly, the number of noise events exceeding particular levels is highly variable from day to day. This is in contrast to conventional noise measurements from streams of vehicles which tend to show little daily variation. Secondly, the width of multilane roadways, and distribution of vehicle flows and mix across the lanes, has a major effect on noise event counting. For example, heavy vehicles travelling in a lane on the far side from a monitoring station may generate the same or lower maximum level as do cars travelling in a nearside lane. Thirdly, maxima generated by any vehicle type is highly dependent on the way the vehicle is operated, either because of individual driver behavior, or because of the traffic characteristics at any particular site, influenced by road gradient, lane or gear changing, acceleration and deceleration.
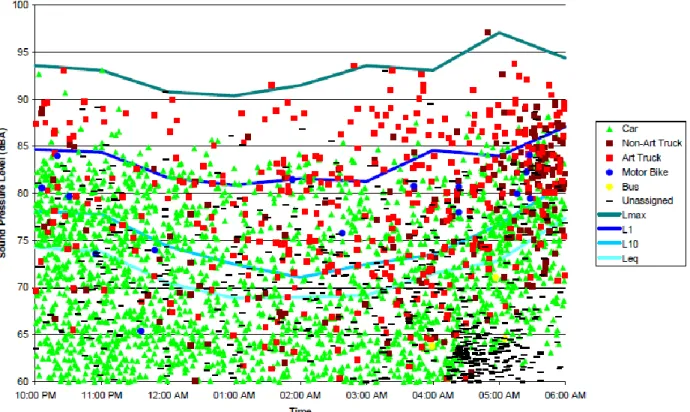
As a first step in examining some of these factors, the current study trialed, in its last set of measurements, attended measurements in which observers also recorded the vehicle type and direction of travel of the vehicles generating each particular noise event. Results for one site on the corridor, showing vehicle type though not direction of travel, is in Figure 4. If a noise event
was recorded by the equipment but the operator was unable to record details of the event, the event was recorded as “unassigned”.
Figure 4. Attended noise event monitoring results from one site on the corridor (5 metres from the nearside edge of the roadway) for the night period. Data points show the LAmax of individual vehicle noise events detected by
the measurement equipment, but with vehicle type identified by the operator.
Figure 4 shows that the majority of high level maxima are generated by articulated heavy vehicles, but with cars, motorcycles and non-articulated trucks also contributing, There is high variability in the maxima caused by any one vehicle type, due not only to differences in noise emissions of the individual vehicles, but also dependent on the location of the vehicle across the roadway, and traffic and driver operating characteristics. With further development of procedures to measure and analyze the extensive data produced by this type of monitoring, it should be possible to develop more robust ways of counting, and attributing to vehicle types, the number and level of noise events in a traffic stream, than the basic procedures used in this study (that produced results of the type reported in Figures 2 and 3). Improved procedures should assist in assessing potential changes in the effects of road traffic noise on communities in projects involving heavy vehicle management strategies.
7. CONCLUSIONS
The most significant environmental impact of increased night-time operation of road freight is an increase in the frequency of traffic-related noise events at night5. Practical schemes to reduce the number of heavy vehicles from an urban road corridor are difficult to achieve and expensive to implement. If, as in the case reported here, a major objectives of management is to reduce the effects of traffic noise on residents near a corridor, one would expect to be able to verify the success, or otherwise, of the traffic management by resulting changes in the noise exposure of adjacent residents.
This requires that the noise exposure is measured by scales which have two properties. Firstly, the scales must correlate with human response. Secondly, the noise scales must be sensitive to changes that are implemented. LA10 or LAeq are adopted because they are reasonable correlates of annoyance from road traffic noise, but in this study they were insensitive to changes that were achieved in the number of heavy vehicles using the study corridor by the heavy vehicle management strategies. An additional measure of noise exposure, the number of high level noise events in the traffic stream—a predictor of sleep awakenings from traffic noise—showed evidence of change as a result of the heavy vehicle management strategies. For the types of changes in the traffic flow examined in this study, conventional measures of road traffic noise are unlikely, by themselves, to tell the full story of potential benefits to communities in reducing noise effect from their implementation.
A further conclusion is that both the science and practice of measurement of noise events in road traffic streams need further development.
ACKNOWLEDGEMENTS
The work of R. Troutbeck and D. Pitts in the analysis of traffic data reported in Figure 1 and Table 1 is gratefully acknowledged.
REFERENCES
1 Austroads Vehicle Classification System. Retrieved 28 April, 2009 from
www.transport_network/facts_figures_traffic_pdfs/austroads_classes.pdf (undated)
2
Brown, A.L., Troutbeck, R. and Pitts, D. Logan Motorway Night Time Truck Trial - Evaluation Report Supplement. Prepared for Department of Main Roads. Metropolitan District, Queensland. (October, 2007).
2
Marks, A., Griefahn, B. and Basner, M. Event-related awakenings caused by nocturnal transportation noise. Noise Contr.Eng.J. 56 52-62 (2008).
4
Hall, F.L., Taylor, S.M. and Birnie, S.E. Activity interference and noise annoyance. Journal of Sound and Vibration103(2), 237-252 (1985).
5
Austroads. Strategies for Reducing the Environmental Impacts of Increased Night-Time Operation of Road Freight: A Scoping Study. AP-R315/07. Sydney, Austroads Incorporated (2007).