Is Cutting the GST
the Best Approach?
Is Cutting the GST
the Best Approach?
By Elena Simonova and Rock Lefebvre
Introduction ... 4
The GST – A Brief Recap ... 5
Do We Use the Knowledge We Have? ... 6
What are the Trends Outside Canada? ... 9
Is the GST Cut Good For All? ... 11
Executive Summary
Over the past two years, the government of Canada has reduced the GST rate by 2-percentage points bringing it down to 5% as of January 1, 2008. This tax measure rationally seems to be welcomed by the public and some public policy observers. In light of the on-going debate(s) regarding the levels, forms and complexity of taxation in Canada though, CGA-Canada set out to conduct an objective analysis of the rightness of the GST reduction. As the following pages reveal, it can be reasonably contended that:
Taxing consumption is one of the most economically effective methods of generating government revenues. At least eight independently undertaken research studies concluded
that consumption taxes impose the least level of distortions on households’ and businesses’ decisions regarding consumption, investment and participation in the labour market. For this reason, reducing consumption taxes yields the least optimal economic pay-off compared to other tax measures.
The growing importance of value-added taxation is the clearest tax policy trend in the
OECD countries. Canada, in contrast, is lagging behind other countries in relying on
value-added taxation. In 2005, Canada ranked 28th out of 30 countries in terms of the share value-added taxes represented within total tax revenue.
Reducing the GST rate will further diminish the importance of consumption taxes in Canada. As forecasted by the Department of Finance, GST revenues will matter even less
for the federal tax revenues in 2012 than they did in 1991 when the GST was first introduced. The other types of consumption taxes are not projected to compensate for the decline in the GST revenues either.
The GST cut does not bring a noticeable dollar value to households, but imposes certain extra costs on businesses. CGA-Canada estimates that the GST cut will bring the least
affluent 20% of Canadian families about $9 per month of extra cash. Even those who are in the fourth highest income quintile will benefit from only $27 of GST savings per family per month. Small businesses, which account for more than half of all Canadian companies, will face the highest relative cost of adjusting to the GST reduction.
Taking these assertions together, we wonder if the GST cut is the best approach to providing an estimated $34 billion of federal tax relief? Lowering consumption taxes creates little incentive for households to save or for business to invest, but may further increase household indebtedness which has been mounting in the recent years. Instead, focusing on reducing capital and income taxes that cause significant distortions for the economy seem to be more appropriate to Canadian needs.
Introduction
For a decade, the Canadian government has contentedly been closing its books in black. So much so that forecasting for a ‘planned surplus’ is becoming routine practice in the annual budget exercise. A myriad of research studies emphasize that Canada’s effective and marginal tax rates are among the highest when compared to other industrialized countries, and the commonly accepted notion of over-taxation is at risk of becoming normalized.
As might reasonably be accepted, Canadians now expect tax cuts and the government has become increasingly and rightfully preoccupied with tax and fiscal policy. This is good only in so far as meaningful tax reform is pursued, the best and most efficient forms of taxation are employed, and the initiative reflects economic reality. In short, it will fail disastrously if it is hunted solely for academic or political motive.
Most agree that paying taxes is not a pleasant matter and that there is nothing wrong with feeling good when a tax cut is introduced. In fact, CGA-Canada has long been advocating for far-reaching tax initiatives which lower personal and corporate income taxation. As with any policy measure, a tax reduction can be associated with economic and social costs and benefits. And an important question to ask is whether the benefits of a particular tax reduction outweigh the costs; and whether this measure improves our collective prosperity.
On October 30, 2007, the federal government announced a number of tax reduction measures to “bolster confidence and encourage investment”. A lion’s share of the total price tag of this package comes from a 1-percentage point reduction in the GST. There is hardly any doubt that the GST is one of the most visible and often paid taxes in Canada. It may as well be the most unpopular tax with anecdotal evidence suggesting that people feel more neutral to paying income taxes than the GST. Could we then hope that the GST cut represents that long-anticipated and advocated for broad-based tax relief? Will such a cut boost our economy and raise our productivity and competitiveness? We believe that the answer to both of these questions is “not quite”. This paper aspires to remove the emotional dimension to the GST reduction debate and to provide an objective analysis of the rightness of this measure. In doing so, we impart some research findings portraying economic costs and levels of distortion associated with alternate tax measures. We also contrast Canada’s modest reliance on consumption taxes with general trends prevailing in other industrialized countries. In search of a basis of conclusion, our discussion also presents estimates of the actual dollar value savings that Canadians may expect to experience as the result of a lower GST rate.
The GST – A Brief Recap
The Goods and Services Tax (GST) belongs to the group of taxes known as consumption taxes. The GST intends to tax final consumption and is levied only on the value added by respective businesses along the production and supply chain. Although the GST is collected at every stage of the business process, the seller of a product is eligible for a full rebate of the GST paid on goods and services used as inputs in the production and distribution process. This multi-staged design differentiates the GST from the sales tax which is collected only at the point of final sale. The list of goods and services subject to the GST is broad; however, some items are zero-rated or tax-exempt and no tax is collected on the final sale.1 Among these are basic groceries, agricultural
and fishery products, exports, most medical services and devices, prescription drugs, most financial and education services, and residential rents. The GST is a federal tax that is levied in all jurisdictions. However, three provinces – New Brunswick, Nova Scotia, Newfoundland and Labrador – use the Harmonized Sales Tax (HST) that combines the GST with the provincial sales tax.
The GST was first introduced on January 1, 1991 replacing the long-standing Manufacturer’s Sales Tax (MST) which was greatly criticized for its narrow tax base and complexity. The GST was viewed as a simpler, fairer, more visible and less distorting tax applied more equally across commodities. Since its introduction, though, the GST has become increasingly complex and can no longer be deemed to be simpler than the old manufacturers’ sales tax. Moreover, the GST is much broader based and many more individuals and companies have to deal with the complexities of the legislation than was the case with the tax that it replaced. There seem to be a general agreement that the complexity of compliance with the GST legislation – the proliferation of rulings, regulations and forms, is high.
The initial GST rate of 7% stood unchanged for more than 15 years before it was reduced by 1 percentage point effective July 1, 2006. The 2007 Economic Statement presented by the government in October 2007 brought in an additional 1% reduction effective January 1, 2008 pushing the GST rate to as low as 5%.
The GST is not the only consumption tax employed by the Canadian tax system; however, it is definitely the most important of the group. It accounted for more than two thirds (69.1%) of all federal consumption taxes collected in 2006. The relative importance of the GST has grown over the past two decades as government policy shifted emphasis from the use of consumption taxes on specific goods (e.g. excise duties on tobacco and alcohol) towards a higher reliance on general consumption taxes such as the GST.
1 For zero-rated goods/services, the seller may claim tax credits on associated inputs; for tax-exempt goods/services, the seller is not eligible to claim input tax credits
Do We Use the Knowledge We Have?
As taxpayers, we may be reluctant to grant a ‘good tax’ title to any tax we have to pay, but economists often see things differently. Three broad criteria are commonly used to distinguish ‘good’ taxes from ‘bad’ ones:
(i) Economic costs – the way the tax affects people’s behaviour and economic efficiency of allocating human and capital resources;
(ii) Social costs – how well the tax fares in terms of horizontal and vertical equity,2 fairness
and distribution of income; and,
(iii) Administrative and compliance costs – the burden the tax imposes on taxpayers and the government in order to comply with and collect the tax.
Naturally, ‘good taxes’ are those associated with relatively low costs to society.
The public policy debate invigorated by alleged flaws and failures of the Canadian tax system has covered extensively the issue of costs associated with different types of taxation.3 It would also
go beyond the intended scope of this paper to attempt to bring a truly original perspective to this discussion. It is however worth repeating some of the research findings regarding ‘good taxes’ vs. ‘bad taxes’ to better understand the unenthusiastic aspect of GST cuts.
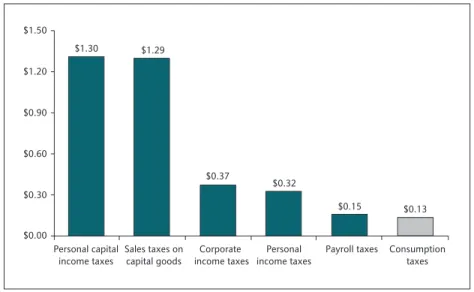
In 2004, Department of Finance Canada undertook a study that compared the impact of seven different tax measures on domestic welfare.4 The study looked at the degree to which changes
in the tax mix affect households’ and businesses’ decisions about consumption, investment and participation in the labour market. The measures were ranked based on the magnitude of improvement they bring to economic well-being; a concept that reflects our level of satisfaction with the amount of goods and services we consume and the amount of leisure time we have. The measures examined by the study included (i) a cut in personal capital income taxes, (ii) a cut in sales taxes on capital goods, (iii) a cut in corporate income taxes, (iv) a cut in personal income taxes, (v) a cut in payroll taxes, (vi) a cut in consumption taxes, and (vii) an increase in capital cost allowances on new capital. Surprising or not, the study found that reducing consumption taxes would bring the smallest improvement to the overall well-being of Canadians. For instance,
2 The concept of horizontal equity implies that individuals in similar circumstances pay similar amounts of tax whereas vertical equity corroborates that higher-income individuals pay a proportionally higher share of their income in taxes than do lower-income individuals. 3 See, for instance, Jason Clemens, Niels Veldhuis, Milagros Palacios, Tax Efficiency: Not All Taxes Are Created Equal, The Fraser
Institute, Studies in Economic Prosperity, Number 4, January 2007; Taxing Smarter for Prosperity, The Institute for Competitiveness and Prosperity, Working Paper 7, March 2005; Herbert G. Grubel, Unlocking Canadian Capital: The Case for Capital Gains Tax Reform, The Fraser Institute, 2000; Jonathan Kesselman, Flat Taxes, Dual Taxes, Smart Taxes: Making the Best Choices, Institute for Research on Public Policy, Policy Matters, Vol. 1, no. 7, November 2000
4 Maximilian Baylor, Louis Beauséjour, Taxation and Economic Efficiency: Results from a Canadian CGE Model, Department of Finance Canada, Working Paper 2004-10, November 2004
if the revenue coming from consumption taxes is reduced by $1 but is compensated from other sources5 (i.e. the total dollar amount of the government tax revenue is the same before and after
the tax cut), the economic well-being would rise by only $0.13. Instead, if the revenue from taxing personal capital income is reduced by $1, the economic well-being would improve by $1.3 (Figure 16). Hence, a cut in the GST yields the least optimal economic pay-off.
Furthermore, the study concludes that a cut in consumption taxes would have the lowest (compared to other measures) impact on the real GDP and stock of capital both in the short and long run, although it will increase consumption in the first years after the cut. On the other hand, measures such as lower income and capital taxes could create a larger positive impact on GDP and capital in the short run, and would outperform (over a period of 15 years) the spike in consumption due to lower consumption taxes.
When a tax cut triggers only a small change in economic well-being, such a tax is believed to have a small distorting effect on decisions of individuals and business and does not trigger diversion of capital and human resources from one type of economic activity to another. Such a tax may be viewed as efficient for the economy and is an effective method of generating government revenues. Following this logic and taking into account the results of the Department of Finance’s study, taxing consumption is one of the most effective ways of taxation. Six other
Figure 1 – Long-run Gains in Economic Well-being
Due to a $1 Reduction in Revenues From..
Source: Maximilian Baylor, Louis Beauséjour, Taxation and Economic Efficiency: Results from a Canadian CGE Model, Department of Finance Canada, Working Paper 2004-10, November 2004
$0.60 $0.90 $1.20 $1.50 $0.00 $0.30 $1.30 $1.29 $0.37 $0.32 $0.15 $0.13 Personal capital
income taxes Sales taxes oncapital goods income taxesCorporate income taxes Personal Payroll taxes Consumptiontaxes
5 For analytical purposes, the study assumed that the tax cut measures are revenue-neutral. This means that the revenue lost due to the tax cut is recovered through a behaviour non-distorting lump-sum tax
economic models7 used by different research studies also arrived to a conclusion that consumption
taxes are more efficient than labour taxes which, in turn, are more efficient than capital taxes. In addition to that, a study conducted by the International Monetary Fund in 20068 looked at
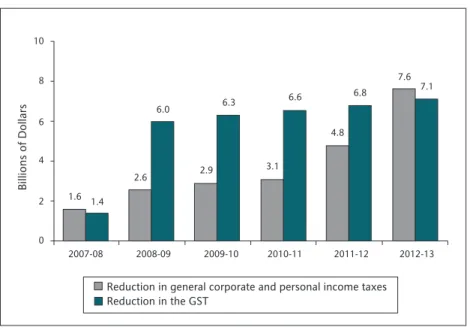
the efficiency gains from reducing not consumption taxes in general but the GST specifically. In line with other research findings, this study concluded that efficiency gains from GST cuts are relatively low. Moreover, a reduction in the GST leads predominantly to higher consumption, does not have a positive effect on private savings and investment, and has a short-term effect. As follows from the discussion above, the reduction in tax revenues triggered by lower consumption taxes brings less economic benefits than a similar loss in tax revenues due to lower income taxes. Interestingly, an opposing behaviour manifests itself in the tax relief measures announced by the federal government in October 2007.9 These measures put a higher priority on reducing taxes
that are considered by many to be the most efficient. For the next three fiscal years (2008-2009 to 2010-2011), the revenue losses triggered by the reduction in the GST will be at least twice as high as those resulting from cuts in personal and corporate income taxes (Figure 2). Moreover,
7 Maximilian Baylor, Ranking Tax Distortions in Dynamic General Equilibrium Models: A Survey, Department of Finance Canada, Working Paper 2005-06, April 2005
8 Canada: Selected Issues, International Monetary Fund, Country Report No. 06/229, June 2006
9 For the full list of tax relief measures see Strong Leadership. A Better Canada. Economic Statement, Department of Finance Canada, October 30, 2007
Figure 2 – Cost of Proposed Tax Reductions,
Selected Tax Measures
Source: Strong Leadership. A Better Canada. Economic Statement, Department of Finance Canada, October 30, 2007 4 6 8 10 0 2 1.6 2007-08 2008-09 2009-10 2010-11 2011-12 2012-13 1.4 2.6 6.0 2.9 6.3 3.1 6.6 4.8 6.8 7.6 7.1 Billions of Dollars
Reduction in general corporate and personal income taxes Reduction in the GST
10 The comparison was made for 23 OECD countries for which comparable data were available. Source: Consumption Taxes: the Way of the Future?, Organization for Economic Co-operation and Development, Policy Brief, October 2007 (p. 7)
11 Ranking is based on Revenue Statistics 1965-2006, Organization for Economic Co-operation and Development, 2007
12 Zhengxi Lin, Recent Trends in Taxes Internationally, Perspectives on Labour and Income, Vol. 2, no. 1, Statistics Canada, Catalogue no. 75-001-XIE, January 2001
13 Michael Keen, Ben Lockwood, The Value-Added Tax: Its Causes and Consequences, International Monetary Fund, Working Paper WP/07/183, July 2007
14 The United States has retained a sales tax system and does not levy value added taxes
15 Recent Tax Policy Trends and Reforms in OECD Countries, Organization for Economic Co-operation and Development, OECD Tax Policy Studies No. 9, 2004
16 Ranking is based on Revenue Statistics 1965-2006, Organization for Economic Co-operation and Development, 2007, CGA-Canada computation
the costs of the GST cuts amounts to more than half (57.6%) of the total $59.4 billion price tag of all proposed tax reduction measures.
What are the Trends Outside Canada?
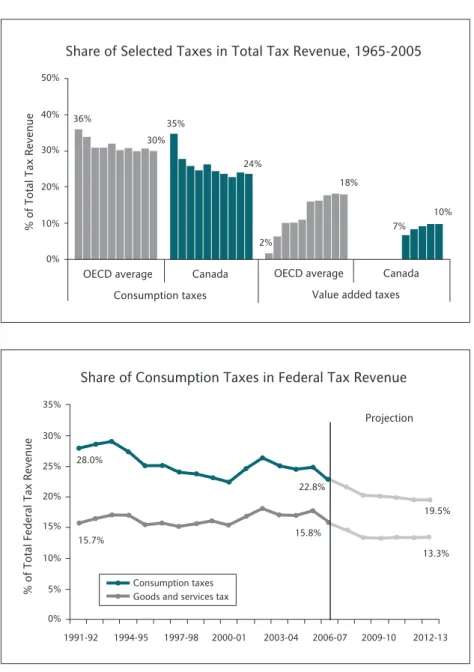
Some forty years ago, consumption taxes were more important as a source of tax revenue in the OECD countries than they are today. However, the large part of the decline occurred between 1965 and 1975, and since then, the reliance on consumption taxes remained rather stable (bar chart of Figure 3). Quoting one of the OECD publications, the stabilising share of consumption taxes shows that countries have become “more convinced of the advantages of taxing consumption”.10
Similar to the OECD, Canada’s reliance on consumption taxes saw a downward trend; however, the decline was more noticeable and persistent, pushing Canada’s ranking down to 25th place (out of 30 countries) in terms of the share of consumption taxes in the tax revenue of 2005.11
In fact, while Canada was going through a rapid expansion of taxation between 1980 and 1997, Canada’s consumption tax revenues (measured as a percentage of GDP) saw the second largest decrease amongst OECD countries.12
The GST, oftentimes know outside Canada as the Value-Added Tax (VAT), has arguably been one of the most often introduced taxes of the last forty years. Being levied in just a few countries in the early 1960s, it is currently employed in more than 130 countries and accounts for some 20% of the world’s tax revenue.13 VAT has become the main form of consumption tax in all but one14
of the OECD countries.
More interesting though, is the extent to which other countries rely on revenues from the VAT. In 2005, the OECD average share of the VAT reached 18.2% of the total taxation after a remarkable growth from as low as 1.7% in 1965 (bar chart of Figure 3). The growing importance of the VAT represents one of the clearest trends in the changing balance between different components of the tax revenues of industrialized countries.15 Canada, in turn, has been lagging behind in increasing
the use of the VAT and ranked 28th among the other OECD countries in terms of the contribution the VAT (i.e. GST) makes to the total tax revenue.16
Figure 3 – Consumption Taxes and Tax Revenue
Notes: Bar chart representation for Canada consists of 1990-2005 data. Graph representation recognizes consumption taxes as excise taxes and duties.
Source: Bar chart: Revenue Statistics 1965-2006, Organization for Economic Co-operation and Development, 2007, CGA-Canada computation. Graph: Fiscal Reference Tables, September 2007, Department of Finance Canada; Strong Leadership. A Better Canada. Economic Statement, Department of Finance Canada, October 30, 2007; CGA-Canada computation
36% 30% 35% 24% 2% 18% 10% 7% Canada OECD average
Value added taxes Canada
OECD average
Consumption taxes
% of Total Tax Revenue
50% 40% 30% 20% 10% 0%
Share of Selected Taxes in Total Tax Revenue, 1965-2005
Share of Consumption Taxes in Federal Tax Revenue
Projection 28.0% 22.8% 19.5% 15.7% 15.8% 13.3% Goods and services tax
Consumption taxes
% of Total Federal Tax Revenue
30% 20% 5% 0% 10% 35% 25% 15% 1991-92 1994-95 1997-98 2000-01 2003-04 2006-07 2009-10 2012-13
For Canada’s federal government, the GST is the third most important source of tax revenue. Although reliance on the GST has been slowly growing in the 1990s and early 2000s, the recent tax cuts will alter the scenario. As forecasted by the Department of Finance, the GST revenues will matter even less for the federal tax revenues in 2012-13 than they did in 1991-92 when the GST was first introduced (graph of Figure 3). The other types of consumption taxes are not projected to compensate for the decline in the GST revenues either. Instead, by the fiscal year 2012-13, 62.5% of Canada’s federal tax revenues will come from personal income taxes, a 7-percentage point increase over 2006. A higher reliance on less effective forms of taxation (i.e. income taxes) erodes incentives for investment, savings, work and entrepreneurship, and may bring negative implications for Canada’s international competitiveness.
17 Spending Patterns in Canada 2006, Statistics Canada, Catalogue no. 62-202-X; CGA-Canada computation
Is the GST Cut Good For All?
The concepts of ‘economic well-being’ and ‘efficiency costs’ may sound abstract and intangible while a lower GST rate may feel like a win-win situation for both households and businesses. As consumers, we pay less every time we shop, thus we can buy more with the extra cash and businesses should be cheerful as their sales increase. Or, is this really so?
Household perspective
The reduction in the GST benefits only those who spend, and spend on items that are GST taxable. For instance, no GST is paid on most of the food products, mortgage and other debt payments, house and car insurances, health expenses and child care. Altogether, these expenses may amount to a noticeable share of the day-to-day household spending.
Moreover, the level of household income has a strong influence on the proportion of the family budget dedicated to the basic necessities such as food and shelter. For instance, food alone accounts for 16% of total spending of the least advantaged households. This proportion drops down to 8% for a household in the highest income quintile.17
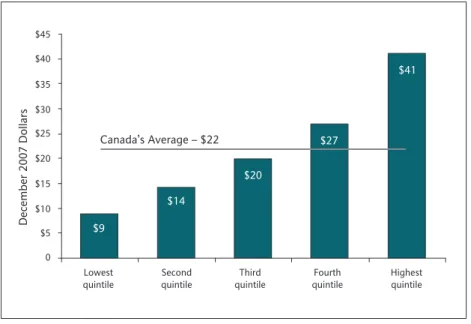
Using as a starting point the pattern and level of household spending in 2006, we estimated savings of a household due to a 1% reduction in the GST rate (see Technical Note on page 15 for more details on the methodology of the estimate). According to our estimates, the GST cut will bring the least affluent 20% of Canadian families about $9 per month of extra cash in their pockets. The savings do not become much more noticeable even for those who are in the fourth highest income quintile. Those households will benefit from additional $27 per family per month – less than an extra dollar a day (Figure 4).
There is no doubt that households planning a large purchase will have a more substantial saving due to the lower GST. As the federal government indicated in its tax cut announcement, a family buying a new $300,000 home will save $3,840 in GST and may save additional $600 when buying a $30,000 new car.18 It is useful to keep in mind, though, that only about 1.7% of households
purchased a new house in 2006 and some 6.5% of Canadian families bought a new car that year.19
Business perspective
Overall, businesses seem to view the GST cut as a positive measure. According to a survey conducted by the Canadian Federation of Independent Business (CFIB), 51% of the CFIB’s members assign a high priority to lowering GST/HST if the federal government was to reduce taxes.20 Furthermore, business owners gave a higher priority to reducing the GST than to cuts
in corporate income taxes and EI premiums.
Figure 4 – Estimated Monthly Household Savings
Due to a 1% Reduction in the GST Rate,
Average by Total Income Quintile
Note: Each income quintile represents one-fifth of all Canadian households. Quintiles are formed by ranking households in ascending order of the total household income and dividing them into five groups of equal number.
Source: Spending Patterns in Canada 2006, Statistics Canada, Catalogue no. 62-202-X (Text table 2); CANSIM Tables 203-0002, 203-0003, 203-0004, 203-0007, 203-0012, 203-0015, 326-0020, CGA-Canada computation Lowest quintile $9 December 2007 Dollars $14 $20 $27 $41 Canada’s Average – $22 $45 0 $40 $35 $30 $25 $20 $15 $10 $5 Second
quintile quintileThird quintileFourth Highestquintile
18 Canada’s Government Delivers Broad-Based Tax Relief for Individuals, Families and Businesses, Department of Finance Canada, News Release 2007-083, October 30, 2007
19 CGA-Canada estimates based on CANSIM Tables 027-0009, 079-0001, and 203-0001
Notwithstanding this optimism, there is a certain business cost associated with the GST reduction. This includes updating sales equipment, adjusting business software for changes in taxable benefits and input tax credits calculations. According to the CFIB, “the smaller the business the higher the adjustment cost” and companies with fewer than 5 employees will face the highest relative cost of adjusting to the GST reduction.21 It is a well known fact that Canadian businesses
are primarily small and medium size enterprises. Companies with 1 to 4 employees constitute more than half (56.5% in 2005) of all employer business establishments, and another 17% of companies employ between 5 and 9 employees.22 This may mean that a significant proportion
of Canadian business will have a relatively high fixed cost associated with lowering the GST. Summing up the discussion above, several points seem to be of particular importance. First, a number of independently undertaken research studies concluded that taxing consumption is one of the most economically effective methods of generating government revenues. Second, a large number of countries have introduced the value-added taxation in the past decades and the growing importance of this source of revenue is the clearest tax policy trend in the OECD countries. Third, Canada seems to be moving in the opposite direction to the logic of research findings and the prevailing trend in other countries which may only further erode Canada’s already questionable international competitiveness. Fourth, even if all the arguments above are disregarded, the GST cut does not seem to bring a noticeable dollar value to households, but will impose certain extra costs on business, particularly small ones. Taken together, we wonder if Canadians see the sense of clawing back $34.2 billion on a tax cut whose ultimate benefits are so comparatively modest.
Closing Comments
Lowering consumption taxes creates little incentive for household to save or for business to invest. To the contrary, lower consumption taxes may further increase household indebtedness as the large-scale purchases (which also bring the most savings in the GST) are often made through credit. And the notion of increased demand, which should be a good incentive for business to expand, may also be illusive. The strong Canadian dollar makes imported goods more attractive to consumers and the increased Canadian demand may well be absorbed by foreign producers. Instead, focusing on reducing capital and income taxes that cause significant distortions for the economy seem to be more appropriate to Canadian needs. As stated in CGA-Canada’s 2007
21 Doug Bruce, Lucie Charron, GST Transition: Results of CFIB Survey on GST Rate Reduction, Canadian Federation of Independent Business, April 2006
22 How Many Businesses Are There in Canada? Key Small Business Statistics – January 2006, Small Business Research and Policy, Industry Canada. Available at: http://www.ic.gc.ca/epic/site/sbrp-rppe.nsf/en/rd01832e.html, accessed November 17, 2007.
pre-budget submission,23 Canada needs a real tax reform that creates a simple, transparent
and fair tax system with low, internationally competitive tax rates on personal and corporate income.
Although the GST is not deemed to be an appropriate tool for improving Canada’s tax policy, the unpopularity of this tax, multi-year history of the federal budget surpluses, and Canada’s strong economic standing make the reverse of the GST cut a highly unlikely event. To somewhat smoothen the possible negative consequences of lowering the GST, it may be timely to revisit the reasonability of harmonizing provincial sales taxes with the GST.
This measure could eliminate retail sales taxes on business inputs and capital goods such as machinery and equipment, and reduce the rate of taxation on new investment. Currently, five out of ten Canadian provinces - British Columbia, Alberta, Saskatchewan, Manitoba and Ontario – continue taxing capital through the application of sales taxes.
23 Paving the Way to Prosperity: It’s Time for Real Tax Reform, A Submission to the House of Commons Standing Committee on Finance and the Minister of Finance, CGA-Canada, September 2007. Available at www.cga.org/canada
Technical Note on Methodology of Estimating
Household Savings From a 1% GST Reduction
The estimates of the household monthly savings due to the GST reduction are derived using data from 2006 Survey of Household Spending conducted by Statistics Canada in January-April, 2007. The analysis combines two sets of data available from the survey. The first set contains data on average annual household spending broken down into different levels of aggregation (CANSIM Tables 203-0001 through 203-0015). This data shows the amounts of spending for all households disregarding the differences in the level of their income. The second set of data provides information on household average annual spending by income quintiles; however, this data is published only for summary-level spending groups (Spending Patterns in Canada, Text table 2).
Two data manipulations were made to estimate average annual spending on GST-taxable items made by households in different income quintiles in 2006. First, some adjustments were introduced to the Canada’s average household spending in order to estimate spending on goods and services that are subject to the GST (hereon, GST-related spending). The second data manipulation estimated average GST-related spending made by households in different income quintile. Statistics Canada reports current household consumption as a sum of fourteen summary-level spending groups. To identify the part of household consumption that is GST-related, the following adjustments were made to the spending groups:
Summary-level
Adjustment Spending Group
Food Only food purchase from restaurants was included
Shelter Only following expenditures were included: (i) tenants’ maintenance, repairs and alterations, (ii) repairs and maintenance for owned living quarters, (iii) water, fuel and electricity for principal accommodation, (iv) repairs and maintenance for owned vacation home, Electricity, water and fuel for owned vacation home, (v) travel accommodation
Household operations Child care expenses were excluded Household furnishings and No adjustment
equipment
Average annual GST-related household spending was then computed as a sum of the adjusted summary-level spending groups.
To estimate average annual GST-related spending of households in different income quintiles, it was assumed that within each summary-level spending group, households in each income quintile spend an identical proportion on GST-related items as on all items in that category. For instance, if spending on food of households in lower quintile accounts for 53% of the Canada’s average spending on food, the GST-related spending on food (i.e. food purchased from restaurants) will also constitute 53% of Canada’s average spending on food purchased from restaurants.
The results obtained for 2006 were adjusted for inflation using the consumer price index (CPI) for corresponding commodity groups for the period between June 2006 and December 2007. Household savings from the GST reduction were computed as a difference between the GST paid at 6% and 5% rate.
Summary-level Adjustment Spending Group
Transportation Following expenditures were excluded: (i) drivers’ licences and tests, (ii) private and public vehicle insurance premiums, (iii) registration fees
Health care This group was excluded
Personal Care No adjustment
Recreation No adjustment
Reading materials and No adjustment other printed matter
Education Only following expenditures were included: (i) educational supplies, (ii) textbooks
Tobacco products and No adjustment alcoholic beverages
Games of chance (net) This group was excluded
Miscellaneous expenditures Only following expenditures were included: (i) expenses on other property owned, (ii) tools and equipment purchased for work, (iii) other miscellaneous goods and services
References
1. Canada: Selected Issues, International Monetary Fund, Country Report No. 06/229, June 2006 2. Canada’s Government Delivers Broad-Based Tax Relief for Individuals, Families and
Businesses, Department of Finance Canada, News Release 2007-083, October 30, 2007 3. Consumption Taxes: the Way of the Future?, Organization for Economic Co-operation and
Development, Policy Brief, October 2007
4. Doug Bruce, Lucie Charron, GST Transition: Results of CFIB Survey on GST Rate Reduction, Canadian Federation of Independent Business, April 2006
5. Doug Bruce, Tax Directions: Results of CFIB Survey on Federal Tax Policy, Canadian Federation of Independent Business, January 2005
6. Fiscal Reference Tables, September 2007, Department of Finance Canada
7. Herbert G. Grubel, Unlocking Canadian Capital: The Case for Capital Gains Tax Reform, The Fraser Institute, 2000
8. How Many Businesses Are There in Canada? Key Small Business Statistics - January 2006, Small Business Research and Policy, Industry Canada. Available at: http://www.ic.gc.ca/epic/ site/sbrp-rppe.nsf/en/rd01832e.html, accessed November 17, 2007
9. Jason Clemens, Niels Veldhuis, Milagros Palacios, Tax Efficiency: Not All Taxes Are Created Equal, The Fraser Institute, Studies in Economic Prosperity, Number 4, January 2007
10. Jonathan Kesselman, Flat Taxes, Dual Taxes, Smart Taxes: Making the Best Choices, Institute for Research on Public Policy, Policy Matters, Vol. 1, no. 7, November 2000 11. Maximilian Baylor, Louis Beauséjour, Taxation and Economic Efficiency: Results from
a Canadian CGE Model, Department of Finance Canada, Working Paper 2004-10, November 2004
12. Maximilian Baylor, Ranking Tax Distortions in Dynamic General Equilibrium Models: A Survey, Department of Finance Canada, Working Paper 2005-06, April 2005
13. Michael Keen, Ben Lockwood, The Value-Added Tax: Its Causes and Consequences, International Monetary Fund, Working Paper WP/07/183, July 2007
14. Paving the Way to Prosperity: It’s Time for Real Tax Reform, A Submission to the House of Commons Standing Committee on Finance and the Minister of Finance, CGA-Canada, September 2007. Available at www.cga.org/canada
15. Recent Tax Policy Trends and Reforms in OECD Countries, Organization for Economic Co-operation and Development, OECD Tax Policy Studies No. 9, 2004
16. Spending Patterns in Canada 2006, Statistics Canada, Catalogue no. 62-202-X
17. Strong Leadership. A Better Canada. Economic Statement, Department of Finance Canada, October 30, 2007
18. Submission to the Honourable Jim Flaherty, Minister of Finance for Canada by Mark Mullins, Executive Director, The Fraser Institute, 2006
19. Supply Manual, Annex 6.10: List of GST/HST – Exempt Supplies, Version 07-2, Public Works and Government Services Canada, November 30, 2007
20. Taxing Smarter for Prosperity, The Institute for Competitiveness and Prosperity, Working Paper 7, March 2005
21. Tax Expenditures and Evaluations, Department of Finance Canada, 2004
22. Zhengxi Lin, Recent Trends in Taxes Internationally, Perspectives on Labour and Income, Vol. 2, no. 1, Statistics Canada, Catalogue no. 75-001-XIE, January 2001