Assessing Green Microfinance
Qualitative and quantitative indicators for
measuring environmental performance
TABLE OF CONTENTS
Summary
1
1. What is green microfinance?
2
2. Qualitative green microfinance indicators
3
3. Quantitative green microfinance indicators
6
3.1 FORMAL ENVIRONMENTAL POLICY 7
3.2 CHANGE IN ELECTRICITY CONSUMPTION 7
3.3AWARENESS-RAISING AND TRAINING ACTIVITIES FOR CLIENTS AND THE COMMUNITY 8
3.4ENVIRONMENTAL RISK ASSESSMENT DURING LOAN APPLICATION 10
3.5ENVIRONMENTAL RISK ASSESSMENT OF OUTSTANDING LOANS 11
3.6GREEN LOANS 12
3.7MICRO-INSURANCE TO INCREASE ENVIRONMENTAL RESILIENCE 14
3.8 SUMMARY OF GREEN PRACTICES AND INDICATOR APPRECIATION 15
4. Conclusions
16
Authors
17
Annex I: Case Study - Virl
18
SUMMARY
This paper is the first attempt in the microfinance sector to address the area of environmental – or green – performance monitoring in a comprehensive way. It begins with an overview of the qualitative green performance indicators available to microfinance institutions (MFIs) that wish to assess their green management performance, track progress over time, and identify current and future trends. The tools that are presented here include MIX’s green performance indicators, the Green Index, the Green Performance Agenda, and the forthcoming Progress out of Energy Poverty Index.
The paper then sheds light on the fact that, while the sector abounds with a diverse set of qualitative tools for green performance monitoring, it falls short when it comes to quantitative measures. The second part elaborates on a survey designed by MIX and a subgroup of the European Microfinance Platform (e-MFP) Microfinance & Environment Action Group that explores quantitative green microfinance indicators in the areas of environmental strategy, internal and
external risk management, and green opportunities with the aim of assessing their ease of use and relevance for decision making. The findings from a sample of 87 MFIs that participated in the survey reveal that data on green loans is the easiest indicator to track, followed by the environmental footprint of an MFI’s operations. Tracking awareness-raising and training activities for clients and the community comes in third place, while monitoring the environmental risk of loans pre- or post-disbursement was identified as the most challenging area to track.
The paper concludes that (1) a comprehensive interpretation of quantitative figures often goes hand-in-hand with qualitative information, (2) an important gap persists between the usefulness of an indicator and an MFI’s capacity to track it, and (3) institutions do not always have sufficient incentives to track indicators even when they have the capacity to do so. It also offers strategic recommendations for facilitating the integration of green quantitative microfinance indicators into reporting standards.
1. WHAT IS GREEN MICROFINANCE?
“Green microfinance” refers broadly to the practice of weaving the principles of environmental sustainability into the daily operations of microfinance institutions (MFIs) and promoting environmentally-friendly practices and solutions. While green microfinance is often associated with microloans for clean energy solutions, for instance solar home systems or improved cooking stoves, MFIs have the option of implementing a broad spectrum of green strategies, ranging from “do not harm” policies to “positive environmental impact” initiatives at the portfolio and institutional levels. In fact, four different types of strategies, or essential practices, can be distinguished: managing internal environmental risk; managing external environmental risk; fostering green opportunities; and adopting a formal environmental strategy (Table 1).
Given the increasing responsibility of the microfinance sector to meet the Sustainable Development Goals (SDGs) of the Post-2015 Development Agenda that are related to the environment,1 it is essential for microfinance stakeholders to gain access to a set of tools and resources that allows them to monitor their environmental impact. This study aims to contribute to this objective, beginning with an overview of the qualitative green performance indicators currently available to MFIs (Section 2). It then presents the findings of the first comprehensive survey designed to test and identify a set of green quantitative indicators for institutions to measure their green outreach and outcomes (Section 3). Finally, upon summarizing the main takeaways, it offers a strategic “way forward” to facilitate the progressive integration of green quantitative microfinance indicators into reporting standards (Section 4).
1
The complete of SDGs can be consulted here: <https://sustainabledevelopment.un.org/post2015>. Last accessed on November 9th, 2015.
Table 1: Essential practices for green microfinance Managing internal environmental risks
The MFI works to actively reduce the ecological footprint of its head and branch offices by setting mechanisms to manage paper, water and energy consumption, reduce or treat wastes, or reduce carbon emissions linked to transportation. It usually requires efforts in raising staff awareness of good practices. Commonly, this is the MFI’s first step when making its foray into environmental management. However, the MFI’s internal ecological footprint is not limited to its physical offices: most of its environmental impacts are indirect and are linked to the portfolio of financed activities.
Managing external environmental risks
The MFI seeks to reduce the environmental risks of the activities financed through its products. For this purpose, the MFI can decide whether to use an exclusion list, condition access to a subsequent loan with the aim of reducing environmental risks, or raise client awareness on mitigation solutions.
Fostering green opportunities
The MFI aims to generate positive environmental impacts by offering specific financial or nonfinancial services to promote environmentally-friendly businesses (such as recycling activities), practices (like agro-forestry, use of organic fertilizers and seeds) or the acquisition of clean energy technologies (solar photovoltaic solutions, bio-digesters, improved cooking stoves, efficient fridges, among others).
Formal environmental strategy
Encompassing any or all of the three strategies above, the MFI can also integrate environmental issues at a strategic level by embedding environmental concerns in its mission or vision, adopting a formal environmental policy, appointing a person to manage environmental issues, reporting on environmental performance, etc.
2. QUALITATIVE GREEN MICROFINANCE
INDICATORS
MFIs have access to an array of qualitative green microfinance indicators that help them assess their green management performance, track progress over time and gain a broad overview of current and future trends of green performance integration into MFIs’ operations and strategy. Below is a brief description of some of the available tools.
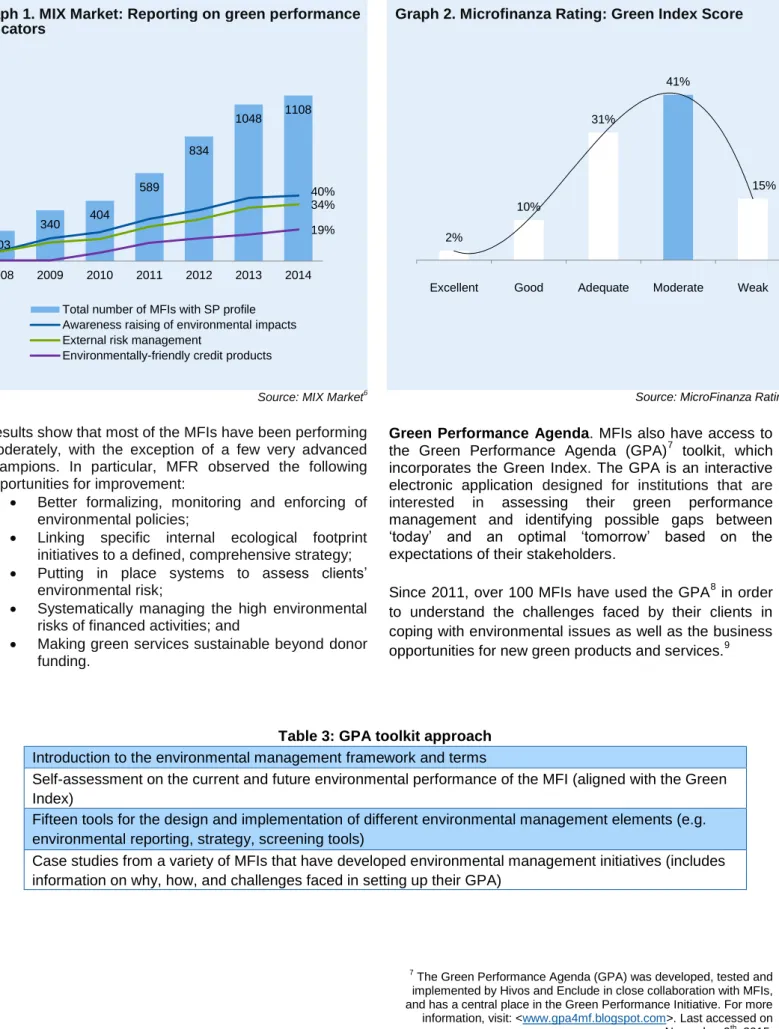
MIX’s Green Performance Indicators. MIX has been
collecting green qualitative performance indicators since 2009,2 which are available on its platform, MIX Market. To date, this platform includes the largest available dataset of green microfinance performance data and, more broadly, of social performance (SP) data. MIX Market allows MFIs, funders and researchers to benchmark institutions by peer groups, as well as to observe trends. Graph 1 shows the historical trend of MFIs in terms of awareness raising of environmental impacts, external risk management and offering of green financial products vis-à-vis evolution of SP reporting in MIX Market between fiscal year (FY) 2008 and FY 2014.3
2
In March 2015, MIX slightly modified its set of SP indicators, including green performance indicators. Old SP reports have been transferred into to the new format.
3 Graph 1 assumes that (1) an MFI has a procedure to manage the
external environmental risk if it answered positively to indicators 2 and/or 3 in Table 2 and that (2) an MFI offers environmentally-friendly credit products if it reported at least one of the four credit products under indicator 4 in Table 2.
Green Index. MFIs and other practitioners can also use
the Green Index4 to assess their current environmental performance in terms of the policies and processes that they have in place. The tool consists of a list of 23 qualitative questions linked to 11 indicators, and is built along four essential practices and three standards: (1) formal environmental strategy, (2) internal and external environmental risk management and (3) fostering green opportunities. Since February 2014, the Green Index has been featured in the CERISE Social Performance Indicators (SPI4) assessment tool as an optional section. Moreover, MicroFinanza Rating (MFR), who has already been reviewing the Green Index areas of MFIs since 2007, incorporated the full list of specific Green Index indicators into its Social Rating methodology in 2015. Graph 2 presents the Green Index overall performance from a sample of 172 MFR’s Social Ratings across 47 countries between 2007 and 2015. 5
4
The Green Index results from a collaborative work between various organizations and experts. It was presented in October 2014 by the European Microfinance Platform (e-MFP) Microfinance & Environment Action Group and will be improved after the current testing phase. For more information, see: <www.pamiga.org/userfiles/green%20index.pdf>. Last accessed on November 9th, 2015. 5 The Green Index results are obtained by mapping the environmental
performance indicators used in MFR’s Social Ratings from 2007 to 2015 to the Green Index indicators integrated in the MFR’s Social Rating methodology starting from 2015 and back-testing the environmental performance results according to the Green Index structure. For more information, please refer to the Insight on Environment Rating available here: <www.microfinanzarating.com/images/stories/Insight_Environment_Rati
ng_Sep_2013.pdf>. Last accessed on November 9th, 2015.
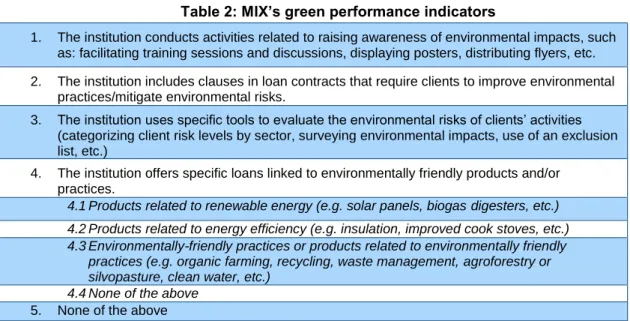
Table 2: MIX’s green performance indicators
1. The institution conducts activities related to raising awareness of environmental impacts, such as: facilitating training sessions and discussions, displaying posters, distributing flyers, etc. 2. The institution includes clauses in loan contracts that require clients to improve environmental
practices/mitigate environmental risks.
3. The institution uses specific tools to evaluate the environmental risks of clients’ activities (categorizing client risk levels by sector, surveying environmental impacts, use of an exclusion list, etc.)
4. The institution offers specific loans linked to environmentally friendly products and/or practices.
4.1 Products related to renewable energy (e.g. solar panels, biogas digesters, etc.) 4.2 Products related to energy efficiency (e.g. insulation, improved cook stoves, etc.) 4.3 Environmentally-friendly practices or products related to environmentally friendly
practices (e.g. organic farming, recycling, waste management, agroforestry or silvopasture, clean water, etc.)
4.4 None of the above 5. None of the above
Source: MIX Market6 Results show that most of the MFIs have been performing moderately, with the exception of a few very advanced champions. In particular, MFR observed the following opportunities for improvement:
Better formalizing, monitoring and enforcing of environmental policies;
Linking specific internal ecological footprint initiatives to a defined, comprehensive strategy;
Putting in place systems to assess clients’ environmental risk;
Systematically managing the high environmental risks of financed activities; and
Making green services sustainable beyond donor funding.
Source: Microfinanza Rating
6
The complete list of social and financial indicators publicly available on MIX Market is accessible here: <reports.mixmarket.org>. Last accessed on November 9th, 2015.
Green Performance Agenda. MFIs also have access to the Green Performance Agenda (GPA)7 toolkit, which incorporates the Green Index. The GPA is an interactive electronic application designed for institutions that are interested in assessing their green performance management and identifying possible gaps between ‘today’ and an optimal ‘tomorrow’ based on the expectations of their stakeholders.
Since 2011, over 100 MFIs have used the GPA8 in order to understand the challenges faced by their clients in coping with environmental issues as well as the business opportunities for new green products and services.9
7
The Green Performance Agenda (GPA) was developed, tested and implemented by Hivos and Enclude in close collaboration with MFIs, and has a central place in the Green Performance Initiative. For more information, visit: <www.gpa4mf.blogspot.com>. Last accessed on November 9th, 2015. 8
The Hivos Triodos Fund supported many of these institutions.
9
See Annex I for a case study of a Zimbabwean MFI that has used the GPA to better understand its internal and external focus on environmental impact.
Graph 1. MIX Market: Reporting on green performance indicators
Graph 2. Microfinanza Rating: Green Index Score
2%
10%
31%
41%
15%
Excellent Good Adequate Moderate Weak
Table 3: GPA toolkit approach
Introduction to the environmental management framework and terms
Self-assessment on the current and future environmental performance of the MFI (aligned with the Green Index)
Fifteen tools for the design and implementation of different environmental management elements (e.g. environmental reporting, strategy, screening tools)
Case studies from a variety of MFIs that have developed environmental management initiatives (includes information on why, how, and challenges faced in setting up their GPA)
Source: MicroFinanza Rating
203 340 404 589 834 1048 1108 40% 34% 19% 2008 2009 2010 2011 2012 2013 2014
Total number of MFIs with SP profile Awareness raising of environmental impacts External risk management
MFIs that used the GPA to assess their current and desired green performance recognize that they have room for improvement, though not all of them strive for a fully-integrated approach. Many MFIs see the benefit from an increased focus on environmental issues and have a strategic interest in developing green products and services for their clients. The graph below summarizes the results of the GPA assessment among 21 Eastern and Southern African MFIs, revealing the gap between their green performance in 2015 and their aspiration goals.
Progress out of Energy Poverty Index. While MFIs that are searching for possible environmental strategies to implement can use the Green Index and the GPA, MFIs and funders that are interested in easily and effectively tracking the impact of financial and energy inclusion programs will soon be able to avail of the forthcoming Progress out of Energy Poverty Index (PEPI).10 The PEPI uses a concise metric to reflect the multidimensionality of energy access at the household level in terms of availability, safety, reliability, quality, affordability, legality, and convenience. Through its implementation, the PEPI will support MFIs to (1) identify the energy needs of its clientele in order to tailor green microfinance programs aimed at addressing energy inclusion through clean energy technologies, (2) measure the impact of energy lending programs, and (3) monitor and assess technology effects in improving specific attributes of energy access. In 2015, the Colombian MFI Corporación Nariño Empresa y Futuro (Contactar) actively collaborated on the development and testing of the PEPI, enabling data collection from its clientele for energy poverty measurements. Annex II presents in detail Contactar’s work towards a full integration of green performance into its strategy and operations since 2011.11
10
The PEPI is the result of a case study coordinated by Natalia Realpe Carrillo and supported by University Meets Microfinance (UMM), the consulting companies MicroEnergy International GmbH and Positive Planet and the Colombian MFI Corporación Nariño Empresa y Futuro (Contactar). The tool is expected to be available early 2016.
11
Contactar was also one of the semi-finalists of the 5th European Microfinance Award on Microfinance and the Environment. For more information on the 10 awardees, please consult the e-MFP European Dialogue N°7 here:< www.e-mfp.eu/sites/default/files/resources/2015/04/European_Dialogue_No7_ web.pdf>. Last accessed on November 9th, 2015.
Graph 3. GPA: Green performance – today and
tomorrow Source: Enclude 0% 20% 40% 60% 80% 100% Environmental Strategy and Internal Risks Management External Risks Management Green Opportunities Today Tomorrow
3. QUANTITATIVE GREEN MICROFINANCE
INDICATORS
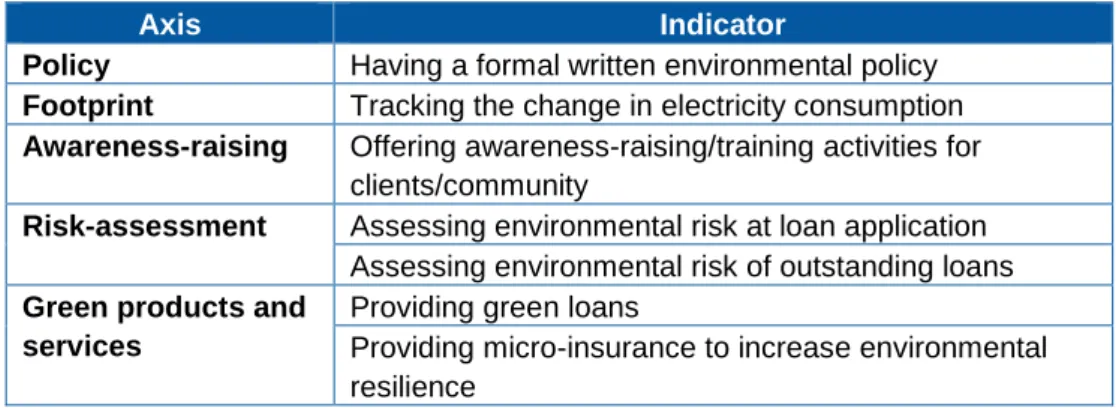
To date, MFIs that aim to track the outcome and outreach of their green performance lack a set of established metrics that is standardized across the sector.12 To address the paucity in quantitative indicators, MIX and a subgroup of the European Microfinance Platform (e-MFP) Microfinance & Environment Action Group designed a survey that explores quantitative green microfinance indicators relative to five axes that align broadly with the Green Index (Table 4) with the aim of assessing their ease of use and relevance for decision making.
Invitations to take part in this survey were sent to representatives of 204 MFIs that had reported to MIX, or were already known for, implementing at least one type of environmental practice.13 The sample is thus representative of “greener than average” MFIs and therefore is not representative of the global microfinance sector. After checking for duplicate entries and dubious results, the findings presented are based on 87 complete
12
Tools such as the Climatescope are not specifically designed for the microfinance sector.
13 Most of the MFIs were selected from the list of institutions that had
participated in MIX’s SP Desk Review process and that had reported at least one of MIX’s green performance indicators. A smaller group was selected based on contributors’ knowledge in the frame of their work. More information about MIX’s SP Desk Review process is available here: <www.mixmarket.org/sites/default/files/mix_desk_review_brochure.pdf>. The complete list of MFIs that participated in MIX’s SP Desk Review process is accessible here: <http://www.mixmarket.org/about/social_performance_validation>. Last accessed on November 9th, 2015.
surveys from Latin America and The Caribbean (28%), Eastern Europe and Central Asia (24%), South Asia (24%), East Asia and the Pacific (11%), Sub-Saharan Africa (8%) and Middle East and North Africa (5%). For each indicator, the findings from the survey are organized as follows: (1) survey question(s), (2) summary of findings captured in graphs and tables, (3) short descriptive analysis of the results, and (4) interpretation of the probed indicator and proposed changes, if any are available. Additionally, we deepened our analysis by looking at how the likelihood of having a given green process, product or service in place relates to other financial and qualitative information collected by MIX (for instance the MFI’s scale and outreach).14
Results are reported only for those activities for which the statistical analysis revealed a significant influence of one of these variables.
14
We used a logit regression model for the probability that an MFI conducts the described activities. Financial data and qualitative information published on MIX Market relative to the 87 institutions in our sample were used as predictor.
Table 4: Green activities and indicators considered for the research
Axis Indicator
Policy Having a formal written environmental policy
Footprint Tracking the change in electricity consumption
Awareness-raising Offering awareness-raising/training activities for clients/community
Risk-assessment Assessing environmental risk at loan application Assessing environmental risk of outstanding loans
Green products and services
Providing green loans
Providing micro-insurance to increase environmental resilience
3.1
Formal Environmental Policy
Does your institution have a formal written environmental policy?
Survey findings. While having a formal environmental
policy is one of the four essential practices of green microfinance, as is put forth in Section 1, the survey reveals that a formal written environmental policy is neither a sufficient nor a necessary condition for engaging in the provision and tracking of green activities. Indeed, out of the 66% of respondents that have such a policy,
8% do not engage in any of the activities and product offering tested. Conversely, one third of the institutions without a formal environmental policy do engage in three or more of the activities detailed below. The statistical analysis also revealed that smaller institutions are less likely to have a formal environmental policy.
3.2
Change in Electricity Consumption
Does your institution track the percentage of reduction in electricity consumption at your headquarters and branches on a yearly basis?
If you answered "Yes" to the previous question, please report the percentage of reduction in electricity consumption at your headquarters and branches between FYE13 and FYE14. Do you find this data to be easy to track and/or useful for decision making?
Graph 4. MFIs that track/report changes in electricity consumption
Graph 5. Tracking changes in electricity consumption: easy and/or useful?
Indicator Average Obs.
Percentage reduction in electricity consumption at headquarters between FYE13 and
FYE14 5.43 % 16
Percentage reduction in electricity consumption at branches between FYE13 and FYE14 4.33 % 15
18% 6%
76%
Tracks Does not track
Reported Did not report 6%
38% 11%
45%
Neither easy to track nor useful for decision making Useful for decision making, but
not easy to track Easy to track, but not useful for
decision making Both easy to track and useful for
Survey findings. About 24% of respondents claimed to track the percentage of reduction in electricity consumption at their headquarters (HQ) and branches on a yearly basis, and 18% provided either a figure or offered an explanation for any observed change. The average change is a decrease of 5.4% in the HQ and of 4.3% in branches.
Interpretation of the indicator and proposed changes.
While interesting, the survey results could lead to erroneous conclusions. For instance, a reduction in electricity consumption might be due to a scale down of the MFI’s activities or offices without having any relation with an active policy on energy use. Hence, a number of adaptations are recommended for this indicator:
1. The indicator should ask for changes in electricity consumption instead of the rate of decrease in order to avoid erroneous data entry and misinterpretation;
2. Since energy costs may vary due for instance to subsidies, change of tariffs or connection fees, the indicator should track the amount of energy consumed (kWh); and
3. A clearer differentiation should be made between changes in electricity consumption at the HQ and branch levels.
Considering that a key element of this indicator is to provide reflection on the use of energy and the possible causes for any observed changes, it might be useful to ask respondents to further explain the reasons for changes in either direction. Finally, MFIs may opt to use other metrics to determine their environmental footprint, for example level of water or paper consumption.
3.3
Awareness-Raising and Training Activities for Clients and the Community
Does your institution track the number of awareness-raising or training activities on green business/opportunities/technologies and/or environmental risk for clients/the community?
If your institution does keep track of this data, please report the total number of awareness-raising or training activities conducted during FY14
Do you find this data to be easy to track and/or useful for decision making?
Graph 6. MFIs that track/report awareness raising/training activities for clients/community
Graph 7. Awareness raising/training activities for clients/community: easy to track and/or useful for decision-making?
Indicator (FY14) Obs.
Total number of awareness-raising or training activities on green businesses, opportunities
and/or technologies 1,539 19
Average Number of awareness-raising or training activities on green businesses,
opportunities and/or technologies 81 19
Total number of awareness-raising activities on environmental risk 4,919 17 Average number of awareness-raising activities on environmental risk 289 17
14%
37% 3%
46%
Neither easy to track nor useful for decision making Useful for decision making, but
not easy to track Easy to track, but not useful for
decision making Both easy to track and useful for
decision making 28% 3% 25% 41% 2%
Conducts this type of activities and does
keep track
Conducts this type of activities, but does not
keep track
Does not conduct this type of activities Reported Did not report Unknown
Survey findings. Twenty-eight percent of the sampled institutions conducted awareness-raising or training activities for their clients or community during FY 2014, reporting a total of 6,458 of such activities - 1,539 activities related to green business, opportunities and/or technologies and 4,919 activities related to environmental risk. Over one third of the MFIs that conduct some type of awareness-raising or training activity and keep track of this information consider these data useful for decision making but not easy to track. On the other hand, only 60% of the institutions that carry out such activities and consider them both easy and useful to track actually track them.
Furthermore, the statistical analysis revealed that MFIs with a large number of offices and a high average loan balance per borrower are less likely to conduct such awareness-raising or training activities. Large MFIs whose clients have a higher purchasing power might be more motivated to increase their portfolio size than they are to expand the range of nonfinancial services for their active clients.
Interpretation of the indicator and proposed changes.
The degree to which MFIs track the number of awareness-raising and training activities they conduct may vary significantly depending on the type of campaigns or trainings that the institution provides to its clients. To illustrate, the survey asked about activities related to green businesses, opportunities and/or technologies all together on one side, and environmental
risk on the other. MFIs offering several types of activities might decide to divide those in more detailed categories for internal tracking purposes.
While an institution that specifically assesses environmental risks on loan disbursement would count each loan application as a unique training session performed, another institution that conducts one or two elaborate campaigns on an annual basis may report considerably fewer activities. For instance, out of the 4,919 activities on environmental risk reported by 17 survey respondents, 3,885 are associated with one single MFI that raises its clients’ environmental awareness at the time of loan application. If this MFI is excluded from the sample, the average number of awareness-raising activities for the remaining 16 MFIs decreases from 289 to 65. Needless to say, an environmental risk assessment and a campaign are inherently different activities and entail varied degrees of effort. Hence, MFIs willing to monitor green nonfinancial services might want to distinguish between initiatives that target one client at a time from ones that target a larger group.
Another suggestion that may appeal to some MFIs would be to track the outreach of training activities for staff members. The frequency of awareness-raising activities for clients or the greater community may be smaller than that of induction and continuous training on environmental awareness for new and current staff to be spread to their current and potential clients.
3.4
Environmental Risk Assessment during Loan Application
Does your institution track the total number of loan applications rejected due to high environmental risks? If your institution does keep track of this information, please report the following:
Total number of loans applications received during FY14
Total number of loan applications rejected due to high environmental risk during FY14 Do you find this data to be easy to track and/or useful for decision making?
Graph 8. MFIs that track/reported loan applications
rejected on environmental criteria Graph 9. Loan applications rejected on environmental criteria: easy to track and/or useful for decision
making?
Indicator (FY14) Obs.
Total number of loan applications rejected due to high environmental risk over the total
number of loans applications received 0.64% 11
Average loan applications rejected due to high environmental risk over the total number
of loans applications received 1.09% 11
Survey findings. The number of loans rejected on
environmental criteria is the second most difficult indicator to track: although 68% of MFIs assess loan applications on such criteria, three-quarters of them do not keep track of this information. Additionally, 61% of respondents stated that they have or would have difficulties tracking it. For the 14% of MFIs that reported the number of rejected loans, this figure did not surpass 6.55% of the total number of applications.
Despite this difficulty of tracking, the vast majority of MFIs consider this indicator to be useful for decision making. Looking at the 15 institutions that cited this indicator as not relevant for decision making, 73% do not screen loan applications on the basis of environmental criteria. These 15 MFIs might either perceive that this type of assessment is in and of itself not useful or that filling out an assessment form for loan applications that do not comply with their exclusion list is a futile exercise.
As for awareness-raising activities, rejecting environmentally risky loans also depends on the size and reach of the institution. MFIs with a high number of outstanding loans, borrowers, and offices are less likely to reject loans based on environmental criteria. Again, incentives mainly linked to portfolio growth might dampen the willingness of loan officers to implement additional rejection criteria other than those embedded in their usual due diligence process.
Interpretation of the indicator and proposed changes.
Interpreting the survey results related to this indicator is not as easy. A low number of rejections can be the result of wildly different scenarios or a combination thereof, including a flexible environmental policy and/or a situation wherein very few environmentally-risky loan applications were actually received. Additionally, environmental considerations can be integral to a broader set of assessment criteria, in which case the decision to reject a loan application might depend also or exclusively on other requirements. MFIs that want to track this specific component should therefore assess environmental criteria separately.
14%
47% 3%
36%
Neither easy to track nor useful for decision making Useful for decision making, but
not easy to track Easy to track, but not useful for
decision making Both easy to track and useful for
decision making 14% 2% 51% 32% 1% Assesses loan applications and keeps track Assesses loan applications, but does
not keep track
Does not assess loan applications on environmental criteria Reported Did not report Unknown
3.5
Environmental Risk Assessment of Outstanding Loans
Does your institution track the number of outstanding loans judged environmentally-risky?
If your institution does track the number of outstanding loans judged environmentally-risky, please report this number at FYE 14.
Do you find this data to be easy to track and/or useful for decision making?
Graph 10. MFIs that track/reported outstanding loans deemed to be environmentally-risky
Graph 11. Outstanding loans deemed environmentally risky: easy to track and/or useful for decision
making?
Indicator (FY14) Obs.
Number of outstanding loans judged environmentally risky 39,328 10 Total number of Environmentally-risky loans over total number of outstanding loans 4.07% 10 Average Environmentally-risky loans over outstanding loans 2.15% 10
Survey findings. Although 60% of the sampled
institutions confirmed that they assess the environmental risk of their financed activities, only 27% of those institutions reported keeping track of this information, while another 19% in this group do not monitor these figures despite considering these data both easy to track and useful for decision making. Overall, two-thirds of the institutions consider this information difficult to track, which makes it the most difficult indicator to monitor.
Interpretation of the indicator and proposed changes.
The interpretation of the results related to this indicator can be rendered difficult by a number of decisions made by clients and MFIs. For instance, a client who is aware of his/her MFI’s rejection policy might apply for a loan citing
a purpose that differs from the intended one, or alternatively s/he can seek other sources of financing altogether. The number of outstanding loans classified as environmentally-risky will also depend on the existence and application of multiple assessment tools. Indeed, this number might be lower for those MFIs that only have an exclusion list as an assessment tool compared to MFIs that use more sophisticated tools such as a formal loan environmental assessment form or a scorecard ranking for instance types of fertilizers, seeds or machinery used. MFIs interested in tracking this indicator may find it constructive to review the processes they have in place to capture the environmental risk of their portfolio and make adjustments accordingly.
14% 53% 2% 31%
Neither easy to track nor useful for decision making Useful for decision making, but
not easy to track Easy to track, but not useful for
decision making Both easy to track and useful for
decision making 11% 5% 44% 40% Assesses environemtnal risk
and keeps track
Assesses environemtnal risk,
but does not keep track
Does not assess the environemtnal risk of activities financed Reported Did not report
3.6
Green Loans
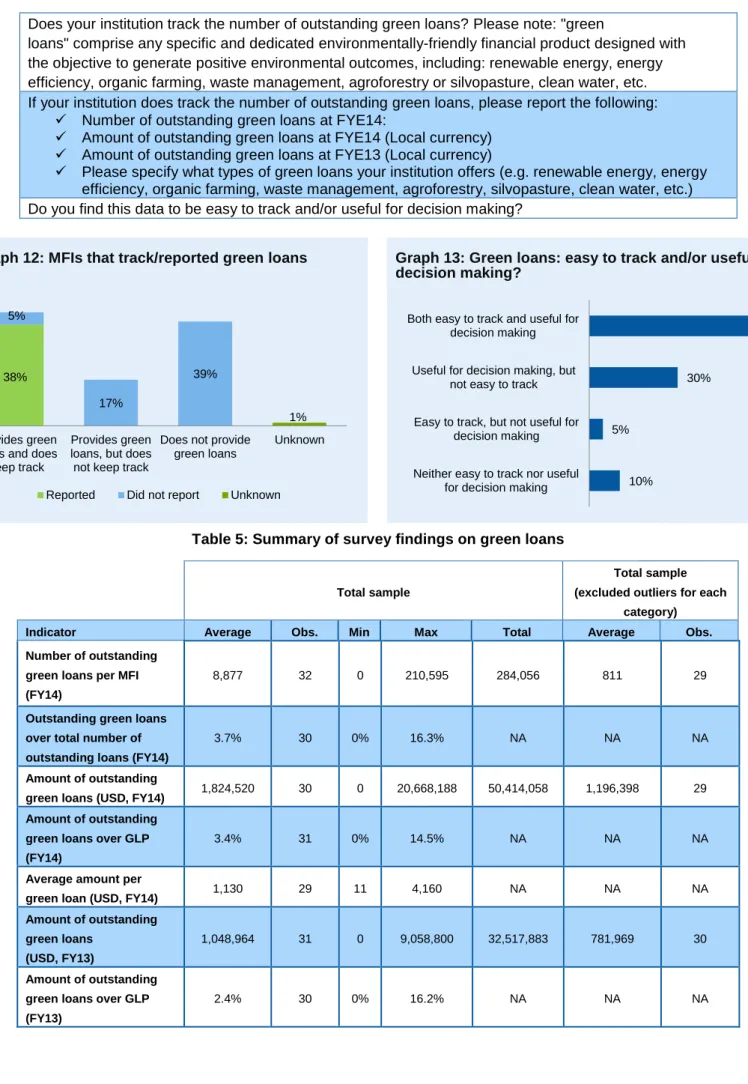
Does your institution track the number of outstanding green loans? Please note: "green
loans" comprise any specific and dedicated environmentally-friendly financial product designed with the objective to generate positive environmental outcomes, including: renewable energy, energy efficiency, organic farming, waste management, agroforestry or silvopasture, clean water, etc. If your institution does track the number of outstanding green loans, please report the following:
Number of outstanding green loans at FYE14:
Amount of outstanding green loans at FYE14 (Local currency)
Amount of outstanding green loans at FYE13 (Local currency)
Please specify what types of green loans your institution offers (e.g. renewable energy, energy efficiency, organic farming, waste management, agroforestry, silvopasture, clean water, etc.) Do you find this data to be easy to track and/or useful for decision making?
Total sample
Total sample (excluded outliers for each
category)
Indicator Average Obs. Min Max Total Average Obs.
Number of outstanding green loans per MFI (FY14)
8,877 32 0 210,595 284,056 811 29
Outstanding green loans over total number of outstanding loans (FY14)
3.7% 30 0% 16.3% NA NA NA
Amount of outstanding
green loans (USD, FY14) 1,824,520 30 0 20,668,188 50,414,058 1,196,398 29
Amount of outstanding green loans over GLP (FY14)
3.4% 31 0% 14.5% NA NA NA
Average amount per
green loan (USD, FY14) 1,130 29 11 4,160 NA NA NA
Amount of outstanding green loans
(USD, FY13)
1,048,964 31 0 9,058,800 32,517,883 781,969 30
Amount of outstanding green loans over GLP (FY13)
2.4% 30 0% 16.2% NA NA NA
Graph 12: MFIs that track/reported green loans Graph 13: Green loans: easy to track and/or useful for
decision making? 38% 5% 17% 39% 1% Provides green
loans and does keep track
Provides green loans, but does not keep track
Does not provide green loans
Unknown
Reported Did not report Unknown
10% 5%
30%
55%
Neither easy to track nor useful for decision making Easy to track, but not useful for
decision making Useful for decision making, but
not easy to track Both easy to track and useful for
decision making
Survey findings. Almost two-thirds of the sample offer green loans, among which 71% track their outreach. Of the institutions that provide green loans but do not track this information, half find it both easy to track and useful for decision making, while a third of them find it difficult to track. The statistical analysis points to another trend whereby small institutions are less likely to offer green loans, just as they are less likely to have a formal environmental policy, as mentioned earlier.
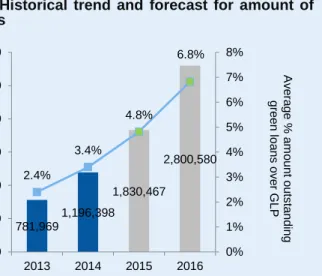
Another interesting trend can be observed between FY 2013 and FY 2014, whereby the average volume of green portfolio jumped by more than 50%, and the share of the portfolio dedicated to green loans increased from 2.4% to 3.4% (Table 5). This positive annual change in the number of green loans observed in Table 5 can be drawn out to forecast a positive growth trend in the period between FY 2013 and FY 2016 (Graph 14 and Table
6).15,16
15 Forecasting of trends in green lending excludes outlier MFIs whose
large portfolios were mainly comprised of products designed to enhance sanitation and increase access to water.
16
Graph 14 takes the growth rate between FY 2013 and FY 2014 as the reference trend and assumes a linear growth between FY 2013 and FY 2016. Table 6 assumes that the average green loan amount remains constant at the FY 2014 value of 1,475 USD across the period. It is computed as the ratio of the amount of outstanding green loans (USD) over the number of outstanding green loans per MFI for FY 2014 for the sample without outliers. These trends and forecasts have the same qualitative behavior as the one reported in Schuite G.J. and Forcella D. (2015) Green Inclusive Finance: Status, Trends and Opportunities
available here: <
www.inclusivefinanceplatform.nl/documents/booklet%20green%20inclus ive%20finance%20-%20web%20version%20final_1.pdf>. However, the quantitative data are slightly different due to a different treatment of outliers and the fact that some MFIs have recently reported updated data. Last accessed on November 9th, 2015.
Interpretation of the indicator and proposed changes.
The survey asked MFIs to report figures about products expressly designed with the objective to generate positive environmental outcomes, implicitly excluding loans belonging to the “do not harm the environment” category. The results reflect the diversity of green loan products available in the market. Out of the 32 MFIs that specified their range of green products, 28 reported to offer renewable energy loans, 18 energy efficiency loans, 12 clean water loans, 10 environmentally-friendly agricultural loans, 5 sanitation loans, 3 waste management loans and 2 ecotourism loans. Thereafter, the considerations for this indicator are similar to the ones about tracking awareness-raising and training activities: MFIs with a diversified suite of green products might want to track each type of green loan separately in order to better monitor the degree of engagement and achievements in each of their targeted categories. For instance, a detailed tracking of the type of energy loans disbursed will help MFIs to better assess their ability to satisfy energy needs and align their strategy with the SDGs.
Graph 14: Historical trend and forecast for amount of green loans
Table 6: Historical and projected figures for number of green loans 2013 2014 2015 2016 Number of green loans per MFI 530 811 1,241 1,898 781,969 1,196,398 1,830,467 2,800,580 2.4% 3.4% 4.8% 6.8% 0% 1% 2% 3% 4% 5% 6% 7% 8% 0 500000 1000000 1500000 2000000 2500000 3000000 2013 2014 2015 2016 Gr e e n loa n a m o u n t p e r M FI (U S D ) A v e ra g e % a m o u n t o u ts ta n d ing g re e n loa n s o v e r GL P
3.7
Micro-insurance to Increase Environmental Resilience
Does your institution track the number of borrowers with an active micro-insurance contract to increase resilience face to environmental disasters (e.g. weather shocks, climate change, etc.)? Please note: the micro-insurance product might be offered either directly by your institution or via an agreement with a third-party insurer.
If your institution does keep track of the number of borrowers with an active micro-insurance contract to increase resilience face to environmental disasters (e.g. weather shocks, climate change, etc.), please report this number at FYE14.
Do you find this data to be easy to track and/or useful for decision making?
Graph 15. MFIs that track/reported micro-insurance coverage
Graph 16. Micro-insurance coverage: easy to track and/or useful for decision making?
Indicators (FY14) Obs.
Number of borrowers with an active micro-insurance contract to increase resilience face to
environmental disasters 18,634 4
Total number of borrowers with an active micro-insurance contract to increase resilience
face to environmental disasters over total number of active borrowers 5.88% 4 Average number of borrowers with an active micro-insurance contract to increase resilience
face to environmental disasters 5.75% 4
Survey findings. Only 15% of MFIs reported to provide
micro-insurance products to increase resilience against environmental disasters.
Interpretation of the indicator and proposed changes.
The results for this indicator are not surprising given that micro-insurance in general, and this type in particular, is still in its incipient phase in the sector.17 A study conducted in 2010 by BRS in collaboration with ADA and the Microinsurance Network18 selected 11 social key performance indicators, among which was the coverage ratio, which is defined as the number of active insured over the target population (our survey assumed the “target population” to be the total number active
17
The State of Microinsurance. Micro Insurance Network. Web. <www.microinsurancenetwork.org/sites/default/files/MiN_State%20of%2
0Microinsurance.pdf>. Last accessed on November 9th, 2015. 18Social Performance Indicators for Microinsurance. BRS, ADA, and the
Microinsurance Network. Web. <http://www.microinsurancenetwork.org/sites/default/files/Social_perfor
mance_indicators_for_microinsurance_workshop_report_0.pdf>. Last accessed on November 9th, 2015.
borrowers). The fact that MFIs serve often only as intermediaries between insurance companies and their clients and, as such, do not have this information integrated into their Management Information System (MIS) might explain why 65% of respondents find, or would find, this information difficult to track. However, as most institutions find this data useful for decision making, insurance companies may consider collaborating with MFIs in order to give them greater visibility on their clients’ insurance coverage, which might eventually lead to the design of new products and services.
1%
15%
41% 43%
No response Neither easy to track nor useful
for decision making Useful for decision making, but
not easy to track Both easy to track and useful for
decision making 5% 5% 5% 84% 1% 1% Offers micro-insurance products and keeps track Offers micro-insurance products, but does not keep
track
Does not offer micro-insurance
products
Unknown
3.8
Summary of Green Practices and Indicator Appreciation
The survey results confirm that our small sample isrepresentative of “greener than average” MFIs and not of the global microfinance sector. For instance, 60% of our 87 MFI respondents reported to provide green loans (Table 7) compared to only 19% of institutions that have a FY 2014 SP profile on MIX Market (Graph 1).
In terms of appreciation, while 83% to 85% of survey respondents consider all tested indicators to be useful for decision making, they find only a few activities to be easy to track. The provision of green loans and electricity consumption appears to be the “easiest”, while tracking the environmental risk of outstanding loans is the most difficult.
The survey also highlights that there is a disconnect between finding an indicator useful for decision making and easy to track on one hand and implementing tracking tools on the other. For instance, 53% of MFIs that offer green loans reported that they do not track the number and/or the amount of this type of credit product despite finding this information useful for decision making and easy to track. The same is true for the 50%, 39% and 26% of MFIs that reported to deliver awareness-raising activities, assess the environmental risk at loan application, and assess the environmental risk of outstanding loans, respectively.
While we cannot exclude that, for some MFIs, the individual survey respondent is not the same person directly responsible for tracking green performance and thereafter some of these institutions might actually track this information, we might also assume that most MFIs do not have enough incentives to start tracking this data. This gap is an additional motivation to further look into the possibilities to include such indicators in reporting standards.
Lastly, the statistical analysis revealed the influence of scale and outreach on an MFI’s environmental performance. While large institutions are more likely to have an environmental policy and disburse green loans thanks to their experience and infrastructure, smaller institutions perform better in conducting awareness-raising activities and rejecting environmentally risky loans. MFI whose incentives are in terms of portfolio growth might need the assistance of support organizations in order to integrate an environmental strategy into their growth objectives.
Table 7: Overview of green practices and
appreciation of ease of tracking and usefulness for decision making Indicator Does it Easy to track Useful for decision making
Offer green loans 60% 60% 85%
Track the change in electricity consumption 24% 56% 83% Offer awareness-raising / training activities for clients/community 59% 49% 83% Offer micro-insurance to increase environmental resilience 15% 43% 84% Assess environmental risk at loan application 68% 39% 83% Assess environmental risk of outstanding loans 60% 33% 84%
4. CONCLUSIONS
The findings of this paper represent an unprecedented first step in the exploration of green outreach and outcome metrics for MFIs.
Although a number of necessary changes and reflections have been laid out, there appears to be a common appreciation for the ease to track and usefulness for decision making of the tested indicators.
Based on the survey results, we ranked each product, service, or process according to their level of ease of tracking and usefulness for decision making in the following order:
1. Tracking the number and amount of green
loans is the first and easiest step towards green
performance outreach monitoring. Indeed, it does not require any specific tool other than those already in place to track an MFI’s portfolio composition. The challenge, however, will be accurately differentiating among the various types of green loans.
2. Measuring the ecological footprint of an MFI’s
operations is the second area that emerges as
both easy to track and useful for decision making. While we tested one specific indicator, namely electricity consumption, MFIs might find it easier to track, for instance, water or paper consumption, starting from HQ and then expanding to branches. In doing so, they should be careful in selecting the most appropriate unit of measurement, as well as to differentiate between absolute and percentage changes. Even if the limited environmental impact of an MFI’s internal operations does not make this the most useful indicator, some institutions could select it as a stepping stone.
3. Tracking awareness-raising and training
activities for clients and the community comes
in third place. This indicator remains challenging both because, in general, MFIs find nonfinancial
services outreach difficult to track and because it is not always possible to accurately estimate the level of participation in public events. Depending on the type of activities conducted, MFIs will decide whether it makes more sense to track the number of activities conducted, the number of participants or the outcome of these activities.
4. Tracking the coverage ratio of micro-insurance products to increase resilience to
environmental disasters comes next. However,
challenges in this area are partially linked to external factors, and notably to the functioning of the micro-insurance market itself.
5. Tracking the environmental risk of loans prior
to or post-disbursement is decidedly the most
difficult as it requires MFIs to put in place not only strict operational policies but also specific assessment and tracking tools in concert with support organizations. However, the fact that lending is the greatest indirect source of an MFI’s environmental impact makes external risk management a key area to be addressed promptly.
Moving beyond the specific indicators, the results reveal that a deeper understanding of quantitative indicators requires a more thorough and process-focused questioning of how these are calculated and tracked by the MFI. Secondly, an important gap persists between the usefulness of an indicator and the MFI’s capacity to track it. Support organizations, and notably technical assistance and software providers, have the opportunity to create training tools and MIS that enable these institutions to incorporate green quantitative indicators into their dashboards. At the same time, institutions do not always have enough incentives to track indicators even when they have the ability to do so. Funders have an important role to play in designing a structure of incentives that encourage MFIs to establish a comprehensive green management strategy and track progress towards their goals.
AUTHORS
This study is the result of a joint collaboration between MIX and the European Microfinance Platform (e-MFP) Microfinance & Environment Action Group. The study has been coordinated by Armonia Pierantozzi (MIX). Authors of the paper are: Marion Allet (PAMIGA), Davide Forcella (Centre for European Research in Microfinance - Université Libre de Bruxelles), Frédéric Huybrechs (Institute of Development Policy and Management - University of Antwerp), Aldo Moauro (MicroFinanza Rating), Armonia Pierantozzi, Natalia Realpe Carrillo (MicroEnergy International GmbH), Geert Jan Schuite (Enclude), Lucia Spaggiari (MicroFinanza Rating). The data analysis was carried out by Armonia Pierantozzi, Davide Forcella, Frédéric Huybrechs and Natalia Realpe Carrillo.
In addition, we would like to extend our appreciation to Gabriela Erice and Daniel Rozas (e-MFP) for having contacted MIX proposing to collaborate on this paper. Finally, thanks to Micol Pistelli and Jacqueline Foelster (MIX), Gabriela Erice and Niamh Watters (e-MFP), and Hadley Taylor (EU Energy Initiative Partnership Dialogue Facility) for their contribution in the editorial process.
For any queries about this publication please contact Armonia Pierantozzi at [email protected].
The European Microfinance Platform (e-MFP), founded in 2006, is a growing network of over 120 organizations and individuals active in the area of microfinance. As a multi-stakeholder organization it represents the European microfinance community. e-MFP members include banks, financial institutions, government agencies, NGOs, consultancy firms, researchers and universities. e-MFP’s aim is to promote co-operation amongst European microfinance bodies working in developing countries. e-MFP facilitates high level discussion, communication and exchange of information. e-MFP’s vision is to become the microfinance focal point in Europe linking with the south through its members.
ANNEX I: CASE STUDY - VIRL
Virl Microfinance (Private) Limited (Virl) is a Zimbabweanmicrofinance institution (MFI) formed in 2010. As of December 31st, 2014, Virl had a loan portfolio of about 1.1 million USD, servicing approximately 2,500 clients. Fifty-three percent of its borrowers are located in rural areas, and 52% are women.
With the intention to better serve its clients and explore possibilities for portfolio expansion, Virl has actively sought to develop green products since 2013. Thanks to its participation in Hivos’s Green Performance program in 2014, managers and staff were introduced to the green microfinance approach and to the Green Performance Agenda (GPA). The first GPA intervention provided recommendations and an action plan towards a green trajectory. As a result, Virl developed an environmental policy assisted by a GPA consultant, and one of its clients, Ms. Nobukhosi Ndlovu, was supported to improve her production technology.
At present, Virl has provided solar energy loans to three secondary schools in rural areas for the procurement and installation of solar panels and batteries for clean power
generation that enable children to study during the night and to do research on the internet like their peers in urban areas as well as teachers and villagers to charge their mobile phones.
Virl continues exploring green opportunities and developing loan products that enable clients to finance clean energy and agricultural production enhancing equipment such as solar irrigation pumps, hand driven (instead of fossil fuel powered) ploughs and cultivators, and eco-stoves. To this end, Virl is in the middle of a green product development process and has already identified suppliers of the relevant equipment some of whom have given demos to its staff. However, product knowledge among clients is still very low.
Based on the findings of a demand and supply research done in 2015 by a GPA consultant in collaboration with Enclude, Virl is conducting a pilot project for developing lighting systems, efficient cooking stoves and solar dryers and is simultaneously exploring partnerships with suppliers of green products to consolidate and leverage Virl’s green endeavors.
One of Virl’s clients, Ms. Nobukhosi Ndlovu, used to roast peanuts for her peanut butter factory in an open fire without a chimney: not only did the operators inhale a lot of smoke, but the costs for fuel wood kept increasing up to 40 USD/day, thereby reducing her profit margins. After having used the GPA, Virl suggested that she purchase a cleaner and fuel efficient oven and to construct a chimney to get rid of the smoke. Thanks to a loan of 750 USD with which she reconstructed the facility, the company saves a daily amount of 32 USD on fuel wood, and the workplace has become cleaner and much healthier.
ANNEX II: CASE STUDY - CONTACTAR
Since 1995, the Colombian NGO MFI CorporaciónNariño Empresa y Futuro (Contactar) has been offering inclusive financing across the southern region of Colombia. With a clear understanding of the importance of engaging in environmental activities, Contactar has been carrying out a diversity of activities under the umbrella of energy needs satisfaction and improvement of resilience to climate change since 2011.
The MFI began conducting pilot projects to facilitate access to clean energy technologies for its clientele through its financial product ConSuPlaneta.19 After a successful pilot phase, Contactar increased its portfolio of products and expand the outreach of the green loan in further branches. To date, Contactar offers financing of improved cooking stoves (fix and mobile), biodigestors, solar crop dryers, water filters, among others. In 2013, with the support of the Frankfurt School and United Nations Environment Programme (UNEP) Collaborating Centre, Contactar implemented the Microfinance for Ecosystem-based Adaptation (MEbA) project in order to allow its clients to invest in activities related to ecosystem
19
More information on this product can be accessed here: <www.contactar-pasto.org/index.php/microcredito-con-su-educacion>. Last accessed on November 9th, 2015.
sustainability and thus to improve both their income and their resilience towards climate change. Since 2014, Contactar has worked with MicroEnergy International GmbH20 (MicroEnergy) to develop an inclusive Green Finance Program aiming at the adaptation and mitigation for climate change through a menu of financial products and services. By scaling up this program, Contactar aims both at reaching the economically challenged population of Nariño, Huila and Putumayo and at creating the socio-economic and environmental impact needed to attract other Colombian financial institutions into following its steps towards greening their financial services.
Within the framework of the development and implementation of the green strategy of Contactar, in 2014 MicroEnergy used the CERISE SPI4, including the Green Index, and the GPA to assess its global green performance. The final assessment drew specific lines of action for both the MFI and MicroEnergy in order to develop a holistic green strategy. In 2015, Contactar collaborated with the data collection for the development and testing of the PEPI, enabling explicit metrics of energy poverty.
20
The project is being financed by Citi Foundation.
Client makes use of her improved cooking stove financed by Contactar.
Contactar and MicroEnergy staff visit clients who availed of the Biodigestor.loan
2020 Pennsylvania Avenue NW #353 Washington, DC 20006 USA