Market Lift: The Enigma of Incentive Program Redesign
Michael Strom, NMR Group Inc., Somerville, MA Matthew Nelson, Eversource, Springfield, MA
ABSTRACT
Market lift programs operate by providing retailers with incentives for increasing sales of efficient products over a baseline of historical and comparison-store sales. “Net” lift represents the difference between the sales increases in participating stores and those in comparison stores. The current market lift initiative worked with one retail chain selling Compact Fluorescent Lamps (CFLs) and with an associated CFL manufacturer; its baseline included sales from a program comparison area and non-program comparison area. The evaluation team reviewed the data and lift calculations, conducted a series of in-depth interviews, developed scenarios of results under different study designs, and provided recommendations for potential changes to the program. The program encountered problems throughout the lift period including the choice of comparison areas, a natural disaster forcing a change in the program comparison area, and product availability issues. The program achieved a net lift of 15% for 13W CFLs and 8% for 23W CFLs over the entire period of September 2013 through February 2014. Calculating net lift under alternative study designs demonstrated the substantial influence of the choice of comparison areas and the length of the baseline period. In-depth interviews with market actors revealed that retailers and manufacturers are not proponents of market lift, a design they view as too risky, costly and complex to be viable. Our evaluation suggests that market lift—under very specific conditions—may be a worthwhile program approach moving forward, but that obtaining retailer/manufacturer participation will be difficult.
Introduction
Market Lift programs represent a relatively recent addition to energy-efficiency program designs. These programs provide retailers or manufacturers with incentives for increasing the sales of promotional bulbs over a baseline (or pre-lift period) of historical and comparison-area sales. The design is desirable from a programmatic perspective because retailers are rewarded for sales above a baseline and, as such, energy-efficiency program administrators (PAs) can claim full savings for the lift achieved. “Net” market lift represents the difference between the sales increases in participating stores and those in comparison stores This paper summarizes the findings of an evaluation of a recent market lift initiative in Massachusetts. The Massachusetts electric PAs applied this design to energy-efficient lighting, specifically standard, spiral compact fluorescent lamps (CFLs). Market lift programs differ from the more common upstream approach, which brings the shelf price of bulbs down by providing incentives directly to the manufacturer or retailer, in a number of important ways, including:
The necessity of collecting bulb sales information from a carefully selected set of comparison or control stores;
The level of risk taken by participating retailers/manufacturers (i.e., if they do not reach sales goals, they do not receive additional, or in some cases any, incentive payments);
The need to establish baselines from historical bulb sales data for both participating and comparison stores;
Incentivizing sales above these baselines in a manner that is agreed upon with participants in advance; and
Allowing retailers flexibility in pricing, merchandizing, and marketing.
Outside the MA initiative, market lift efforts have also been implemented in Vermont, Oregon, New York, and elsewhere. The MA, Vermont, and Oregon efforts, in fact, were part of a coordinated demonstration of the market lift program design that was facilitated by the Northeast Energy Efficiency Partnerships (NEEP 2014). Each of these three programs demonstrated increases in sales volume during the program compared to sales during baseline periods (achieved “lift”), although none of them attained lift for every incented bulb type during every reporting period.1
Study Goals
The overall goals of the evaluation were to review the results of the market lift initiative with a focus on strengths and weaknesses, major challenges and successes, and its viability as a model for efficient products moving forward. More specifically, the evaluation team had the following aims:
To gain insights from those involved with the effort in order to make recommendations for potential future market lift efforts in Massachusetts;
To gain insights from those involved with market lift efforts in other areas to make recommendations for potential future market lift efforts in Massachusetts;
To estimate the change in promoted CFL sales over time against those of comparison areas; To assess the extent to which market lift is viable for CFLs and replicable for light-emitting diodes
(LEDs) and other initiatives or technologies;
To make recommendations, if needed, for possible revisions to the program design and implementation to improve the evaluability of the approach and its net impacts; and
To develop criteria for when market lift may be appropriate along with procedures for its design and implementation.
Massachusetts Market Lift Design
The evaluated Massachusetts Market Lift Initiative ran for six months, from September of 2013 through February of 2014 (NEEP 2014).2 The Massachusetts PAs worked with one retail store chain and an associated CFL manufacturer to implement the program. The retail partner instituted the program, with the manufacturer taking the lead on data collection and delivery. The implementation contractor computed the market lift achieved and the associated incentive payments every two months over the six-month period, utilizing a tiered incentive structure that paid increasing incentives for higher levels of achieved lift on promoted CFL sales.
While some market lift models provide incentives only for sales achieved above the participating and comparison area baselines, the Massachusetts program actually maintained upstream incentives, providing lift incentives in addition to them. As discussed, one of the greatest potential advantages of the market lift design over more traditional incentive programs is that PAs can claim full savings for the “lift” of bulb sales achieved over the pre-lift period, because they theoretically provide incentives to a retailer or manufacturer only for the increase in efficient bulb sales over what is already occurring through the program. In contrast,
1 The programs and lift results in other states were autonomous and did not influence the program design, results, or
agreements made in MA.
2 Massachusetts was one of three states that took part in a coordinated demonstration program of market lift facilitated by the
Northeast Energy Efficiency Partnerships (NEEP). However, the different programs were autonomous and the design/results in other areas did not influence the current program.
upstream CFL programs have been seeing increased levels of free ridership, which lower program-attributed (net) savings. Another advantage of market lift programs is that they provide PAs and evaluators with a more extensive dataset than most programs, including sales information from baseline periods and comparison areas.
For the current initiative, the program managers and the implementer had initially planned to select comparison stores within the same state as the participating stores, and were in negotiations with a retailer whose structure would have allowed for such a design. However, that retailer ultimately declined to participate. The retailer that did participate did not have a sufficient number of stores within the state to make this desired in-state comparison feasible. They also had a policy that all products within a particular state needed to have the same shelf prices. To allow for possibly varying prices, the retailer’s stores in two other states (a neighboring northeastern state and a southern state) were used as comparison area stores. The initiative included two bulb types: the standard 13W and 23W CFLs being sold by the retailer.
Prior to settling on the bordering northeastern state and southern state as comparison areas, a western state was chosen because it had the same CFL price as stores in Massachusetts, a similar program structure, and comparable demographics and store traffic. However, a natural disaster in that state during the lift period resulted in it being dropped as a comparison area because bulb sales increased so rapidly during the construction and repair of affected homes. The program managers and the implementer therefore decided to replace that state with the neighboring northeastern state that also had a similar history of markdowns for efficient bulbs to Massachusetts, making it a “program-activity” comparison area. The southern comparison state had not historically had utility incentives for efficient light bulbs, making it a “non-program activity” comparison area.
The retail partner negotiated with the implementer to weigh the two comparison areas equally when calculating lift. Market lift was calculated as the average of the change in sales in the comparison areas in the lift period compared to the pre-lift period subtracted from the change in sales in the participating states’ stores in the lift period compared to the pre-lift period. The final lift calculations utilized percentage changes in each area, so differences in sales volumes did not disproportionately affect lift measurements. The lift calculation is shown below:
Program Background and Incentive Structure
As discussed the Massachusetts Market Lift initiative ran for six months, from September of 2013 through February of 2014, with one participating retailer and manufacturer. The implementer computed the lift achieved and the associated incentive payments (which were previously agreed upon by the implementer, participating retailer/manufacturer, and program managers) every two months over the six-month period. The retailer negotiated these two-month incentive payment periods in order to have incentives delivered throughout the program as opposed to receiving one lump sum at the conclusion, thus enabling the retailer to use funds as necessary throughout the span of the program.
Unlike other market lift designs in which the retailer or manufacturer receives incentive payments only for increased sales, in the current design the normal markdown incentives on both bulb types were maintained. For 13W 4-packs, this markdown was $3 (bringing the shelf price down to $1.99 per package), and for 23W 6-packs, the markdown was $6 (bringing the shelf price down to $3.99 per package). To further facilitate the retailer’s ability to achieve sales increases, the PAs provided $15,000 at the outset of the program and an additional $5,000 midstream to reduce shelf prices even more. These funds were separate
from the incentives provided for achieving lift, and were earmarked primarily for marketing efforts. Not all of these program costs and incentives were required to be passed on to the consumer. As with the Massachusetts upstream program, market lift incentives paid to the retailers could go to marketing, administration, profit, or other areas.
Findings
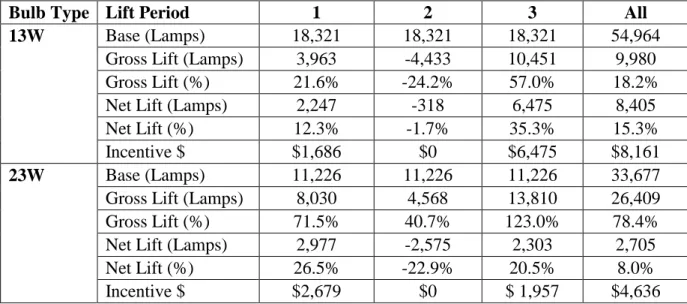
As shown in Table 1 which displays the market lift results for 13W and 23W CFLs individually, the net lift achieved for Massachusetts stores for the 13W CFL bulbs over the entire lift period was 8,405 bulbs (or 15.3%). The gross lift3 for 13W CFLs for the entire period was 9,980 bulbs (or 18.2%). The gross and net lift achieved for Massachusetts stores for 23W CFLs over the entire lift period was 26,409 bulbs (78.4%) and 2,705 bulbs (8%), respectively. The relatively small net lift was due to the fact that the comparison area stores greatly increased their sales of 23W bulbs over their own pre-lift periods during the market lift period, revealing the importance of the choice of comparison areas in a market lift design, a topic to which we will return.
Table 1. Market Lift Results by Bulb Type
Bulb Type Lift Period 1 2 3 All
13W Base (Lamps) 18,321 18,321 18,321 54,964
Gross Lift (Lamps) 3,963 -4,433 10,451 9,980
Gross Lift (%) 21.6% -24.2% 57.0% 18.2%
Net Lift (Lamps) 2,247 -318 6,475 8,405
Net Lift (%) 12.3% -1.7% 35.3% 15.3%
Incentive $ $1,686 $0 $6,475 $8,161
23W Base (Lamps) 11,226 11,226 11,226 33,677
Gross Lift (Lamps) 8,030 4,568 13,810 26,409
Gross Lift (%) 71.5% 40.7% 123.0% 78.4%
Net Lift (Lamps) 2,977 -2,575 2,303 2,705
Net Lift (%) 26.5% -22.9% 20.5% 8.0%
Incentive $ $2,679 $0 $ 1,957 $4,636
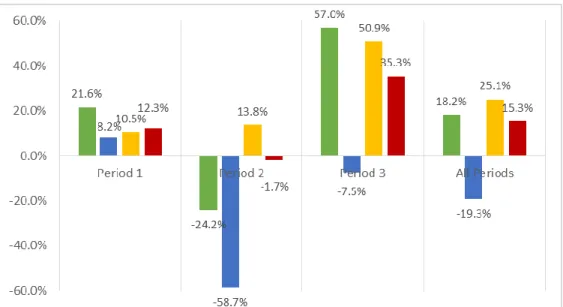
Looking at the results graphically for both participating stores and comparison area stores for each two-month period further highlights the importance of appropriate comparison areas, and the influence that sales in those stores can have on achieved lift. As shown in Figure 1, in the first two-month period, stores in Massachusetts increased their sales of 13W CFLs by 3,963 bulbs (21.6%) over the pre-lift period, and comparison-area stores increased theirs by an average of 9.3% (8.2% for the program activity comparison area stores and 10.5% for the non-program activity area stores). This results in a net lift of 2,247 bulbs (12.3%) for the period for this bulb type (21.6% - 9.3% = 12.3%). Alternatively, net lift was negative in the second two-month period as a result of Massachusetts stores not increasing their sales over the pre-lift period, whereas the non-program activity comparison area did have an increase.4 In other words, although
3 Gross lift represents the increase in sales in participating stores during the lift period over the pre-lift period, not factoring in
any changes in comparison areas.
4
Stores in both the participating state and the program activity comparison state experienced some sell-through of the program bulbs (at almost identical periods) during the second lift period, which contributed to the negative lift during those
the program activity comparison area saw a huge decrease from its pre-lift period in Period 2 (-58.7%), when averaged with the increase in the non-program activity comparison area (13.8%), net lift was only slightly negative (-1.7%).
Net lift was highest in Period 3, with Massachusetts stores increasing sales of 13W CFLs by 10,451 bulbs (57%) over the pre-lift period, compared to an average 21.7% increase in comparison areas. This resulted in a Period 3 net lift of 6,475 bulbs or 35.3% over the pre-lift period.
Figure 1. Percent Change in Sales over Pre-lift period and Net Lift – 13W CFL Bulbs
Figure 2 presents the percent change in sales over the pre-lift period for 23W CFLs in Massachusetts and comparison area stores as well as the net lift per period. In the first two-month period, the retailer’s Massachusetts stores increased their sales of 23W CFLs by 8,030 bulbs (71.5%) over the pre-lift period. The retailer’s comparison area stores increased their sales of 23W CFLs by an average of 45% (53.5% for the program activity comparison area stores and 36.6% for the non-program activity comparison area stores), which resulted in a net lift of 2,977 bulbs or 26.5% for the period.
As with 13W CFLs, 23W CFLs showed a negative net lift in the second two-month period as a result of the comparison area stores increasing sales over their pre-lift periods at greater rates than Massachusetts stores. The third two-month period, however, retained a positive net lift of 2,303 bulbs (20.5%), with Massachusetts stores increasing sales of 23W CFLs by 13,810 bulbs (123%) over the pre-lift period (increased sales in the comparison areas during that same period resulted in a lower net lift).
Figure 2. Percent Change in Sales over Pre-lift period and Net Lift – 23W CFL Bulbs
Summary Results and Net Sales Change Over Gross Sales Change
Table 2 summarizes the Massachusetts lift results for both bulb types combined as computed by the implementer. The gross and net lift achieved for these stores for combined 13W and 23W CFLs over the entire lift period was 36,389 bulbs (41.1%) and 11,110 bulbs (12.5%), respectively. This results in a sales change ratio (net sales change over gross sales change) of 30.5% (=11,110/36,389). The more commonly applied metric, Net-to-Gross (NTG), takes on a different form with market lift programs compared to upstream lighting programs. Since market lift programs only incentivize bulbs sold above the pre-lift period (i.e., every bulb sold above the pre-lift period was a result of the program), the evaluation team believes 100% is the most accurate NTG estimate. The retailer received a total incentive of $12,797 for the net market lift that was achieved.
Table 2. Summary Market Lift Results All Bulbs Combined
Bulb Type Lift Period 1 2 3 All
All Gross Lift (%) 40.6% 0.5% 82.1% 41.1%
Net Lift (%) 17.7% -9.8% 29.7% 12.5%
Incentive $ $4,365 $0 $8,433 $12,797
Net Sales Change/Gross Sales Change 30.5%
NTG5 100%
Compared to MA, which increased sales in two of the three reporting periods for both bulb types offered through the program, Oregon and Vermont (which utilized a retailer with smaller baseline sales than MA) also saw sales increases during many of their reporting periods. The stores in Oregon achieved lift for one of the supported bulb types in six of the twelve half-month program periods and for the other bulb type
5
Market Lift programs only provide incentives for sales above the pre-lift period (i.e., net sales), so the value for the effort is 100% by default.
in five of the periods. The Vermont program had sixteen half-month reporting periods and achieved lift (ranging from 4% to 128%) in nine of these periods (NEEP 2014). Although such evidence suggests that market lift can be quite successful as a program design, as evidenced throughout this paper, the lack of retailer and manufacturer interest in participating in these programs—which can be complex, costly, and very risky from the retailer perspective—along with the challenges in identifying the correct baseline, make this a challenging approach to implement.
Issues with Initial Study Design
There are many challenges associated with implementing a market lift program, one of the most significant of which is identifying comparison area stores that provide the ideal non-market lift program counterfactual to the treatment area stores. Even when significant time and effort is put in to pick the most appropriate comparison area, events out of the program manager’s and implementer’s control can ultimately have a considerable impact on results. This section outlines the unintended shortcomings of the existing study design.
Unsuitable Non-Program Activity Comparison Area
The participating retailer was reluctant to compare their sales in the treatment area just to those in a state with a similar level of program support, and negotiated to have Massachusetts store sales compared to a blend of sales from a program area and a non-program area. A review of the pre-lift and market lift data raised concerns about the appropriateness of the non-program activity area as a comparison area, including: Seasonality – The data indicated seasonality in sales of light bulbs in the Northeast but not in the
non-program activity comparison area.
Deep Discounts and Program-like Promotions – There was a significant increase in sales of 13W and 23W CFLs during the lift period in the non-program activity comparison area compared to its pre-lift period. The implementer found out that CFL prices were deeply discounted in this area during the lift period in order to move old product, but the same discounts were not applied elsewhere. Further, a national lighting push by the retailer also brought the CFL prices down, but these discounts were not provided in states that already had utility discounts. These discounts and promotions in the non-program activity comparison area serve to complicate comparisons with the participating stores. Low Socket Saturation – As the awareness of energy efficiency increases over time, households
typically begin to fill sockets with energy-efficient bulbs. Because they are likely starting with low levels of socket saturation, sales of energy-efficient light bulbs in areas with no prior program support are likely be higher in 2013 than in states with a history of program support that has contributed to high socket saturation (NMR et al. 2015).6 Higher preliminary saturation combined with long CFL lifetime can contribute to comparatively lower sales in program states. This could partially account for the increase in sales from the pre-lift period to the lift period in the non-program activity comparison area.
Change in Comparison Area Mid-Stream
The need to change the program-activity comparison area due to the unexpected natural disaster in the western state highlights a major issue with this type of program: the need for clear protocols when
6
This theory builds from evidence suggesting that socket saturation increases rapidly until about 25% of sockets are filled with energy-efficient bulbs; then saturation continues to increase, but at a much slower rate.
anomalies occur in the comparison areas. In general, there is always a potential for complications when comparing two states with active and fluctuating programs, creating significant threats to the internal validity of a project. The decision to change comparison areas midstream was an attempt to preserve the project (and was therefore one of necessity and not choice), but a market lift approach should approximate an experimental design as much as possible. It may not be worthwhile to attempt to “salvage” a project if it jeopardizes the experimental design, which may have been the case here.
Retailer Size, Policies, and Product Availability
One retailer ended up participating in the market lift initiative following a lengthy period of negotiations conducted over several months (with a number of potential retail partners). The initial methodology of selecting comparison stores within the same state as the participating stores was dropped because the participating retailer did not have enough stores in Massachusetts for a valid comparison. Further, while the original calculation of lift was to be based on a market share approach, in which the sales of promotional CFLs would be compared to those of inefficient bulbs, the retail partner did not sell any incandescent bulbs and offered only a small selection of CFL and LED bulbs in its stores. For that reason, the initiative targeted the two standard 13W and 23W CFL bulbs being sold by the retailer and calculated the change in sales during the promotional period in the participating and comparison stores for these bulbs only. In negotiations, the retail partner specified that it wanted to weight the two usable comparison areas (the neighboring northeastern program-activity comparator, and the southern non-program activity comparator) equally against its own baseline. The program managers agreed in order to be able to move forward with the program, but each of these decisions based on the realities of the retailer’s size, sales policies, and product availability represented deviations from the ideal experimental design.
Use of a 12-Month Pre-Lift Period
The market lift initiative ran for six months, from September of 2013 through February of 2014. Insofar as consumer demand for light bulbs differs by season and the seasonality in demand is different in the treatment area than in the comparison areas (because of their latitude), the current approach (which uses a full year of pre-lift data) would be subject to a seasonality bias. For example, if the demand for light bulbs during fall/winter months is significantly higher than that in spring/summer months in northeastern stores but not in southern stores, the current approach could overestimate the lift. The pre-lift sales data showed substantial increases in bulb purchases during the fall and winter months in Massachusetts and the program activity comparison state, but not in the non-program activity comparison state, thus resulting in a biased comparison.7 These issues further highlight the challenges inherent in identifying appropriate comparison area(s).
In the following section the Team demonstrates how market lift results shifted under an alternative study design that accounts for the described seasonality issues. The Team does not report how the results also shift when addressing the other issues highlighted above (i.e., dropping the problematic non-program activity comparison area) because the program design and comparison areas were agreed upon ahead of time by all necessary parties. We do note, however, in the conclusions section how the program design could be improved in the future, particularly in terms of choosing appropriate comparison areas.
7
The non-program (southern) activity comparison area, located at a different latitude, also has less variation in the amount of daylight in winter and summer than in the northeast.
Results Under Alternative Study Design
Due to the challenges described above, the evaluators used the pre-lift and market lift data for the treatment and comparison area stores to compute net market lift and net sales change over gross sales change under an alternative research design that accounts for the seasonality issues with the use of a 12-month pre-lift period in the existing study design. We computed the average monthly pre-pre-lift period sales using only the sales from the same six months in the previous year (as opposed to the entire year) as the lift period: September of 2012 through February of 2013.
Table 3 shows the summary of market lift results under the alternative research design. The use of a six-month pre-lift period reduces the net lift from 12.5% to 3.2% and gross market lift from 41.1% to 17.6%. The decline in lift is due to the fact that the average monthly CFL sales in the treatment area from September through February were higher than those from March through August during the pre-lift period (the previously discussed influence of seasonality on bulb purchasing).
Table 3. Market Lift Results Under Alternative Study Design
Pre-lift period Lift (Gross) Lift (Net) Net Change Over Gross Change
Original 12-month 41.1% 12.5% 30.5%
Alternative Calculation 6-month 17.6% 3.2% 18.2%
Takeaways from In-Depth Interviews
Along with the computation of lift and net sales change over gross sales change under the actual and alternative program designs, the evaluation team also conducted a series of in-depth interviews (IDIs) with a wide variety of individuals experienced with market lift programs. Interviewees included the implementation contractors, manufacturer partner and Program Administrators for the current effort, implementation contractors and program managers who had run or were running lift efforts in other areas, negotiating but non-participating retailers, as well as high level manufacturer and retailer buyers. The purpose of these interviews was to obtain information on the challenges of implementing the program, their perceptions of the successes of the program design, the viability of the approach moving forward (particularly for CFLs and LEDs or other efficient products), and what could be done to improve potential market lift efforts in the future. Below, we outline the major findings that emerged in those interviews.
Importance of Appropriate Comparison Areas
A consistent theme throughout the interviews was the importance of the choice of comparison area stores in a market lift design. The calculation of market lift is based on the increase in sales of promotional bulbs during the lift period over sales in the pre-lift period in the participating stores versus that same potential increase in comparison area stores. As such, the incentives that the participating retailer receives, and the perceived success of the program in general, are highly dependent on sales in comparison areas. Choosing an appropriate comparison area or set of comparison areas is a complicated process, with a number of potential variables to be considered, including level of program activity, store demographics, product availability, seasonality, purchase habits, latitude, and store/chain size, among many others. Ultimately, the participating retailer pushed for the inclusion of the non-program activity comparison area under the assumption that the sole reliance on an area with a similar history of markdown programs would hurt its
ability to achieve lift. Unfortunately, utilizing the non-program activity comparison area had the opposite effect: the substantial sales increases in those stores diminished the net lift in the treatment area.
The initial design of the Massachusetts program called for an in-state, in-store comparison group (utilizing different Massachusetts locations of the same retailer). Such a design would have addressed many of the potential problems described above. The Team believes that an ideal design for market lift is to utilize randomly chosen comparison stores from the same retailer within the same state.
Retail Partners are Difficult to Secure
One of the greatest challenges in implementing the market lift design is securing retailers to participate in the effort. This is especially notable in areas with long lighting program histories. For example, one retailer that had been willing to sign on to market lift programs elsewhere would not sign on to the current initiative. The reservations that retailers had in regard to participating in market lift programs tended to boil down to four key issues:
Unwillingness to share bulb sales data (market lift programs require significant data sharing—not only for the promotional period, but also the pre-lift period);
Legal concerns including indemnification;
Fear of losing previous incentives through long-standing markdown programs by participating in market lift (a preconceived notion that prevents them from considering participating); and
Not wanting to take on the added responsibility for increasing sales over the pre-lift period. Despite substantial outreach and negotiating by the Program Administrators, and the fact that the current initiative was designed in such a way that retailers would not lose the upstream incentives they had received in the past but would be rewarded for sales increases, nearly all retailers were still unwilling to sign on to the stipulations of the initiative. One program manager running a lift initiative in another state went so far as to say that he believed a group of retailers had intentionally “boycotted” all market lift proposals.
Program Design can be Costly and Risky
Interviewees consistently mentioned cost as another challenge of market lift. Compared to more traditional markdown programs that lower the price of efficient bulbs on stores’ shelves, market lift can be more costly. In order to attract retailers, the Massachusetts initiative required being run in tandem with a normal markdown program. These added costs reduced the program’s cost-effectiveness. While the program did show increases in CFL sales over the pre-lift period as a result of the lift initiative, the benefits of these sales increases should be weighed against the added cost of implementation (NMR 2014).
Manufacturers and retailer buyers also continually cited what they saw as an untenable level of risk as a reason for not participating. Although the Massachusetts initiative posed less of a risk than other efforts (since the retailer was able to maintain their normal incentives), in general, market lift programs pay only for bulb sales achieved over a baseline, and if the retailer is unable to achieve a boost in sales during the lift period, it risks receiving no incentives. Furthermore, if the strategy that the retailer uses to attain lift adds costs (i.e., increased marketing/outreach, using their own resources to lower the shelf price of lift bulbs) the program could actually end up costing more than it pays out to the retailer.
Viability for LEDs
The evaluation team also explored the extent to which interviewees believed the program design could be viable for LEDs. Those who had participated in market lift programs had fairly positive feelings about the likelihood of LED sales increasing through a market lift program, and therefore saw the product as a viable candidate for the program design. Most program managers and implementers believed (or had been specifically told) that retailers would rather run a market lift program for LEDs than for CFLs because they believed they would have more success increasing sales of a bulb that already had high levels of customer satisfaction, and comparatively lower levels of penetration than CFLs. However, given that the feature that makes market lift programs desirable from the program perspective is the ability to increase net savings through reduced free ridership, many on the implementation side thought it would take time before LEDs could actually be utilized in lift programs. When and if the free ridership rate on LEDs increases, it is likely that they will become a viable candidate.
Conclusions
An ideal market lift effort would be self-evaluating, with a comparison area serving as a perfect baseline or counterfactual for the treatment area—a type of quasi-experimental design. Because these programs pay only for the net increase in sales above a pre-established baseline, program sponsors are able to claim 100% of the savings on the promoted bulbs sold above the amount sold in the pre-lift period, thereby eliminating free ridership. The accuracy of the estimate of net market lift achieved by the program, then, depends on the extent to which the change in the comparator area or areas serve as the appropriate counterfactual for the treatment area.
The market lift program design is also contentious one, with many in the lighting field vehemently denying the viability of the approach moving forward. Given that those who would need to be recruited for future market lift efforts (i.e. retailer buyers and manufacturers) have such negative feelings toward the design, it is likely to continue being a difficult one to implement. However, the evaluation team believes the following suggestions would be helpful for implementing potential future market lift efforts.
Rename or Rebrand Market Lift
Interviewees who had run or at the time of the interview were running market lift efforts stressed the difficulty in securing retail partners to participate in their initiatives. One interviewee even suggested that larger chain retailers had intentionally boycotted any proposals mentioning market lift. Given the desirable aspects—from the retailer perspective—of market lift programs that do not drop markdown incentives currently in place, it is worth considering renaming or rebranding the strategy to avoid the negative connotations that so many retailers appear to share toward the term market lift.
In-State, In-Store Comparison Group with a Market Share Calculation
An ideal quasi-experimental design for a market lift initiative would require a large number of stores in a given state to be randomly allocated to treatment and control groups and for the sales data of both efficient (Category A) and inefficient (Category B) light bulb categories to be collected from all stores. The lift would then be measured as the change in market share of efficient light bulbs for the treatment area stores over the pre-lift period minus the change in market share of efficient light bulbs for the control area stores over the pre-lift period:
Stress Potential Continuation of Incentives
One of the main concerns that retailers have with market lift efforts is that in areas with a history of markdown programs, they fear losing those incentives by signing onto a market lift contract. If retailers are expected to take on the responsibility for increasing bulb sales when those same bulbs are less expensive at a retailer down the street, then the value proposition of market lift is nonexistent. However, the current market lift initiative was designed specifically as a hybrid program in which participating retailers would maintain their previous bulb incentives but also be rewarded for any lift achieved on CFL sales. Designs with this dual-incentive structure should make the program very desirable to potential retailers, but the preservation of previous incentives must be emphasized in negotiations. Indeed, the dual-incentive structure is critical to retailers and manufacturers operating in program states, who will not take on the risk of increasing sales over a baseline unless they are assured of markdown incentives. As mentioned previously, however, providing incentives for the lift achieved as well as maintaining prior markdowns makes this type of market lift design very costly. The additional net bulb sales achieved must be weighed against the added costs of implementation.
Focus on Partner’s Data Collection Capabilities
The manufacturer partner in the current initiative played a significant role in all data provision and collection efforts. Without the manufacturer, the retail partner would not have been able to participate in the initiative, as they do not collect the level of data required to calculate lift. Future market lift efforts must take into account the capabilities of a particular retailer in collecting and providing data, and consider continued reliance on a manufacturer partner for retailers unable to meet the data requirements.
References
NMR, Cadmus, DNV GL, and Tetra Tech. 2015. Saturation Comparison of Massachusetts, California, and New York: Final Report. Prepared for the Massachusetts PAs and EEAC consultants. NMR Group, Inc. 2014. Market Lift Assessment: Final Report. Prepared for the Electric and Gas
Program Administrators of Massachusetts Part of the Residential Evaluation Program Area. Northeast Energy Efficiency Partnerships (NEEP). 2014. Residential Lighting Market Lift Pilot Final