Abstract
Key parameters for MALDI imaging are spatial resolution and mass spectral quality. In this application note, we explore the feasibility of single cell imaging. Typically, high spatial resolution requires matrix preparation that is drier than usual and often is limited to high abundant lipid species.
For the high resolution imaging presented here, we utilized a dry sublimation device, which enabled us to perform MALDI imaging at a spatial resolution of 10µm and to resolve individual cells in tissue images. The 10 µm pixel size was achieved on both solarix FTMS and autofleXspeed and ultrafleXtreme platforms.
App. Note # FTMS-47+MT-113
MALDI Imaging with Single Cell Resolution
at 10 µm Pixel Size
B ru ke r D al to ni cs i s c on tin ua lly i m pr ov in g i ts p ro du ct s a nd r es er ve s t he r ig ht to c ha ng e sp ec ifi ca tion s w ithout no tic e. © B ru ke r D al to ni cs 0 1-20 13 , 1 81 5 8 5 3Keywords Instrumentation and Software MALDI Imaging solariX
FTMS MALDI-TOF
MALDI-TOF
Authors
Michael Becker, Eckhard Belau, Sören-Oliver Deininger, Jens Fuchser
Bruker Daltonik GmbH, Bremen, Germany Shannon Cornett
Introduction
Interest in MALDI imaging has grown significantly in recent years with applications in the fields of histology, histopathology, drug development and others. Several performance factors are relevant to mass spectrometric imaging techniques, such as spatial resolution, analysis speed, and mass spectral quality. Usually the optimization of one of these factors is detrimental to the others, so in real-life, experiments are often not done at the limits of spatial resolution. Nevertheless, in this application we focus on the optimization of spatial resolution.
Sample preparation is an important factor for achieving high resolution MALDI imaging. Often, the MALDI matrix is applied as solution in the form of an aerosol. The solvent droplets extract the compounds of interest which are sub-sequently incorporated in the matrix for the measurement. For many compounds, such as drugs or proteins, a “wet” sample preparation (longer aerosol) leads to a better spectral quality, but at the same time leads to larger matrix crystals, thereby limiting the maximum spatial resolution. Especially for highly abundant lipids, it has been shown that matrix can be applied in a dry fashion [1], which leads to small matrix crystal size and therefore allows a higher spatial resolution. In this study, we used sublimation to apply matrix onto the prepared slides. This allows a very high spatial resolution because no solvent is involved [2] and is especially suited to assess the instrument-based limits of the lateral resolution.
Spatial resolution in imaging mass spectrometry
Within the field of mass spectrometric imaging spatial resolution can be defined differently. Often, the term “spatial resolution” is used synonymously with the achievable raster width (i.e. “pixel size”) or the geometric distance between spectra. In these cases, technical features such as minimum laser focus diameter and precise sample stage movement are considered the limiting factors (in the absence of large matrix crystals).
To determine the highest spatial resolution that we could achieve on biological tissue we selected rat cerebellum and testis tissue as test specimens. In each testis section there are a number of structures of different sizes including tubuli, interstitial spaces and differing layers of cells on the outside of each tubule as well as in the lumen. In the cerebellum organized layers of individual large neurons, the Purkinje cells, have a soma diameter of 30µm. The goal of this study was to prepare and analyse these samples such that the smallest of these features was well resolved in the ion images.
Experimental
Cryosections of fresh-frozen rat cerebellum and testis were cut at 10µm thickness and thaw-mounted onto indium-tin-oxide (ITO, Bruker) coated glass slides.
Sample slides were not washed and directly desiccated in a vacuum desiccator for 1 hour. Sublimation was performed in a custom built device using a 152 mm inner diameter sublimation apparatus (Ace Glass, NJ, USA) exactly as described in Chaurand et al. [2] using 2,5-dihydroxybencoid acid as matrix.
MALDI imaging measurements were performed on commercially available Ultraflextreme, Autoflex Speed and Solarix (all Bruker) instruments equipped with a smartbeam II laser. The standard laser setting of “minimum” diameter was used exclusively for all measurements. FlexImaging 3.0 software (Bruker) was used to set up the imaging measurements and to generate ion images from the acquired data. MALDI-TOF images were normalized to total ion count (TIC), MALDI-FTMS images were normalized to root mean square (RMS) intensity. The intensity thresholds for the reconstructed MALDI images were adjusted to result in bright images and low noise. After image collection, slides were removed and washed in ethanol to remove matrix and stained using a standard Hematoxylin and Eosin (H&E) protocol. Microscopic images were acquired on a Mirax desk slide scanner (Zeiss).
Results
MALDI-TOF imaging
Figure 1 shows an illustration of the main features of rat cerebellum, including white matter, granular layer, Purkinje cell layer and molecular layer. Purkinje cell soma have an average diameter of ~30 µm in rat which are well separated from each other and therefore are ideal structures to test MALDI Imaging spatial resolution. Figures 2-4 show a selection of MALDI images of lipids from rat cerebellum at increasing magnification. Figure 2 shows two reconstructed MALDI images of five selected mass signals and an optical image of the measured area. In Figure 2a, the mass signal at 815.7 Da (displayed in red) is localized to the cerebellar white matter and the signal at 849.7 Da (in blue) is found in the granular layer. The mass signal at 878.9 Da is seen as a line of green dots that correspond to individual Purkinje neurons. The signal at 825.5 Da is seen in Figure 2b as a well-structured image of several anatomical features.
Figures 3a-b show, in progressively greater detail, that the mass signal at 878.9 Da is indeed localized to the Purkinje cell layer. After the MALDI acquisition, an H&E stained image of the section was acquired and is shown in Figure 3c. Individual Purkinje cells are indicated by arrows on both the molecular and the microscopic images. That the somata are represented by multiple pixels suggests that the spatial resolution is higher than 30 µm.
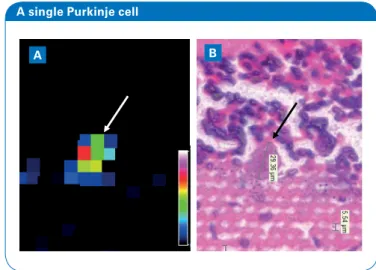
The images in Figure 4 show expanded regions of Figures 3b-c that contains a single Purkinje cell. Here, the molecular image is not interpolated so each square pixel represents data from a single MS spectrum (at 10µm raster width/ spatial resolution). The Purkinje cell soma has a diameter of ~30 µm, and is represented by 3 × 3 mass spectrometric pixels, clearly demonstrating an actual mass spectrometric pixel size of 10µm.
Testis consists of a number of well-defined anatomical structures that span a range of sizes and make it another good model system for evaluating mass spectrometric imaging performance. The main structures are seminiferous tubules which have a diameter ~200 µm. Within each tubular lumen the stage of spermatogenesis determines the internal structure. The interstitial space between tubules can range in size from a few µm up to 40 µm in width. Finally, the tubules are lined on the outside with layer of smooth muscle cells. Whether or not the interstitial space and the muscle layer surrounding the tubules can be clearly resolved is therefore a good test for evaluating spatial resolution in a mass spectrometric imaging experiment. A small region of testis was imaged by MALDI-TOF and the distributions of three mass signals are shown in Figure 5 along with an H&E image of the analysis region taken after the MALDI experiment. The main anatomical structures are visible, especially a layered structure inside the seminiferous tubules highlighted by the ions shown in green and blue. The interstitial space (denoted by the ion in red) is also clearly resolved.
MALDI-FTMS imaging
FTMS instruments are especially suited for imaging of small molecules such as lipids because of their unsurpassed mass resolution and measurement accuracy. In the case of complex samples such as tissue, there are typically many isobaric compounds at each nominal m/z and a more accurate description of the sample makeup can be obtained when these are well resolved. Moreover, the precise mass measurement often allows an unambiguous determination of the molecular formulas of the observed compounds. Combining such high MS performance with a high spatial resolution promises to generate datasets rich with information.
Simplified anatomy of rat cerebellum
MALDI images of rat cerebellum
Figure 1: A: The main structure in the cerebellum is comprised of cerebellar white matter (WM) surrounded by the granular layer (GL). The granular layer is surrounded by a single layer of Purkinje cells (PCL), which is in turn surrounded by the molecular layer (ML). B: Enlarged area as marked, the Purkinje cells are large cells with irregular spacing. In mouse cerebellum, the diameter of Purkinje cells is ~30 µm.
Figure 2: MALDI images from part of rat cerebellum acquired at 10µm pixel size. A: Three selected masses which show cellular localization: the mass signal 878.9 Da in green highlights the individual Purkinje cells; the mass signal 815.7 Da in red is found in the cerebellar white matter; and the mass signal 849.7 Da is found in the granular layer. B: Two selected mass signals that show strong differentiation, the mass signal at 825.5 Da also exhibits spatial differentiation according to intensity range. C: Optical image of the measured cerebellum with measured region shown for context. All scale bars: 200 µm. GL ML WM PCL GL ML WM Purkinje Cells A B 793.6 Da 825.5 Da 815.7 Da 878.9 Da 849.7 Da 793.6 Da 825.5 Da 815.7 Da 878.9 Da 849.7 Da A B C
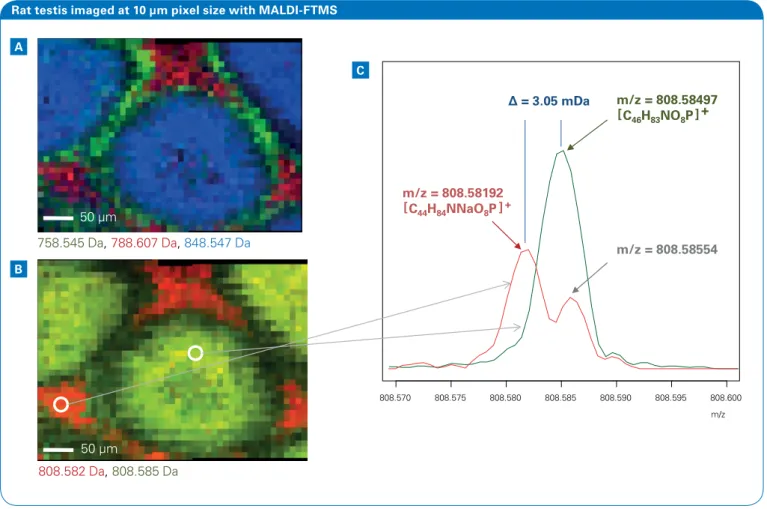
Here, we applied MALDI-FTMS imaging analysis to the rat testis sample. Five structurally localized ions are shown in Figure 6 without display interpolation so that every visible square pixel represents one mass spectrum. From the three selected mass signals in Figure 6a we see that a pixel size of 10µm is sufficient to clearly distinguish the layer surrounding the tubules, the interstitial space and the lumen of the tubules. Figure 6b shows the distribution of two mass signals that are only 3 mDa apart and exhibit very different distribution in the tissue. One mass signal is detected only from the interstitial space while the other is detected in the lumen of the tubules.
878.9 Da
878.9 Da 878.9 Da
878.9 Da
Purkinje cells
Figure 3: An example of a mass signal which is localized to the Pur-kinje cells. A: Wide-field view showing the distinctive cellular layer surrounding the granular layer. B: Expanded view of the highlighted region. C: H&E image of the same tissue section. In C individual Purkinje cells are designated with arrows. The corresponding Purkinje cells are annotated with arrows in B.
A
B C
A single Purkinje cell
Rat testis imaged at 10 µm pixel size with MALDI-TOF Figure 4: Expanded view of the region highlighted in Fig. 3b, sur-rounding a single Purkinje cell. A: The mass spectrometric image shown without interpolation. Each pixel represents one mass spectrum from a 10 µm area. B: H&E image of the same section. The the dimension bar shows the Purkinje cell to have a diameter of 30 µm.
Figure 5: A: Image which shows localization of three selected mass signals to different structures: seminiferous tubules (in green and blue) and interstitial space (in red). B: H&E image of the same section. A B 813.61 Da 809.58 Da 801.56 Da 813.61 Da 809.58 Da 801.56 Da
The two peaks (as detected from the pixels highlighted in Figure 6b) are shown in Figure 6c. In this broadband (wide m/z range) FTMS measurement the average mass resolving power was approximately 190,000, which is sufficient to generate the image because those signals are also spatially resolved. If these peaks were in the same spectrum the resolution necessary to resolve them at a nominal mass of 808 Da would need to be greater than 300,000 which can be achieved using CASI. The signal of 808.58192 Da is not fully resolved from a lower-intensity, co-localized signal at 808.58554 Da. However: the peaks have sufficient spatial differentiation that 808.58554 does not contribute significant interference to the ion image of mass signal 808.58497 Da.
Further, the measurement accuracy of the FTMS
measurement allows the direct estimation of the molecular formulas labeled in Figure 6c. The mass signal at
808.58192 Da likely corresponds to the molecular formula [C44H84NNaO8P]+ (a calculated mass of 808.582676 Da,
a 0.94 ppm deviation from the measured mass). The signal at 808.58192 Da most likely corresponds to the molecular formula [C46H83NO8P]+ (a calculated mass of 808.585082
Da, a 0.14 ppm deviation from the measured mass).
Conclusion
Sample preparation and instrumental parameters compete to be the limiting factor for achieving high spatial resolution in MALDI imaging. Sublimation of matrix offers an ideal dry preparation for MALDI imaging of lipids in which matrix crystal size and analyte migration do not limit high spatial resolution. Using this preparation strategy we were able to readily achieve a spatial resolution of 10µm using standard commercial ultraflextreme, autoflex speed and solarix instruments with the smartbeam II laser.
Rat testis imaged at 10 µm pixel size with MALDI-FTMS
Figure 6: A: Image which shows three peaks localized to: tubule lumen (blue), basal layer (green) and interstitial space (red). B: Image of two peaks which have a mass difference of 3 mDa differentiated to tubule lumen and interstitial space. C: Mass signals from designated pixels in B) with suggested molecular formulas
A B C 808.570 808.575 808.580 808.585 808.590 808.595 808.600 m/z Δ= 3.05 mDa m/z = 808.58192 C ]+ [ ] + [ 44H84NNaO8P m/z = 808.58497 C46H83NO8P m/z = 808.58554 758.545 Da, 788.607 Da, 848.547 Da 808.582 Da, 808.585 Da 50 µm 50 µm
Bruker Daltonik GmbH Bremen · Germany Phone +49 (0)421-2205-0 Fax +49 (0)421-2205-103 [email protected]
Bruker Daltonics Inc. Billerica, MA · USA Phone +1 (978) 663-3660 Fax +1 (978) 667-5993 [email protected] Fremont, CA · USA Phone +1 (510) 683-4300 Fax +1 (510) 490-6586 [email protected] www.bruker.com B ru ke r D al to ni cs i s c on tin ua lly i m pr ov in g i ts p ro du ct s a nd r es er ve s t he r ig ht to c ha ng e sp ec ifi ca tion s w ithout no tic e. © B ru ke r D al to ni cs 0 1-20 13 , 1 81 5 8 5 3
For research use only. Not for use in diagnostic procedures.
References
[1] Puolitaival SM, Burnum KE, Cornett DS, Caprioli RM Solvent-free matrix dry-coating for MALDI imaging of phospholipids
J Am Soc Mass Spectrom. 2008 Jun;19(6):882-6 [2] Chaurand P, Cornett DS, Angel PM, Caprioli RM
From whole-body sections down to cellular level, multiscale imaging of phospholipids by MALDI mass spectrometry Mol Cell Proteomics. 2011 Feb;10(2):O110.004259. MALDI images of rat cerebellum
793.6 Da 825.5 Da 815.7 Da 878.9 Da 849.7 Da 793.6 Da 825.5 Da 815.7 Da 878.9 Da 849.7 Da A B C
Reproduced from inside: Figure 2: MALDI images from part of rat cerebellum acquired at 10µm pixel size. A: Three selected masses which show cellular localization: the mass signal 878.9 Da in green high-lights the individual Purkinje cells; the mass signal 815.7 Da in red is found in the cerebellar white matter; and the mass signal 849.7 Da is found in the granular layer. B: Two selected mass signals that show strong differentiation, the mass signal at 825.5 Da also exhibits spatial differentiation according to intensity range. C: Optical image of the measured cerebellum with measured region shown for context. All scale bars: 200 µm.