Data Entry Spot Check Final Report
Hewlett-Packard
2013
Data Entry Spot
Check
Data Entry Spot Check Final Report
ACKNOWLEDGEMENT i
ACKNOWLEDGEMENT
The BISP. All Rights reserved. To reproduce material contained herein requires the explicit written permission of the BISP. To obtain permission contact the publications
division of the BISP.
This report has been written on behalf of the Benazir Income Support Programme By
Innovative Development Strategies 2, Street 44, Sector F-8/1, Islamabad-Pakistan
http://www.idspak.pk
Innovative Developmenet Strategies (Pvt.) Ltd (IDS) acknowledges the efforts of the following persons who organized and conducted the Spot Check and constituted the team for the writing of this report.
Team Leader Brig (R) Razi Uddin Research Associates:
Ms Sara Rafi Mr Hussam Uddin Mr Arshad Khurshid Ms Uzma Cheema
CONTENTS ii
Table of Contents
I Acronyms ... viii
II Executive Summary... vii
1. Sample Selection ... vii
1.1. Rejections ... vii
2. Analysis tools ... viii
3. Methodology ... viii
4. Summary of Findings Phase 1 ... ix
5. Phase Wise Sample Distribution ... ix
6. DEO Wise Sample Distribution ... x
7. Summary of Findings-Overall ... xi
8. CONCLUSION ... xii
III Introduction ... 1
9. Background ... 1
9.1. The Benazir Income Support Programme ... 1
9.2. The Poverty Scorecard ... 1
9.3. Implementation of Scorecard ... 2
9.4. Data Entry of Scorecards ... 2
9.5. Data Entry Spot Check ... 3
10. Objectives ... 3
IV Data Entry Spot Check Methodology ... 4
11. Methodology ... 4
12. Analysis tools ... 4
13. Logistics ... 5
14. Data Base Development and Data Entry ... 5
15. Monitoring and Supervision of Data Entry ... 5
16. Hiring and Training of Staff ... 6
16.1. Hiring of Staff ... 6
16.2. Training ... 6
17. Sample Size for Data Entry Spot Check ... 6
17.1. Phase 1 ... 6
Data Entry Spot Check Final Report
CONTENTS iii
18. NADRA’s Data Entry Methodology ... 8
V Analysis and Findings ... 9
19. Dataset Available for Analysis ... 9
20. Phase 1 Findings: Test Phase and Initial NRO Comparison... 9
20.1. Discrepant Households: ... 9
20.2. Frequency of Errors ... 10
20.3. Questions with Higher Discrepancies ... 10
20.4. PMT Score Calculation ... 11
20.5. Discrepancy in PMT Scores ... 11
20.6. Score Difference Range ... 12
20.7. Summary of Findings Phase 1 ... 13
20.8. Conclusion Phase 1 ... 14
VI Phase Wise Analysis ... 15
21. Phase Wise Findings ... 15
21.1. Discrepant Households ... 15
21.2. Frequency of Errors ... 15
21.3. PMT Score Calculation ... 16
21.4. PMT Score Discrepancy ... 16
21.5. Score Difference Range ... 16
VII DEOs Performance ... 18
22. DEO WISE Findings ... 18
22.1. Sample Phase 2 – 8 DEO Wise ... 18
22.2. Discrepant Households ... 19
22.3. Frequency of Errors ... 19
22.1. PMT Score Discrepancy ... 20
22.2. Score Difference Range ... 21
23. Summary of Findings-Overall ... 22
LIST OF FIGURES iv
List of Figures:
Figure 1: Discrepant Households-Phase 1 ... ix
Figure 2: DEO Wise Discrepancy ... xi
Figure 3: Methodology ... 4
Figure 4: Discrepant Households-Phase 1 ... 10
Figure 5: PMT Score calculation ... 11
Figure 6: PMT Score Discrepancy ... 12
Figure 7: Score Difference Range-Phase 1 ... 13
Figure 8: Discrepant Households ... 15
Figure 9: PMT Score Calculation by NADRA ... 16
Figure 10: PMT Score Discrepancy... 16
Figure 11: Discrepant households-DEO Wise ... 19
Data Entry Spot Check Final Report
LIST OF TABLE v
List of Tables:
Table 1: Sample Size Phase 1 ... viii
Table 2: Total Sample Size ... ix
Table 3: DEO Wise Sample ... x
Table 4: Phase 1 Sample ... 6
Table 5: Sample-Phase/District Wise ... 7
Table 6: Declined Interviews per Phase ... 9
Table 7: Frequency of Errors-Phase 1 ... 10
Table 8:Questions with Higher Discrepancy-Phase 1 ... 11
Table 9: Frequency of Errors-Phase 2 to Phase 8 ... 15
Table 10: Score Difference Range ... 17
Table 11: DEO Wise sample Phase 2 to Phase 8 ... 18
Table 12: Frequency of Errors (Per DEO) ... 19
Table 13: Frequency of Errors per Question (DEO Wise) ... 20
ACRONYMS vi
I
Acronyms
AJK Azad Jammu and Kashmir
BISP Benazir Income Support Programme CMS Case Management System
CNIC Computerized National Identity Card DEO Data Entry Organization
FATA Federally Administered Tribal Areas FGD Focus Group Discussion
GB Gilgit-Baltistan
GPS Global Positioning System
IDS Innovative Development Strategies (Pvt) Ltd
KPK Khyber Pakhtunkhwa
KPO Key Puncher Operator
MIS Management Information System NRO National Roll Out
NADRA National Database and Registration Authority PCO Pakistan Census Organization
PMT Proxy Mean Test
PO Partner Organization
SPSS Statistical Package for Social Sciences SQL Structured Query Language
Data Entry Spot Check Final Report
EXECUTIVE SUMMARY vii
II
Executive Summary
Innovative Development Strategies (IDS) had been contracted by Benazir Income Support Programme (BISP) to assess the accuracy of data entry conducted by the National Database and Registration Authority (NADRA) and its Data Entry Organizations (DEOs). This study evaluates the performance of the DEOs contracted by NADRA for data entry. A sample (batches) of scorecards selected from those forms completed by various Partner Organizations (POs) who had been contracted to collect the scorecard information by BISP, are entered for each of NADRA’s DEO by IDS into a MIS system developed specifically by IDS for this purpose. This data is then compared with the DEO entered data to establish accuracy of data entry. The purpose of this component of the spot check evaluation is to determine the performance of the DEO, the MIS and the accuracy of the data entered in the data base.
The Data Entry Spot Check was conducted over a period of two years in eight different Phases. Phase 1 was completed in August 2011 while Phase 8 was completed in June 2013
Objectives:
IDS was contracted to conduct the Data Entry Spot Check to serve the following specific objectives:
• Test the accuracy of data entry; find out the frequency of incorrect entries • Evaluate the performance of the data entry organizations (DEOs)
• Check to see if there are systematic errors e.g. if the frequency of error is higher for particular questions or if frequency of errors are higher in particular offices of the DEOs
• Provide phased feedback to BISP and NADRA on the quality of data entry
1. Sample Selection
The total sample for the Data Entry Spot Check was 22,000, to be completed in 8 phases (2,750 households in each phase).
For Phase 1, a sample of 2,200 was selected from three segments of the Targeting Survey Spot Check. These included households from the Test Phase, Initial Roll Out in Balochistan and the early Districts of the National Roll Out (NRO) Survey. The sample size extracted from each segment is described as follows:
Test Phase survey segment: 600 households
Initial Roll Out (Balochistan) survey segment: 800 households NRO survey segment: 800 households
1.1.Rejections
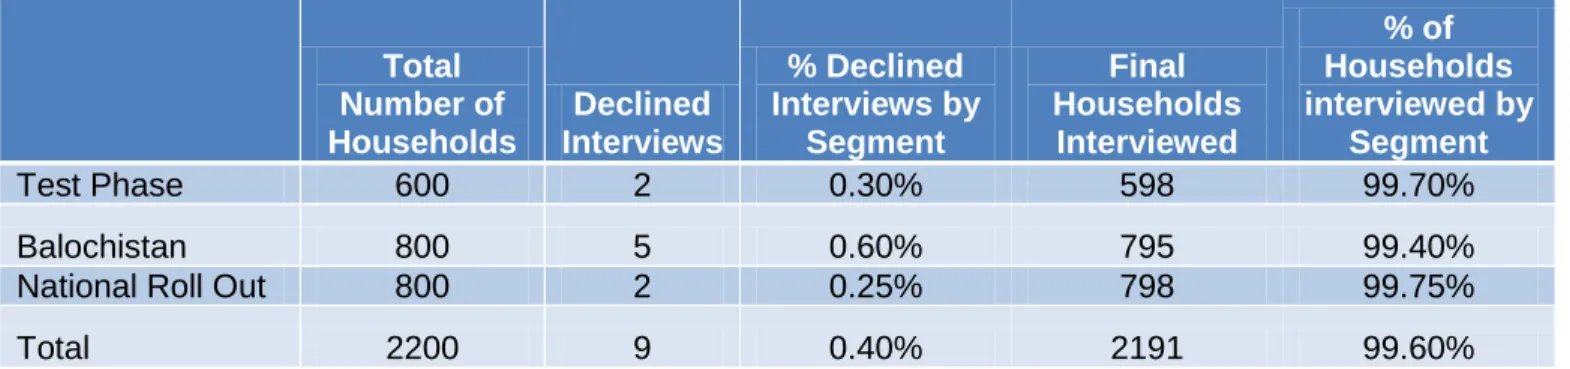
Table 1 shows the Phase 1 sample distributed into 3 segments. A total of 9 forms were rejected out of 2,200 households chosen as the sample for Phase 1 of the Data Entry Spot Check leaving a total sample of 2191 households available for analysis.
EXECUTIVE SUMMARY viii Table 1: Sample Size Phase 1
Total Number of Households Declined Interviews % Declined Interviews by Segment Final Households Interviewed % of Households interviewed by Segment Test Phase 600 2 0.30% 598 99.70% Balochistan 800 5 0.60% 795 99.40%
National Roll Out 800 2 0.25% 798 99.75%
Total 2200 9 0.40% 2191 99.60%
2. Analysis tools
Data entered by IDS is matched and compared with data entered by the DEOs. Indicators have been formulated to measure the extent of discrepancies/incorrect entries and identify their source. Analysis is conducted using indicators that look for systematic errors and variability in accuracy across offices (DEOs). As such, the following indicators were used: Question Indicator: measures the percentage of incorrect entries to determine if particular
questions have heightened inaccuracy
Phase Indicator: compares entries Phase wise in order to identify particular phases which may have a high number of inaccuracies
DEO Indicator: measures the percentage of incorrect entries by each DEO in order to identify DEOs with higher errors
PMT Score Indicator: identifies the percentage of households whose PMT Scores were not calculated by NADRA
3. Methodology
The entire activity was divided into eight phases, where Phase 1 compared the data entry conducted during the Test Phase and initial NRO phases while the remaining seven phases compared the performance of the different DEOs.
Data Entry Spot Check Final Report EXECUTIVE SUMMARY ix 11.40% 8.40% 4.40% 7.80% 0.00% 2.00% 4.00% 6.00% 8.00% 10.00% 12.00%
Test Phase Balochistan NRO Overall
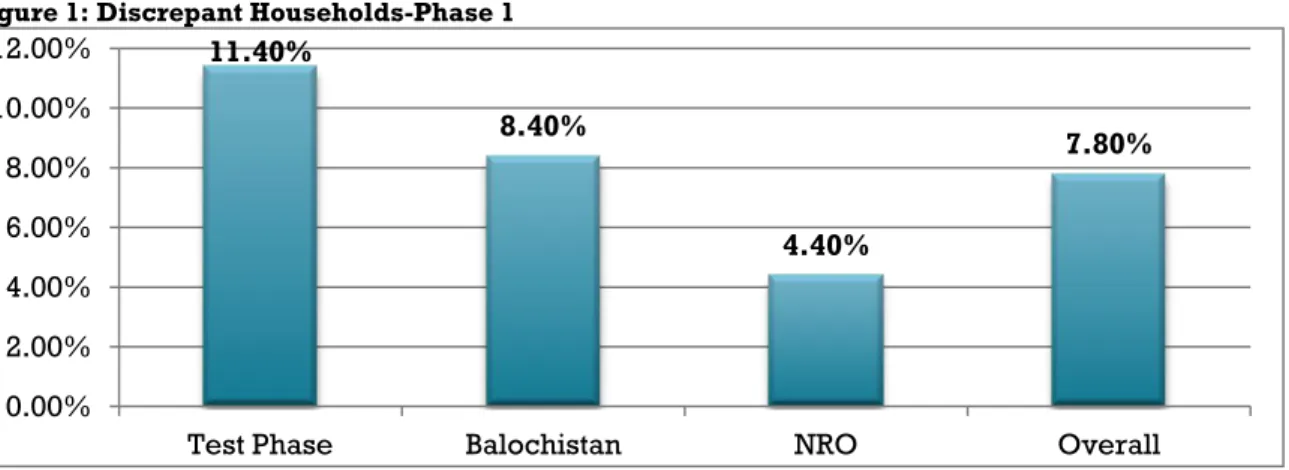
4. Summary of Findings Phase 1
a) Despite numerous safeguards such as double entry system, inbuilt checks and rigorous monitoring put in place by NADRA and its DEOs, data entry errors exist.
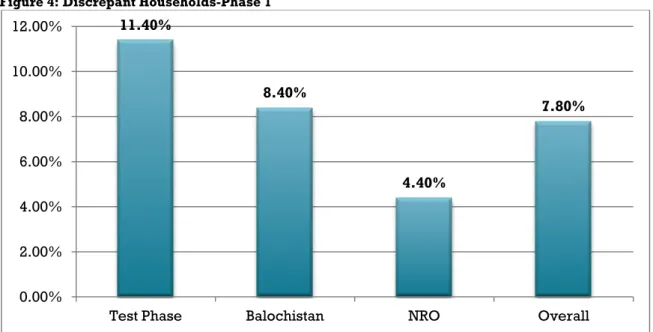
Figure 1: Discrepant Households-Phase 1
b) In Phase 1, overall discrepancy in data entry was found to be 7.80 percent as shown in Figure 1 above
c) The data entry discrepancy rate varied in the 3 segments. It was highest for the Test Phase at 11.4 percent. During the Balochistan segment, the discrepancy rate was 8.4 percent while during the early NRO stage it was further reduced to 4.4 percent. This progressive reduction indicates that BISP and NADRA evaluated data entry procedures after each segment and took effective measures to improve data entry processes and reduce errors.
d) Out of the 7.8 percent discrepant households, 70.6 percent households had only 1 error and 22.4 percent households had 2 errors. The remaining households had 3 or more errors.
e) The three questions in which discrepancy was the largest were: Dependents in Household (21.2%), Children’s Education (12.4%) and Number of Rooms in the house (11.2%)
f) NADRA managed to calculate the PMT score of 88.2 percent of the sample households, however the PMT score of 11.8 percent households could not be calculated.
5. Phase Wise Sample Distribution
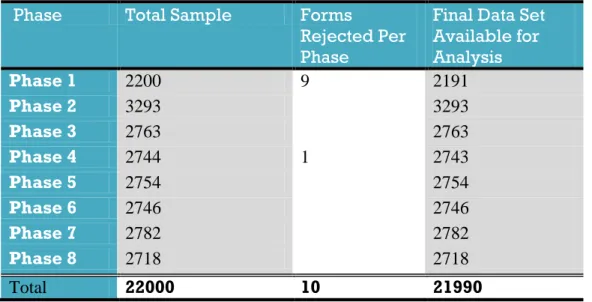
As shown in Table 2 below, a total of 22,000 households were selected as per the sample for all 8 Phases of the Data Entry Spot Check. A Total of 10 forms, 9 from Phase 1 and 1 from Phase 4, were marked as rejected or annulled. Hence the Final Data Set available for analysis was 21,990 households.
Table 2: Total Sample Size
Phase Total Sample Forms Rejected Per Phase
Final Data Set Available for Analysis Phase 1 2200 9 2191 Phase 2 3293 3293 Phase 3 2763 2763 Phase 4 2744 1 2743 Phase 5 2754 2754 Phase 6 2746 2746 Phase 7 2782 2782 Phase 8 2718 2718 Total 22000 10 21990
EXECUTIVE SUMMARY x For Phases 2, 3 and 4 of the Data Entry Spot Check the sample size selected was 8,800
households. This was drawn from the 20,185 matched households of Phase 1 of the Targeting Survey Spot Check exercise.
For Phases 5 and 6 the sample size selected was of 5,500 households. This was drawn from 12,636 matched households of Phase 2 of the Targeting Survey Spot Check exercise.
For Phase 7 and 8 the sample size selected was of 5,500 households. This was drawn from 17,577 matched households of Phase 3 of the Targeting Survey Spot Check exercise.
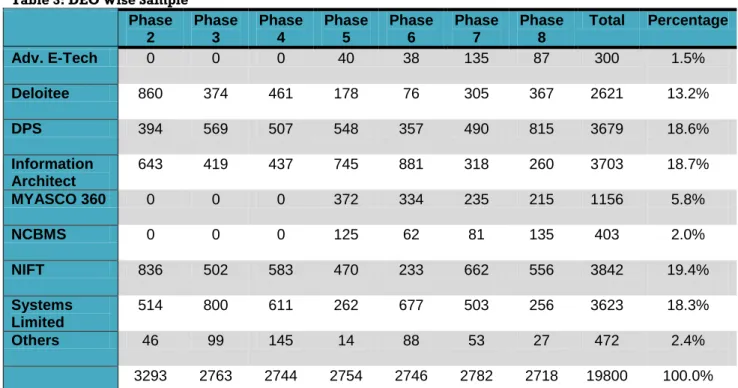
6. DEO Wise Sample Distribution
The sample of the Data Entry Spot Check was selected from the population of matched households enumerated during Phase 1, 2 and 3 of the Targeting Survey Spot Check. The list of matched households was sent to NADRA which provided a list of the DEOs who entered this data. The sample was then selected in proportion to the number of forms entered by the respective DEOs. The identities of the selected sample were provided to NADRA who were asked to provide scanned copies of these households’ T1 forms. The highest percentage of households, 19.4 percent, was allocated to NIFT whereas the lowest percentage of the sample, 1.5 percent was awarded to Adv. E Tech. The sample was selected at random proportions to these distributions.
Table 3 below shows the frequency of forms entered by each DEO and the proportionate sample.
Table 3: DEO Wise Sample
Phase 2 Phase 3 Phase 4 Phase 5 Phase 6 Phase 7 Phase 8 Total Percentage Adv. E-Tech 0 0 0 40 38 135 87 300 1.5% Deloitee 860 374 461 178 76 305 367 2621 13.2% DPS 394 569 507 548 357 490 815 3679 18.6% Information Architect 643 419 437 745 881 318 260 3703 18.7% MYASCO 360 0 0 0 372 334 235 215 1156 5.8% NCBMS 0 0 0 125 62 81 135 403 2.0% NIFT 836 502 583 470 233 662 556 3842 19.4% Systems Limited 514 800 611 262 677 503 256 3623 18.3% Others 46 99 145 14 88 53 27 472 2.4% 3293 2763 2744 2754 2746 2782 2718 19800 100.0%
Data Entry Spot Check Final Report
EXECUTIVE SUMMARY xi
7. Summary of Findings-Overall
a) Despite adopting a double entry system and investing a number of protocols in the MIS to reduce errors, Data Entry errors do exist.
b) BISP and NADRA have implemented a number of measures over a period of time to improve the quality of data entry and eliminate data entry errors.
c) This is validated by the study which shows that data entry error rate in the Test Phase was 11.4 percent. During the Balochistan Phase the error rate was reduced to 8.4 percent. In the National Roll Out it stood at 4.5 percent. This graduated reduction in the data entry error rate is a result of the improvements affected in the Data Entry System by BISP and NADRA. d) The Data Entry Spot Check was spread over a period of two years and gradually conducted
over 8 phases. Analysis and findings of each phase were communicated by IDS to BISP and NADRA at regular intervals. This allowed NADRA to make mid-course corrections where required.
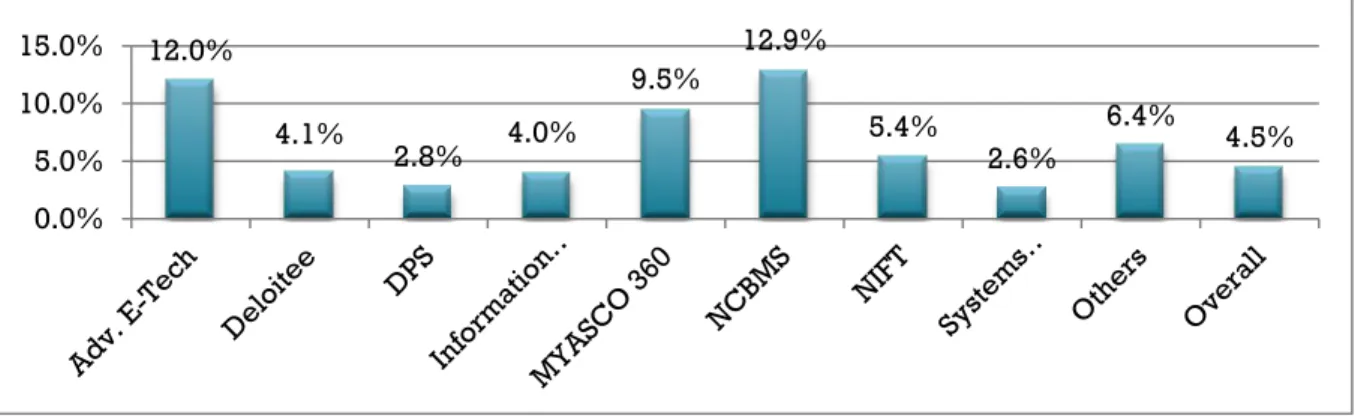
Figure 2: DEO Wise Discrepancy
e) DEO performance can be assessed by the percentage of discrepant households falling in this respective sample shown in Figure 2 above. The highest percentage of errors i.e. 12.9 percent, were conducted by NCBMS followed by Advance E Tech, 12.0 percent and MYASCO 360, 9.8 percent. The least errors were noted by Systems Limited, 2.6 percent and Information Architects, 4.0 percent
f) The DEO’s with the highest rate of errors i.e. NCBMS, Advance E Tech and MYASCO 360 had the lower shares of Data Entry forms allocated by NADRA. NCBMS were allocated 2.0 percent, Advance E Tech 1.5 percent and MYASCO 360 were allocated 5.83 percent of the forms for Data Entry
g) In the 4.5 percent discrepant household the frequency of errors was at times more than one. In 83.9 percent discrepant households the error was in one question. In 12.3 percent discrepant households the error was in two questions and in 2.1 percent discrepant households the error was in three questions.
12.0% 4.1% 2.8% 4.0% 9.5% 12.9% 5.4% 2.6% 6.4% 4.5% 0.0% 5.0% 10.0% 15.0%
EXECUTIVE SUMMARY xii h) The errors in 47.6 percent of the cases were committed in the Question relating to Number of
dependents 22.3 percent errors were committed in the question relating to children’s education.
i) NADRA had not calculated the PMT Score of 4.4 percent of the sample households due to technical reasons.
j) Overall discrepancy in the PMT scores calculated by NADRA and calculated by IDS stood at 2.7 percent.
k) The range bracket of the aforementioned discrepancy was maximum at 44.9 percent in the first bracket i.e. 0-2.99 PMT Score points.
8. CONCLUSION
Conducting the Data Entry Spot Check resulted in an increased reliability of data gathered during the Targeting Survey. As an additional check of the data, this exercise has explained the performance of DEOs contracted by NADRA for data entry. As a result of the analysis and feedback provided by IDS, correctional measures were implemented by BISP and NADRA thus improving quality of data entry over time.
Data Entry Spot Check Final Report
INTRODUCTION 1
III
Introduction
9. Background
9.1. The Benazir Income Support Programme
The Benazir Income Support Programme is the primary social safety net in Pakistan; started by the Government of Pakistan in 2008. The purpose of the programme is to counter the effects of rising food and energy prices on ultra poor households. The BISP gives a cash grant of PKR 1,000 per month to deserving poor families. An additional purpose of the programme is to empower women, therefore only the adult (above 18) female(s) in a household are eligible to receive the cash grant.
The initial allocation for the programme was Rs. 34 billion (USD 425 million) for the year 2008-09, with the objective of targeting 3.5 million families in the financial year 2008-09. The allocation for the fiscal year (2012-2013) has been increased to Rs. 70 billion targeting5.5 million families.
9.2.The Poverty Scorecard
In implementing the programme, the BISP’s first challenge was to develop a fair and transparent method for identifying people deserving of the cash grant. The “Poverty Score Card” was chosen as the instrument with which to achieve this objective.
The poverty scorecard is based on a proxy means testing (PMT), which involves using proxies of income such as personal or family characteristics (e.g. ownership of car).
Literature on the subject revealed this to be the best known method for identifying underprivileged citizens as opposed to national surveys of household income. This is particularly true in a developing country such as Pakistan, where it is difficult to verify income and to value the wealth of poorer households because their assets may not be measurable in currency. This is demonstrated by Sharif (2009), who implemented a proxy means test in Bangladesh to determine if the government was effectively targeting poor households with their safety net programmes. The proxies selected included individual and household characteristics such as household size, location, education level, asset ownership, and characteristics of the house itself. Sharif’s findings suggested that these social welfare programmes were unfair due to inaccuracies in collecting household data and inaccurate cut-off points. Sharif argues that following a PMT based formula allows for quicker and accurate identification of households and potential beneficiaries.
The “Poverty Scorecard” adopted by the BISP uses this PMT methodology. The scorecard uses a small number of indicators which are highly related to poverty and changes in poverty. The criterion for selection of indicators includes how reliably data for the indicator can be collected. Examples of these indicators include household characteristics (e.g. number of rooms), characteristics of household individuals (e.g. age and education), type of latrine, and household durable goods and assets (e.g. electrical appliances, stoves, livestock and cultivable land owned).
INTRODUCTION 2 Each indicator provides a “weight” which is added up to calculate the probability of being poor. A further advantage of the scorecard is that it minimizes costs and risks. If the process is implemented correctly, then the outcome is the ability to identify beneficiaries while ensuring objectivity, eligibility, and transparency.
The Government of Pakistan ultimately chose about16 indicators for the BISP poverty scorecard. These relate to the number of family members in the house, their education levels, number of rooms in the house, type of toilet, asset ownership, livestock ownership, and land ownership, among others. It is this scorecard that is currently used as the instrument in a targeting survey, wherein the scorecard is administered to all households and those households that fall below a pre-defined cut-off score are selected as beneficiaries of the BISP.
Adoption of the poverty scorecard required the BISP to conduct a nationwide household survey to administer the poverty scorecard to each household, collection of these poverty scorecard forms and entry of the data in an accurate database. The authenticities of the household and duplication issues were addressed by verifying the household through the computerized National Identity Card (CNIC) by the National Database and Registration Authority (NADRA). This was a daunting task for the nascent BISP. However to ensure transparencies BISP decided to undertake this immense task. Door to Door Survey for administration of the Poverty Scorecard was conducted through Partner Organization (PO’s) contracted by BISP through a Nationwide bidding process. NADRA was partnered for Data Entry and CNIC Verification.
9.3. Implementation of Scorecard
The Nationwide Survey was undertaken in 2 Phases. The initial Test Phase covered 16 Districts. Third Party Evaluation of the Test Phase was also conducted and lessons learnt were incorporated in order to improve the subsequent National Roll Out (NRO) Phase. A NRO covering the remaining 125 Districts was conducted; the initial work being done by the Pakistan Census Organization (PCO) in 26 Districts of Balochistan. Subsequently, survey work in 98 Districts was initiated through the selected POs. These 98 Districts were grouped into clusters based on geographical regions and were appointed to different PO’s in order to conduct the door to door household survey. Enumerators of PO’s survey teams administered the T1 survey form to respective households and collected information on the household’s roster and assets present in the house.
9.4.Data Entry of Scorecards
The POs handed over all collected information (T1 forms) to the NADRA Headquarters in Islamabad. These were scanned and sent for data entry across the country to the contracted Data Entry Organizations (DEOs). The forms are entered in a MIS developed specifically by NADRA for this programme. This MIS allows for entries such as names, CNIC, address, etc to be verified with NADRA’s database. The software calculates the PMT scores of households, and households below the agreed PMT score are identified as ‘potential beneficiaries’.
Data Entry Spot Check Final Report
INTRODUCTION 3
9.5.Data Entry Spot Check
While all other activities relating to Targeting Survey Spot Checks are important, there may be inaccuracies in the Data Entry done for the questionnaires. This not only causes a lack of complete information for households, but can also result in discrepancies in the PMT score calculation. An inaccurate PMT score calculation leads to selection or selection of non-eligible/eligible households. This directly affects the purpose of the Targeting Survey. Therefore, similar to the importance of the Targeting Survey Spot Check stands the Data Entry Spot Check. Therein lies the motivation of conducting a Spot Check of the Data Entry through a third party to ensure whether the data entered and the results obtained are fair and correct. Identifying deviations in the two data sets determines if the data entered is correct and acceptable.
10. Objectives
The specific objectives of the data entry spot check are as follows:
Test the accuracy of data entry; determine the frequency of incorrect entries. Evaluate the performance of the DEOs.1
Check to see if there are systematic errors e.g. if the frequency of error is higher for particular questions or if frequency of errors are higher in particular offices of the DEOs.
•
Provide Phased feedback to BISP and NADRA on the quality of Data Entry.
1
Performance of DEO refers to how accurately the data entry stations enter data so that a comparison can be made between them.
DATA ENTRY SPOT CHECK METHODOLOGY 4
IV Data Entry Spot Check Methodology
11. Methodology
The Data Entry Spot Check methodology incorporates activities elaborated in Figure 3.
Figure 3: Methodology
12. Analysis tools
Data entered by IDS is matched and compared with data entered by the DEOs. Indicators have been formulated to measure the extent of discrepancies/incorrect entries and identify their source. Analysis is conducted using indicators that look for systematic errors and variability in accuracy across offices (DEOs). As such, the following indicators were used:
5. Analysis
The sample (batches) of selected scorecards are entered by IDS for each of NADRA's DEOs into the MIS developed specifically for this purpose. This data is then compared with the DEO/DES entered
data obtained from the NADRA data base to establish accuracy of data entry 4. T1 Images
The IDs of the selected sample are shared with BISP to attain scanned images of the T1 forms of these households from NADRA
3. Phases
The sample is then divided district wise into phases 2. Sample selection
Once the list of DEOs is received the sample is selected in proportion to the number of households entered by each DEO
1. List of DEOs
The population frame for the selection of Sample is the matched households of the Targeting Survey Spot Check. The list of matched households of that particular phase is forwarded to NADRA through BISP. NADRA provides a list of DEOs who are tasked to enter the data given in the population frame
Data Entry Spot Check Final Report
DATA ENTRY SPOT CHECK METHODOLOGY 5
Question Indicator: measures the percentage of incorrect entries to determine if particular questions have heightened inaccuracy.
Phase Indicator: compares entries Phase wise in order to identify particular phases which may have a high number of inaccuracies.
DEO Indicator: This indicator measures the percentage of incorrect entries by each DEO in order to identify DEOs with higher errors.
PMT Score Indicator: identifies the percentage of households whose PMT Scores were not calculated by NADRA.
13. Logistics
Project Coordinator (Operations) was overall in charge of the Data Entry Spot Check activity. All communication with BISP Headquarters and NADRA including transfer of data, reports at required intervals and other deliverables took place through the Project Coordinator (Operations). The IDS head office supervised the overall activity and performance of the team members. The MIS Manager was responsible for managing all tasks that involved data at various stages. His major responsibilities included: receiving data from the BISP office, development of software for data entry and processing, testing of software, supervising the key punch operators (KPOs) and data editors in data entry and cleaning process, processing data to ensure accuracy and readability to carry out further analysis including the indicators defined in the preceding section.
Key Punch Operators (KPOs) were responsible for data entry into the software specifically designed for this activity. KPOs worked in close coordination with data editors and the MIS Manager. Software data editors were responsible for reviewing and cleaning data entered by the KPOs and providing them with feedback on their performance in order to rule out human error in the data entry stage at IDS. Data analysts worked in close coordination with the MIS Manager and department in evaluating the indicators defined and report writing process.
14. Data Base Development and Data Entry
A database was created at IDS using SQL Server 2000. Data entry was carried out on the basis of double entry and checked carefully to ensure near perfect accuracy, providing a strong base against which to compare the DEOs’ data entry. When a form was entered once by a KPO, a unique key was generated and a colored tag was placed on the form which had information about the name of the KPO, identification code of the KPO who entered the form into the software, source of data (office), number of times the form had been entered into the software i.e. first or second entry, survey phase, quarter number and date of data entry. This was to ensure that each form is entered twice and the unique key ensured traceability of the form in case errors needed to be corrected during data entry. The forms entered twice, as indicated by the information completed on the tag, were then passed on to the MIS department.
15. Monitoring and Supervision of Data Entry
Once the data had been entered into the software, editors in the MIS department reviewed the data entered in each part of the T1 form in order to minimize frequency of any errors. For further verification, both data sets were transferred to SPSS (at random intervals) to allow for
DATA ENTRY SPOT CHECK METHODOLOGY 6 a comparison of the software. This allowed any bugs in the software to be detected. Once the data was verified, it was made available for analysis. The MIS manager then worked in close coordination with the data analysts to get the required outputs for the reports.
16. Hiring and Training of Staff
16.1. Hiring of Staff
Staff is hired from IDS’s existing roster. A total of 25 Key Punch Operators (KPOs) per phase were mandated to carry out the data entry in the IDS database. Additionally, IDS hired Quality Control Officers (software) who were responsible for cleaning the data entered by the KPOs and providing feedback on performance in order to minimize human error.
16.2. Training
The KPOs hired for each phase were the same and became accustomed to the questionnaire and the software. The KPOs were initially trained in a 3 day training workshop and were tested with a mock data entry exercise using the developed MIS software upon completion. In subsequent phases, these trained KPOs were additionally provided one day’s refresher training before starting data entry in order to revive their understanding of the questionnaire, data entry software and different quality/security protocols for data entry.
17. Sample Size for Data Entry Spot Check
17.1. Phase 1
The Sample for Phase 1 of the Data Entry Spot Check was drawn under special instructions of BISP from three segments of the Targeting Survey. Firstly, a sample of 600 households was drawn from the Test Phase Survey. Secondly, 800 households were selected from the Initial Roll Out survey in Balochistan. Additionally, a sample of 800 households was drawn from the earliest phase of the NRO Survey. Thus the total sample size for Phase 1, as shown in Table 4 below, amounted to 2,200 households equating 10 percent of the total sample generated for the Data Entry Spot Check.
Table 4: Phase 1 Sample
Phase 1 Households
Test Phase survey segment: 600
Initial Roll Out(Balochistan) survey segment: 800
National Roll Out survey segment: 800
Total sample size for Phase I: 2200
17.2. Phase 2 to Phase 8
For Phases 2-8 the District Wise sample was generated through a system of random selection from the matched households of the different districts of the Targeting Survey Spot Check. Details of the sample distribution are given below in Table 5.
Data Entry Spot Check Final Report
DATA ENTRY SPOT CHECK METHODOLOGY 7
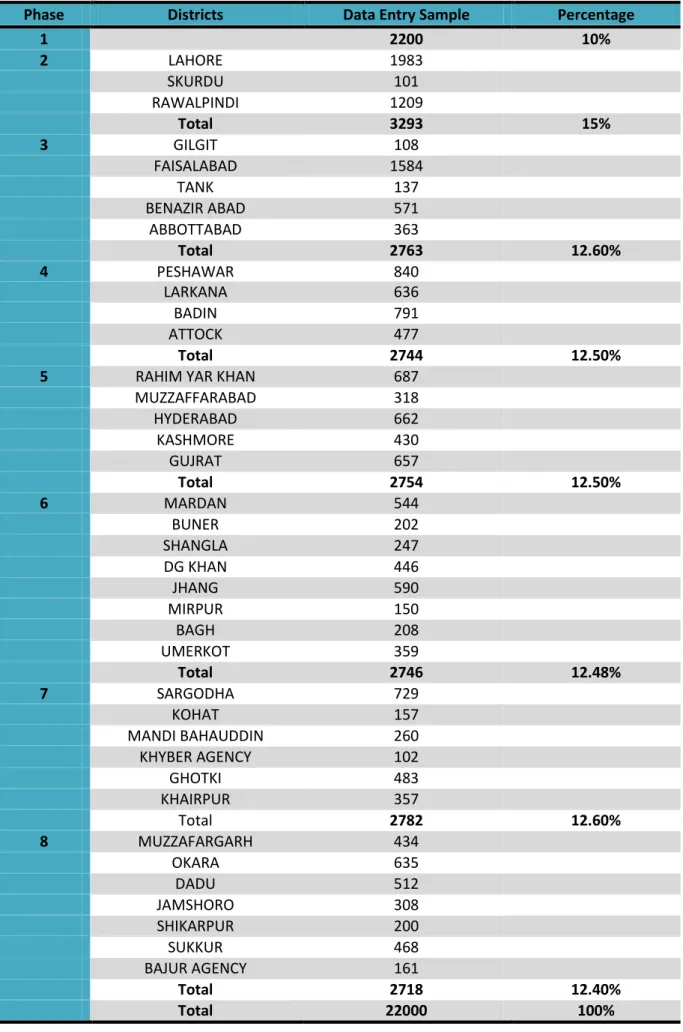
Table 5: Sample-Phase/District Wise
Phase Districts Data Entry Sample Percentage
1 2200 10% 2 LAHORE 1983 SKURDU 101 RAWALPINDI 1209 Total 3293 15% 3 GILGIT 108 FAISALABAD 1584 TANK 137 BENAZIR ABAD 571 ABBOTTABAD 363 Total 2763 12.60% 4 PESHAWAR 840 LARKANA 636 BADIN 791 ATTOCK 477 Total 2744 12.50%
5 RAHIM YAR KHAN 687
MUZZAFFARABAD 318 HYDERABAD 662 KASHMORE 430 GUJRAT 657 Total 2754 12.50% 6 MARDAN 544 BUNER 202 SHANGLA 247 DG KHAN 446 JHANG 590 MIRPUR 150 BAGH 208 UMERKOT 359 Total 2746 12.48% 7 SARGODHA 729 KOHAT 157 MANDI BAHAUDDIN 260 KHYBER AGENCY 102 GHOTKI 483 KHAIRPUR 357 Total 2782 12.60% 8 MUZZAFARGARH 434 OKARA 635 DADU 512 JAMSHORO 308 SHIKARPUR 200 SUKKUR 468 BAJUR AGENCY 161 Total 2718 12.40% Total 22000 100%
DATA ENTRY SPOT CHECK METHODOLOGY 8
18. NADRA’s Data Entry Methodology
NADRA uses the following rule of thumb to calculate the age of household members:
“If Date of birth is given then age is calculated with following formula DOB – Current Fiscal Year (2011-07-01), otherwise given age is considered”
A Room Ratio is the ratio of the number of rooms to the number of household members. As per instructions issued by The World Bank, the total number of household members was to be calculated from the household roster. However, as confirmed, NADRA considers the number of household members as entered for question 24 (back side of the questionnaire) when calculating the room ratio.
The analysis in this report is based on NADRA’s data entry methodology.2
Data Entry Spot Check Final Report
ANALYSIS AND FINDINGS 9
V
Analysis and Findings
19. Dataset Available for Analysis
Table 6: Declined Interviews per Phase
Phase Total Sample Forms
Rejected Per Phase
Final Data Set Available for Analysis Phase 1 2200 9 2191 Phase 2 3293 3293 Phase 3 2763 2763 Phase 4 2744 1 2743 Phase 5 2754 2754 Phase 6 2746 2746 Phase 7 2782 2782 Phase 8 2718 2718 Total 22000 10 21990
Table 6 above gives the number of households interviewed and the number of households which declined to give an interview. The T1 forms of the declined households were blank; 9 households in Phase 1 and 1 household in Phase 4 had declined interviews. Thus the total sample left for analysis was reduced from 22,000 households to 21,990 households.
20. Phase 1 Findings: Test Phase and Initial NRO Comparison
20.1. Discrepant Households:
A discrepancy is identified when there is a difference between data entered for a question by NADRA/DEO and data entered for the same question by IDS. A discrepant household is a household for which there is a discrepancy in at least one question in the form entered for that household. Figure 4 below presents details of the percentage of discrepant households for Phase 1 of the Data Entry Spot Check. During Phase 1 it was reported that the discrepancy between IDS Data Entry and Data Entry done for the Test Phase of the NRO was 11.4 percent. The discrepancy in the data for the Balochistan phase was 8.4 percent while for the National Roll Out Survey (NRO) it was reduced to 4.4 percent. The overall discrepancy for Phase 1 was 7.8 percent of the forms.
ANALYSIS AND FINDINGS 10 Figure 4: Discrepant Households-Phase 1
20.2. Frequency of Errors
As stated earlier, a household data form is identified as discrepant when there is a difference between data entered for a question by NADRA/DEO and data entered for the same question by IDS. The frequency of errors in a single household data entry could be more than 1. Table 7 below shows the frequency of errors in the discrepant forms segment wise. In the Test phase out of the 11.4 percent discrepant household forms, 66.2 percent had one error while 25.0 percent had 2 errors and 4.4 percent had 3 errors. 1.5 percent of these forms had seven errors. In the Balochistan sample out of the 8.4 percent discrepant forms, 67.2 percent had one error and 28.4 percent had two errors. This percentage was reduced to 1.5 percent for three errors. In the early NRO survey, out of the 4.4 percent discrepant households, 85.7 percent had only one error while 5.7 percent had 2 and 3 errors respectively. Overall, 70.6 percent discrepant households had one error while 22.4 percent and 3.5 percent had 2 and 3 errors respectively.
Table 7: Frequency of Errors-Phase 1
Number of Questions with Discrepant Answers
1 2 3 4 5 6 7
Test Phase 66.2% 25.0% 4.4% 0.0% 2.9% 0.0% 1.5%
Balochistan 67.2% 28.4% 1.5% 1.5% 0.0% 1.5% 0.0%
National Roll Out
Survey 85.7% 5.7% 5.7% 2.9% 0.0% 0.0% 0.0% Overall 70.6% 22.4% 3.5% 1.2% 1.2% 0.6% 0.6%
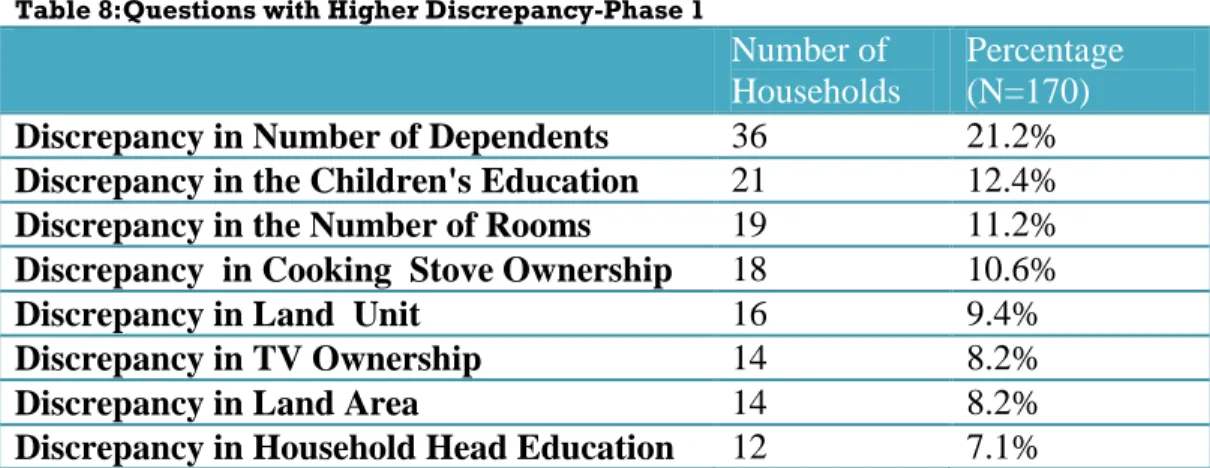
20.3. Questions with Higher Discrepancies
Table 8 below relates to assessing questions/indicators in the questionnaire which have resulted in a high rate of discrepancy. The discrepancy in the question relating to ‘Number of
11.40% 8.40% 4.40% 7.80% 0.00% 2.00% 4.00% 6.00% 8.00% 10.00% 12.00%
Data Entry Spot Check Final Report
ANALYSIS AND FINDINGS 11 Dependents’ was reported at a rate of 21.2 percent. Similarly for children’s education the discrepancy was 12.4 percent while for the Number of Rooms it was at 11.2 percent. Discrepancy rate in questions relating to ownership of cooking stove and land unit was 10.6 percent and 9.4 percent respectively. Other elements of the questionnaire relating to TV Ownership, Land Area and Household Head education showed lower levels of discrepancies as detailed below.
Table 8:Questions with Higher Discrepancy-Phase 1
Number of Households
Percentage (N=170)
Discrepancy in Number of Dependents 36 21.2%
Discrepancy in the Children's Education 21 12.4%
Discrepancy in the Number of Rooms 19 11.2%
Discrepancy in Cooking Stove Ownership 18 10.6%
Discrepancy in Land Unit 16 9.4%
Discrepancy in TV Ownership 14 8.2%
Discrepancy in Land Area 14 8.2%
Discrepancy in Household Head Education 12 7.1%
20.4. PMT Score Calculation
Figure 5 below shows the percentage of households for which PMT scores were calculated by NADRA. According to the findings generated by IDS, in Phase 1 NADRA calculated PMT Scores for 88.2 percent of the households interviewed. The score was however, not calculated for 11.8 percent of the sample, reasons for which are explained as follows:
NADRA does not calculate the PMT scores for households that are marked as empty, annulled or discrepant. According to NADRA, a discrepant household is defined as a household for which there are enumeration errors in the questionnaire, for example, a response was not selected for one or more questions or multiple responses were chosen for a single response question. In this case it is not possible to determine the correct answer. Thus, the household is marked as discrepant and the score is not calculated.
Figure 5: PMT Score calculation
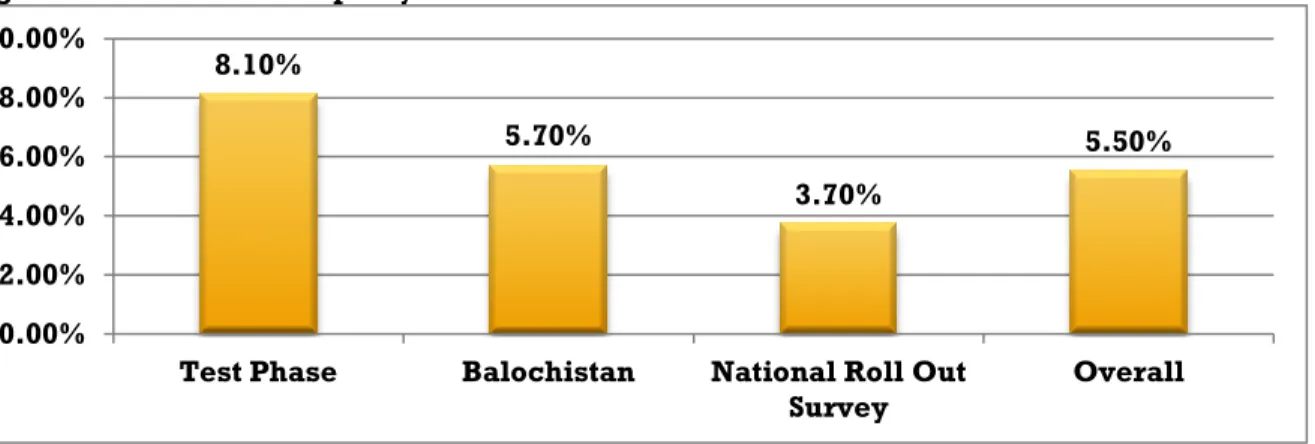
20.5. Discrepancy in PMT Scores
Among the PMT Calculations of 88.2 percent of the households which could be used for comparison, there was an overall discrepancy in 5.5 percent. This means that in 5.5 percent of the forms for Phase 1 the PMT scores calculated by NADRA did not match the PMT scores calculated by IDS.
11.8% 88.2%
ANALYSIS AND FINDINGS 12 Figure 6 below shows that, 8.1 percent of the forms of the Test Phase had discrepant PMT scores. This percentage was calculated as 5.7 percent for Balochistan and 3.7 percent for the initial NRO Phase. Hence out of 88.2 percent of forms being used for PMT Score
comparison, 94.5 percent were non-discrepant forms (did not contain a discrepancy in PMT comparison between NADRA and IDS).
Figure 6: PMT Score Discrepancy
20.6. Score Difference Range
Figure 7 below summarizes the range differences in the two scores. The smallest range of difference was of 0-2.99 PMT score points. For the Test Phase 25.0 percent fell in this margin. The NRO and Balochistan results had 28.6 and 33.3 percent falling in this range respectively. Hence overall 29.0 percent of the discrepancies calculated were in the margin 0-2.99. For the margin 5-7.99, 32.5 percent of discrepancy calculated for the Test Phase fell in this range. Additionally, for the discrepancy calculated for the NRO and Balochistan, 35.7 and 20.5 percent fell in the margin 5-7.99 respectively. Overall 29.0 percent fell in the range 5-7.99 for all three segments of data. A small percentage of inclusions of PMT score variations were observed to have fallen in the margin 8-10.99 PMT score points. An overall percentage of only 6.5 percent fell in this range, whereas in the case of 11.2 percent the range was greater than 11.
8.10% 5.70% 3.70% 5.50% 0.00% 2.00% 4.00% 6.00% 8.00% 10.00%
Test Phase Balochistan National Roll Out Survey
Data Entry Spot Check Final Report
ANALYSIS AND FINDINGS 13 Figure 7: Score Difference Range-Phase 1
20.7. Summary of Findings Phase 1
a) Despite numerous safeguards such as double entry system, inbuilt checks and rigorous monitoring put in place by NADRA and its DEOs, data entry errors exist
b) In Phase 1, overall discrepancy in data entry was found to be 7.8 percent
c) The data entry discrepancy rate varied in the 3 segments. It was highest for the Test Phase at 11.4 percent. In the Balochistan segment, the discrepancy rate was 8.4 percent while in the early NRO stage it was further reduced to 4.4 percent. This progressive reduction indicates that BISP and NADRA evaluated data entry procedures after each segment and took effective measures to improve data entry procedures and reduce errors.
d) Out of the 7.8 percent discrepant households, 70.6 percent households had only 1 error and 22.4 percent households had 2 errors. The remaining households had 3 or more errors.
e) The three questions in which discrepancy was the highest are: Dependents in household (21.2%), Children’s Education (12.4%) and Number of Rooms in the house (11.2%).
f) NADRA had calculated the PMT score of 88.2 percent of the sample households, but PMT score of 11.8 percent households could not be calculated.
0-2.99 3-4.99 5-7.99 8-10.99 >=11
Test Phase 25.0% 25.0% 32.5% 7.5% 10.0%
National Roll Out Survey 28.6% 28.6% 35.7% 3.6% 3.6%
Balochistan 33.3% 20.5% 20.5% 7.7% 17.9% Overall 29.0% 24.3% 29.0% 6.5% 11.2% 0.0% 5.0% 10.0% 15.0% 20.0% 25.0% 30.0% 35.0% 40.0%
ANALYSIS AND FINDINGS 14 20.8. Conclusion Phase 1
Overall the findings of this phase clearly show that as a result of studies and resultant improvements incorporated in the system by BISP and NADRA, there is significant improvement in the Quality of Data Entry. The number of discrepant households in the Test Phase was 11.4 percent which reduced to 8.4 percent in the Balochistan phase and significantly reduced to 4.4 percent in the National Roll Out Phase. This reduction was also evident in the PMT Scores calculations.
Data Entry Spot Check Final Report
PHASE WISE ANALYSIS 15
VI
Phase Wise Analysis
The Data Entry Spot Check was conducted in eight phases spread over a period of two years; the purpose is to allow NADRA to complete its data entry processes and to provide timely analysis on the quality of Data Entry to BISP and NADRA. This section of the report presents the Phase Wise Analysis done for the given indicators.
21. Phase Wise Findings
21.1. Discrepant Households
Figure 8 below shows Phase wise calculations for Discrepant Households. Discrepancies in Phases 2 to 8 generally remained between 3.6 percent and 5.3 percent. The least discrepancy was observed as 3.6 percent in Phase 6. The cumulative discrepancy of all phases was calculated at 4.5 percent.
Figure 8: Discrepant Households
21.2. Frequency of Errors
Frequency of Errors is defined as the number of errors committed in a single household form. Overall, for Phase 2 to 8, data entry errors were committed in 4.5 percent of the sampled household forms. Tale 9 below shows that in 86.4 percent of the forms only one error was committed. Two errors were committed in 10.3 percent households, three errors in 1.8 percent households and more than 3 three errors in 0.8 percent households. Table 10 also shows Phase wise distribution of these errors.
Table 9: Frequency of Errors-Phase 2 to Phase 8
Phase 1 2 3 4 5 7 8 2 78.8% 15.2% 5.3% 0.8% 0.0% 0.0% 0.0% 3 85.7% 13.3% 1.0% 0.0% 0.0% 0.0% 0.0% 4 76.1% 18.1% 2.2% 1.4% 0.7% 0.7% 0.7% 5 94.4% 4.0% 0.8% 0.8% 0.0% 0.0% 0.0% 6 93.9% 5.1% 0.0% 1.0% 0.0% 0.0% 0.0% 7 89.1% 7.5% 0.7% 2.7% 0.0% 0.0% 0.0% 8 88.9% 8.3% 2.1% 0.0% 0.7% 0.0% 0.0% Overall 86.4% 10.3% 1.8% 1.0% 0.2% 0.1% 0.1% 4.00% 3.80% 5.00% 4.50% 3.60% 5.30% 5.30% 4.50% 0.00% 2.00% 4.00% 6.00% 2 3 4 5 6 7 8 Overall
PHASE WISE ANALYSIS 16 21.3. PMT Score Calculation
As shown in Figure 9 below, for Data Entry Phase 2 to Phase 8, NADRA calculated PMT Scores for 95.6 percent of the sample. Calculation of the PMT Score was not done for 4.4 percent of the sample for reasons mentioned earlier in paragraph 19.4.
Figure 9: PMT Score Calculation by NADRA
21.4. PMT Score Discrepancy
Figure 10 below shows PMT Score Discrepancy between the forms entered by NADRA and IDS. The highest percentage of discrepancy calculated is shown for Phase 6 i.e. 3.10 percent. For Phase 2 this percentage is 2.4 percent while for Phase 3 the discrepancy in PMT Score calculation is 2.7 percent. For Phases 2 to 8 the discrepancy calculated varied slightly above and below the overall average discrepancy calculated for the Data Entry Spot Check i.e. 2.7 percent.
Figure 10: PMT Score Discrepancy
21.5. Score Difference Range
Table 10 below shows the PMT Score deviations per Phase. Overall, in 44.9 percent of the cases the difference range was 0-2.99 PMT score points. 15.8 percent of the discrepant scores ranged in the bracket 3-4.99 points and in 35.0 percent of the cases the discrepancy range fell in the bracket of 5-7.99 poverty scorecard points. The remaining 1.8 percent and 2.5 percent fell in higher brackets.
4.4% 95.6%
0% 20% 40% 60% 80% 100%
Score Not Calculated by NADRA
Score Calculated by NADRA
2.40% 2.70% 2.90% 2.70% 3.10% 2.70% 2.70% 2.70% 0.00% 0.50% 1.00% 1.50% 2.00% 2.50% 3.00% 3.50% 2 3 4 5 6 7 8 Overall
Data Entry Spot Check Final Report
PHASE WISE ANALYSIS 17 Table 10: Score Difference Range
Phase 0-2.99 3-4.99 5-7.99 8-10.99 Higher than 11
2 45.30% 9.30% 41.30% 1.30% 2.70% 3 56.20% 15.10% 27.40% 0.00% 1.40% 4 43.70% 11.30% 36.60% 7.00% 1.40% 5 34.70% 26.40% 33.30% 1.40% 4.20% 6 59.00% 16.90% 21.70% 0.00% 2.40% 7 37.50% 12.50% 43.10% 2.80% 4.20% 8 34.80% 19.70% 43.90% 0.00% 1.50% Overall 44.90% 15.80% 35.00% 1.80% 2.50%
DEO PERFORMANCE 18
VII
DEOs Performance
The main objective of the Data Entry Spot Check was to assess the performance of the DEOs and communicate the findings of the Spot Check to BISP and NADRA at regular intervals. This allowed BISP and NADRA to put into effect necessary controls and checks, thereby improving the quality of data entry.
22. DEO Wise Findings
22.1. Sample Phase 2 – 8 DEO Wise
The sample of the Data Entry Spot Check was selected from the population of matched households enumerated during Phase 1, 2 and 3 of the Targeting Survey Spot Check. The list of matched households was sent to NADRA which provided a list of the DEOs who entered this data. The sample was then selected in proportion to the number of forms entered by the respective DEOs. The identities of the selected sample were provided to NADRA who were asked to provide the scanned copies of the T1 forms of these households. Table 11 below shows the distribution percentages awarded to different DEOs. The highest percentage of households, 19.4 percent, was allocated to NIFT whereas the lowest percentage of the sample, 1.5 percent was awarded to Adv. E Tech. The sample was selected at random proportions to these distributions.
Table 11: DEO Wise sample Phase 2 to Phase 8
Phase 2 Phase 3 Phase 4 Phase 5 Phase 6 Phase 7 Phase 8 Total Percentage Adv. E-Tech 0 0 0 40 38 135 87 300 1.5% Deloitee 860 374 461 178 76 305 367 2,621 13.2% DPS 394 569 507 548 357 490 815 3,679 18.6% Information Architect 643 419 437 745 881 318 260 3,703 18.7% MYASCO 360 0 0 0 372 334 235 215 1,156 5.8% NCBMS 0 0 0 125 62 81 135 403 2.0% NIFT 836 502 583 470 233 662 556 3,842 19.4% Systems Limited 514 800 611 262 677 503 256 3,623 18.3% Others 46 99 145 14 88 53 27 472 2.4% 3,293 2,763 2,744 2,754 2,746 2,782 2,718 19,800 100.0%
Data Entry Spot Check Final Report
DEO PERFORMANCE 19
22.2. Discrepant Households
Figure 11 shows DEO Wise percentage of Data Entry errors. For all the DEOs with the exception of DPS and Systems Limited, the percentage of the errors was equal to or above 4.0 percent. The highest percentage of errors was noted for NCBMS and Advance E-Tech, 12.9 percent and 12 percent respectively, while the lowest percentage of errors was registered by Systems Limited at 2.6 percent and DPS at 2.8 percent. Overall the error rate stood at 4.5 percent. Figure 11 when studied in conjunction with Table 11, reveals that the DEOs with the highest rate of errors i.e. NCBMS, Advance E Tech and MYASCO 360 had lower shares of Data Entry forms allocated by NADRA. NCBMS was allocated 2.0 percent, Advance E Tech 1.5 percent and MYASCO 360 was allocated 5.83 percent of the forms for Data Entry (Table 11).
Figure 11: Discrepant households-DEO Wise
22.3. Frequency of Errors
Overall, for Phase 2 to 8, data entry errors were committed in 4.5 percent of the sampled household forms. Table 12 below shows that in 86.4 percent of the forms only one error was committed. Two errors were committed in 10.3 percent households, three errors in 1.8 percent households and more than 3 three errors in 0.8 percent households. Table 12 also shows DEO wise distribution of these errors.
Table 12: Frequency of Errors (Per DEO)
1 2 3 4 5 7 8 Adv. E-Tech 91.7% 8.3% 0.0% 0.0% 0.0% 0.0% 0.0% Deloitee 86.1% 10.2% 2.8% .9% 0.0% 0.0% 0.0% DPS 92.2% 4.9% 1.9% 0.0% 1.0% 0.0% 0.0% Information Architect 87.8% 11.5% 0.7% 0.0% 0.0% 0.0% 0.0% MYASCO 360 91.8% 6.4% 0.9% 0.0% 0.9% 0.0% 0.0% NCBMS 88.5% 11.5% 0.0% 0.0% 0.0% 0.0% 0.0% Systems Limited 88.4% 8.4% 2.1% 1.1% 0.0% 0.0% 0.0% Others 76.7% 16.7% 3.3% 3.3% 0.0% 0.0% 0.0% Overall 86.4% 10.3% 1.8% 1.0% 0.2% 0.0% 0.0% 12.0% 4.1% 2.8% 4.0% 9.5% 12.9% 5.4% 2.6% 6.4% 4.5% 0.0% 5.0% 10.0% 15.0%
DEO PERFORMANCE 20 Table 13 below is with reference to assessing questions/indicators in the Questionnaire which have resulted in a higher rate of discrepancy. The highest overall discrepancy at 47.6 percent was in the question on number of dependents. The second highest discrepancy at 22.3 percent was in the question relating to children’s education. DEO wise discrepancy in questions is given in the Table below.
Table 13: Frequency of Errors per Question (DEO Wise)
A dv. E -T ech Del oi tee DPS Inf or m a ti on A rc hi tect MY A SC O 360 N C B MS N IF T Sy stems L im ited Oth er s Over a ll Discrepancy in Number of Dependents 61.1% 36.1% 60.2% 48.6% 58.2% 71.2% 32.4% 51.6% 36.7% 47.6% Discrepancy in Children’s Education 16.7% 20.4% 31.1% 23.0% 27.3% 13.5% 13.5% 30.5% 33.3% 22.3% Discrepancy in TV Ownership 5.6% 5.6% 1.9% 2.70% 1.80% 3.8% 8.2% 0.0% 6.7% 4.2% Discrepancy in Household Head Education 0.0% 8.3% 1.9% 3.40% 0.0% 1.9% 6.30% 2.1% 0.0% 3.6% Discrepancy in Cooking stove Ownership 2.8% 1.9% 0.0% 2.0% 0.0% 0.0% 10.1% 0.0% 0.0% 3.0% Discrepancy in Motorcycle Ownership 5.6% 2.8% 0.0% 2.0% 1.8% 00% 4.8% 1.1% 10.0% 2.7% 22.1. PMT Score Discrepancy
Discrepancy in PMT Scores is the variation in the PMT Score of a household calculated by NADRA and IDS. Figure 12 below shows the Discrepancy in the scores DEO wise. Advance E Tech, NCBMS and Others had the highest level of discrepancies in PMT Scores at 5.5 percent, 6.8 percent and 10 percent respectively. Systems Limited 1.2 percent and DPS 1.3 percent had the lowest rate of discrepancy. Overall variation in PMT Score calculation was reported at 2.7 percent for Data Entry performed by NADRA as compared to the Data Entry done by IDS.
Data Entry Spot Check Final Report
DEO PERFORMANCE 21
Figure 12: PMT Score Discrepancy-DEO Wise
22.2. Score Difference Range
Table 14 below gives details of the discrepancy of PMT Score range of different DEOs. In the smallest range of variation 0-2.99, 44.9 percent of data entry errors were included. As shown in the table, 52.9 percent of errors incurred by Deloitee are included in this margin. A high percentage of errors identify a lower variation in the PMT Score points during the data entry process. NCBMS had the lowest percentage of discrepancies falling in this margin, at 26.9 percent. Consequently a higher percentage of errors were incurred by NCBMS that fell in the range ‘higher than 11’.
Table 14: Score difference Range (DEO Wise)
Score Difference Range
0-2.99 3-4.99 5-7.99 8-10.99 Higher than 11 Adv. E-Tech 31.3% 18.8% 50.0% 0.0% 0.0% Deloitee 52.9% 15.7% 27.5% 3.9% 0.0% DPS 40.4% 23.4% 36.2% 0.0% 0.0% Information Architect 44.7% 19.3% 30.7% 0.9% 4.4% MYASCO 360 40.0% 14.5% 45.5% 0.0% 0.0% NCBMS 26.9% 23.1% 38.5% 3.8% 7.7% NIFT 41.7% 12.5% 37.5% 4.2% 4.2% Systems Limited 32.5% 15.0% 50.0% 0.0% 2.5% Others 83.7% 4.7% 11.6% 0.0% 0.0% Overall 44.9% 15.8% 35.0% 1.8% 2.5%
In 44.9 percent of the PMT Score discrepant households the discrepancy ranged from 0 to 2.99 points. In 15.8 percent households, it ranged from 3 to 4.99 points and in 35 percent cases it ranged between 5 to 7.99 PMT Score points. In cases where the overall score difference was 1.8 percent and 2.5 percent, the range varied from 8 to 10.99 and higher than 11 points respectively. Overall in about 40 percent of the cases the error range was significant; 5 points or more.
5.5% 2.0% 1.3% 3.3% 4.9% 6.8% 3.3% 10.0% 1.2% 2.7% 0.0% 2.0% 4.0% 6.0% 8.0% 10.0% 12.0%
SUMMARY OF FINDINGS 22
23.Summary of Findings-Overall
a) Despite adopting a double entry system and investing a number of protocols in the MIS to reduce errors, Data Entry errors still exist.
b) BISP and NADRA have implemented a number of measures over a period of time to improve the quality of data entry and eliminate data entry errors.
c) This is validated by this study which shows that data entry error rate in the Test Phase was 11.4 percent. During the Balochistan Phase the error rate was reduced to 8.4 percent. In the National Roll Out it stands at 4.5 percent. This graduated reduction in the data entry error rate is a result of the improvements affected over time, in the Data Entry System by BISP and NADRA.
d) The Data Entry Spot Check was spread over a period of two years and conducted over 8 phases graduated in time. Analysis and findings of each phase were communicated by IDS to BISP and NADRA at regular intervals. This allowed NADRA to make mid-course corrections and improve error reduction protocols in the data entry MIS.
e) DEO performance can be assessed by the percentage of discrepant households falling in this respective sample. The highest percentage of errors 12.9 percent, were committed by NCBMS followed by Advance E Tech with 12.0 percent and MYASCO 360 with 9.8 percent. The least errors were committed by Systems Limited 2.6 percent, DPS 2.8 percent and Information Architects 4.0 percent.
f) The DEOs with the highest rate of errors i.e. NCBMS, Advance E Tech and MYASCO 360 fortunately had lower shares of Data Entry forms allocated by NADRA. NCBMS were allocated 2.0 percent, Advance E Tech 1.5 percent and MYASCO 360 were allocated 5.83 percent of the forms for Data Entry.
g) In the 4.5 percent discrepant household, the frequency of errors were at times more than one. In 83.9 percent discrepant households the error was in one question. In 12.3 percent discrepant households the error was in two questions and in 2.1 percent discrepant households the error was in three questions.
h) The errors in 47.6 percent of the cases were noted in the question relating to number of dependents while 22.3 percent errors were noted in the question relating to children’s education.
i) NADRA had not calculated the PMT Score of 4.4 percent of the sample households due to technical reasons.
Data Entry Spot Check Final Report
SUMMARY OF FINDINGS 23 j) Overall discrepancy in the PMT scores calculated by NADRA and IDS stood at 2.7 percent. k) The range bracket of the aforementioned discrepancy was maximum at 44.9 percent in the
CONCLUSION 24
24. Conclusion
The Data Entry Spot Check spread across a period of 2 years, has been a very useful tool in determining and improving the quality of data entry. Analysis of the findings for each phase was communicated to BISP and NADRA at regular intervals which allowed for mid-course improvements in the Data Entry Process. Overall NADRA was able to maintain a reasonably good quality standard by ensuring that the cumulative error rate remains below 4.5 percent. Performance of DEOs varied with some DEOs like Systems Limited and DPS maintaining low error rates at 2.6 and 2.8 percent respectively. NCBMS and Advance E Tech performed poorly committing errors at the rate of 12.9 and 12.0 percent respectively. Fortunately DEOs like Systems Limited and DPS which had the lowest discrepancy rate were tasked to enter the bulk of the forms.