Min Wang
Economic Capital Allocation
M
in
W
ang | E
conomic C
apital Allocation | 2016
ISBN 978-952-12-3290-9
9 7 8 9 5 2 1 2 3 2 9 0 9Economic Capital Allocation
Min Wang
Mathematics and Statistics
Faculty of Science and Engineering
˚
Abo Akademi University
˚
ISBN 978-952-12-3290-9
Preface
This thesis would not have been possible to make without the guidance of G¨oran H¨ogn¨as. Thank you for your inspiration, detailed criticism and wise counsel throughout the thesis process. You were abundantly helpful and offered invaluable assistance, support and guid-ance. Thank you for providing me with the great opportunity to study in Finland. Thank you for your efforts in finding financial support for me.
I am profoundly grateful to Lasse Koskinen under whose supervision I chose this topic and started with my Licentiate thesis. Thank you for your helpful comments and valuable suggestions regarding my Licentiate thesis.
I would like to thank the professors, researchers and students at the Department of Math-ematics for the friendly environment and all their helps. Thank you, Paavo Salminen for your course in Financial Mathematics. Thank you, Margr´et Halld´orsd´ottir for your help given in various matters. Thank you, Mikael Kurula for your help with computers. Thank you, Mikhail Stepanov and Brita Jung for kindness. I thank teachers and students from the Finnish Doctoral Programme in Stochastics and Statistics for the friendly atmosphere during seminars and summer schools.
In addition, I want to thank the pre-examiners Andrey Kudryavtsev and Zinoviy Landsman for careful reading of the manuscript.
I am deeply grateful for financial support from the Finnish Doctoral Programme in Stochas-tics and StatisStochas-tics, the Magnus Ehrnrooth foundation, Stiftelsens f¨or ˚Abo Akademi forskn-ingsinstitut, the ˚Abo Akademi University and Suomen Aktuaariyhdistys ry.
I am grateful to family and friends for their support and friendship. Kalle deserves special thanks for his endless encouragement.
˚
Abo, February 2016 Min Wang
Contents
List of papers 3
Abstract 6
Sammanfattning 7
1 Introduction 9
1.1 Main problem of the research . . . 9
1.2 Economic capital . . . 9
1.2.1 What is the economic capital? . . . 10
1.2.2 The purpose of economic capital . . . 11
1.3 Capital allocation . . . 12 1.3.1 Why allocate? . . . 12 1.3.2 Different viewpoints . . . 13 1.3.3 Overview of literature . . . 14 2 Basic concepts 19 2.1 Risk measures . . . 19
2.1.1 Coherent risk measure . . . 20
2.1.2 Important risk measures . . . 22
2.1.2.1 Value at Risk - the quantile risk measure . . . 22
2.1.2.2 Tail Value at Risk . . . 25
2.2 Dependence . . . 28
2.2.1 Correlation . . . 28
2.2.1.1 Pearson’s correlation . . . 28
2.2.1.2 Rank correlation . . . 29
2.2.2.2 Tail dependence . . . 30
2.2.2.3 FGM copula . . . 32
2.2.3 Right Joint Excess Probability . . . 36
2.3 Distributions . . . 36
2.3.1 Elliptical and Log-Elliptical distributions . . . 36
2.3.2 Exponential distribution . . . 39 2.3.3 Pareto distribution . . . 39 2.3.4 Gamma distribution . . . 40 3 Capital allocation 43 3.1 How to allocate? . . . 43 3.2 Different principles . . . 44
3.2.1 Proportional capital contribution . . . 45
3.2.2 Covariance allocation principle . . . 46
3.2.3 Discrete marginal contributions . . . 47
3.3 Optimal capital allocations . . . 49
4 Capital allocation based on tails 53 4.1 Conditional Expectation as Risk Measures . . . 53
4.2 Upper tail covariance . . . 55
4.2.1 The Upper Tail Covariance of bivariate log-elliptical distributions . 56 4.3 Definition of the Tail Covariance Premium Adjusted (TCPA) based allocation 58 4.3.1 Calculation of the capital allocation . . . 60
5 Illustrative case study 63 5.1 Simulation from Normal copula . . . 65
5.1.1 Proportional capital allocation . . . 67
5.1.2 Covariance capital allocation . . . 68
5.2 Simulation from Cauchy copula . . . 68
5.2.1 Proportional capital allocation . . . 69
5.2.2 Covariance capital allocation . . . 70
6 Conclusion 71
Bibliography 73
List of papers
I) Min Wang and Lasse Koskinen, Various Faces of Risk Measures: Internal Model’s Per-spective, page 1-24, Conference ASTIN (Actuarial STudies In Non-life insurance), 1-4 June 2009, Helsinki,
www.actuaries.org/ASTIN/Colloquia/Helsinki/Papers/S1_29_Wang_Koskinen.pdf
Lasse Koskinen wrote the final version.
II) Min Wang, Capital allocation based on the Tail Covariance Premium Adjusted, Insur-ance: Mathematics and Economics, Volume 57, July 2014, Pages 125-131, ISSN 0167-6687, (http://www.sciencedirect.com/science/article/pii/S0167668714000614)
III) Min Wang, On economic capital allocation based on tails, 10 pages, manuscript, 2013 IV) Min Wang, Upper Tail Covariance of Log-elliptical Distributions, 14 pages, manuscript, 2013
Explanation for the article by co-author:
In I), I worked on optimization under variance premium principle, see section 4.2, which is my main initial contribution. I also wrote the section on risk measure. Lasse Koskinen wrote the final version.
Summary of included articles
I) Min Wang and Lasse Koskinen, Various Faces of Risk Measures: Internal Model’s Per-spective, page 1-24, Conference ASTIN (Actuarial STudies In Non-life insurance), 1-4 June 2009, Helsinki
In this article, we consider several aspects of risk measures from the internal models perspective. We critically review the most widely used classes of risk measures. Es-pecially, we attempt to clear up some of the most commonly misconstructed aspects: the choice between risk measures, and practical data and forecasting issues, like the importance of robustness. As a new result, solvency capital requirement is optimized under variance premium principle. The use of tail conditional trimmed mean is pro-posed as a robust risk estimator. One objective of this article is to emphasize that one single risk measure or a specific axiomatic system is not appropriate for all purposes. II) Min Wang, Capital allocation based on the Tail Covariance Premium Adjusted, Insur-ance: Mathematics and Economics, Volume 57, July 2014, Pages 125-131, ISSN 0167-6687 The current Solvency II process makes risk capital allocation to different business lines more and more important. This paper considers two business lines with the exponen-tial loss distributions linked by a Farlie-Gumbel-Morgenstern (FGM) copula, modelling the dependence between them. As allocation principle we use the Tail Covariance Pre-mium Adjusted (TCPA) and obtain expressions for the allocation to the two business lines. III) Min Wang, On economic capital allocation based on tails, 10 pages, manuscript, 2013 In this paper, we introduce a new risk measure, Tail Covariance Premium Adjusted (TCPA). When choosing this risk measure in the proportional capital allocation case, the correlation comes to play a role for capital allocation, but not too large a role as in the case of the covariance capital allocation principle. Tail Covariance Premium Adjusted (TCPA) includes TVaR and the covariance at the tail of the sum of risks. IV) Min Wang, Upper Tail Covariance of Log-elliptical Distributions, 14 pages, manuscript, 2013
During the financial crisis, significant changes in the insurance and financial markets are 4
giving increasing attention to the dependence of major losses. Recently, there has been growing interest among insurance and investment experts to focus on the relationship of major claims in insurance or major losses in investment worlds. In this paper we throw light upon the relationship of two claims when both exceed certain thresholds. We in-troduce the concept of Upper Tail Covariance, a covariance of two claims conditional on both exceeding some thresholds. We investigate the Upper Tail Covariance in log-elliptical cases. The log-elliptical distributions are a family of distributions that include the more fa-miliar log-normal distribution. The class of log-elliptical distributions has been introduced in the applications in insurance and actuarial science. There is a fair amount of discussion of this important class as a tool for modelling risk dependencies. We derive expressions of Upper Tail Covariance for log-elliptical distributions. The theoretical results are illus-trated by considering log-normal distributions. Numerical examples illustrate the concept in log-normal settings. The new concept Upper Tail Covariance can be a risk measure or part of capital allocation principles.
Abstract
For my Licentiate thesis, I conducted research on risk measures. Continuing with this research, I now focus on capital allocation. In the proportional capital allocation principle, the choice of risk measure plays a very important part.
In the chapters Introduction and Basic concepts, we introduce three definitions of eco-nomic capital, discuss the purpose of capital allocation, give different viewpoints of capital allocation and present an overview of relevant literature. Risk measures are defined and the concept of coherent risk measure is introduced. Examples of important risk measures are given, e. g., Value at Risk (VaR), Tail Value at Risk (TVaR). We also discuss the implications of dependence and review some important distributions.
In the following chapter on Capital allocation we introduce different principles for allocat-ing capital. We prefer to work with the proportional allocation method.
In the following chapter, Capital allocation based on tails, we focus on insurance business lines with heavy-tailed loss distribution. To emphasize capital allocation based on tails, we define the following risk measures: Conditional Expectation, Upper Tail Covariance and Tail Covariance Premium Adjusted (TCPA).
In the final chapter, called Illustrative case study, we simulate two sets of data with five insurance business lines using Normal copulas and Cauchy copulas. The proportional cap-ital allocation is calculated using TCPA as risk measure. It is compared with the result when VaR is used as risk measure and with covariance capital allocation.
In this thesis, it is emphasized that no single allocation principle is perfect for all purposes. When focusing on the tail of losses, the allocation based on TCPA is a good one, since TCPA in a sense includes features of TVaR and Tail covariance.
Sammanfattning
F¨oreliggande avhandling behandlar riskhantering, riskm˚att och allokering av riskkapital p˚a olika aff¨arsomr˚aden inom bolag som ¨ar speciellt riskben¨agna, t.ex. f¨ors¨akringsbolag. I min licentiatavhandling studerade jag begreppet riskm˚att. I min fortsatta forskning har huvudintresset legat p˚a allokering av kapital. H¨arvid kan konstateras att valet av specifikt riskm˚att har en mycket stor betydelse, i synnerhet om man v¨aljer den s.k. proportionella allokeringsmetoden.
I kapitlen 1 och 2 introduceras definitionen av ekonomiskt kapital, diskuteras f¨or- och nack-delarna med ett dylikt begrepp ur olika synvinklar samt ges en ¨oversikt av relevant litter-atur. Riskm˚att definieras och det viktiga begreppet koherent riskm˚att diskuteras och exem-plifieras. Viktiga riskm˚att som anv¨ands i praktisk bank- och f¨ors¨akringsverksamhet ¨ar bl.a.
Value at Risk (VaR) och Tail Value at Risk (TVaR). Problem som sammanh¨anger med beroende mellan skadetyper diskuteras och ett antal ofta anv¨anda sannolikhetsf¨ordelningar presenteras.
I kapitel 3 presenteras olika typer av principer som anv¨ands f¨or kapitalallokering. I denna avhandling arbetas f¨oretr¨adesvis med den s.k. proportionella allokeringsmetoden.
Kapitel 4 behandlar allokeringsmetoder baserade p˚a f¨ordelningens ”svans”, dvs. p˚a stora va¨rden p˚a utfallet/skadan. Fokus ligger p˚a fo¨rsa¨kringsslag med s.k. tjocksvansade f¨ordelningar. Karakteristiska f¨or dessa ¨ar att mycket stora utfall kan f¨orekomma med r¨att stor sanno-likhet. Riskm˚att som bygger p˚a f¨ordelningarnas svans ¨ar t.ex. Conditional Expectation,
Upper Tail Covariance ochTail Covariance Premium Adjusted (TCPA).
I kapitel 5 illustreras teorin med n˚agra simulerade fallstudier da¨r beroendefo¨rh˚allanden mel-lan olika f¨ors¨akringsslag uttrycks genom s.k. copulas. Proportionella allokeringsprincipen med TCPA som riskm˚att till¨ampas. Det fallet j¨amf¨ors med VaR som riskm˚att och ko-variansallokering. D˚a tyngdpunkten ligger p˚a extrema utfall ¨ar TCPA ett bra verktyg, eftersom den kombinerar drag av Tail Covariance och VaR. N˚agot riskm˚att som ¨ar b¨ast i alla situationer finns dock inte.
Chapter 1
Introduction
1.1
Main problem of the research
The main problem of the research is how to allocate economic capital to different business lines. There are many different methods of allocation proposed in research papers. This thesis will put emphasis on capital allocation based on tails, since the major losses by definition are tail events. The thesis will start with the basic concepts of economic capital and allocation.
1.2
Economic capital
A bank or an insurance company always faces some risks that could cause a financial loss. Economic capital is the realistic amount of capital that is needed to cover losses at a certain risk tolerance level (Shaw et al. (2010) [51]).
1.2.1
What is the economic capital?
In theSpecialty Guide on Economic Capital [52] (2004), the authors found that there is no one consistent definition of economic capital in use in the marketplace. Definitions in use are numerous, but the following three main definitions, based on 77 responses to EC survey (2002), demonstrate the main themes of the various practical alternatives currently in use.
• Definition 1
Economic capital is defined as sufficient surplus to meet potential negative cash flows and reductions in value of assets or increases in value of liabilities at a given level of risk tolerance, over a specified time horizon.
• Definition 2
Economic capital is defined as the excess of the market value of the assets over the fair value of liabilities required to ensure that obligations can be satisfied at a given level of risk tolerance, over a specified time horizon.
• Definition 3
Economic capital is defined as sufficient surplus to maintain solvency at a given level of risk tolerance, over a specified time horizon.
Valdez (2012) [65] thinks that it is the amount set aside, usually in excess of assets backing all liabilities, so that the company:
• could withstand and absorb ”unexpected losses” from all risks it is facing;
• would remain solvent with high probability; and
• is able to cover obligations to its customers as promised.
It captures a wide spectrum of risks such as insurance risk, market risk, credit risk and operational risk, as well as dependencies between them and various other complexities such as transferability of capital, and expresses all of this as a single number.
1.2.2
The purpose of economic capital
Calculating the economic capital for a firm has its many purposes, see the list from the
Specialty Guide on Economic Capital [52] (2004). The list is not intended to be exhaus-tive, but it does capture the major uses of economic capital in today’s insurance industry environment:
1. Determination of the company or product risk profile 2. Capital budgeting
3. Evaluation of required capital in merger and acquisition situations 4. Insurance product pricing
5. Risk tolerances and constants 6. Asset/liability management
7. Calculating Risk-Adjusted Return on Capital 8. Performance Measurement
9. Incentive Compensation
10. Rating agency and regulatory discussions
A company may do an economic capital calculation according to external criteria laid down by the regulators for regulatory capital purposes or other criteria, e.g., to satisfy specific standards prescribed by a rating agency.
Currently the most popular risk measure used in banking and insurance is the one-year 99.5% Value at Risk (VaR). For example, under the UK’s Individual Capital Assessment (ICA) regime and Solvency II, an insurance company needs to hold enough capital such that there is a probability of 99.5% of survival over a one-year time horizon, or in other words, the probability of insolvency over 12 months is no more than 0.5%.
risk management and hedging, capital allocation, performance management and financial reporting, see Corrigan et al. (2009) [10].
Economic capital can be calculated by risk measures. This is very important part in risk management.
1.3
Capital allocation
Dhaene et al. (2011) [19] and Valdez (2012) [65] give a definition of capital allocation, the term typically referring to the subdivision of the aggregate capital held by the firm across its various constituents, e.g.
• lines of business
• its subsidiaries
• product types within line of business
• types of risks: e.g. market, credit, pricing/underwriting, operational
• territories, e.g. distribution channels
In the slides from Valdez (2012) [65], capital allocation is a very important component of enterprise risk management, such as, identifying, measuring, pricing and controlling risks.
1.3.1
Why allocate?
There are many opinions about why to allocate capital. Most agree that allocation to different business lines is a risk management for pricing or performance measurement, see Corrigan et al. (2009) [10], DiCaro (2010) [21] and Dhaene et al. (2011) [19].
Holding economic capital is a cost. The cost needs to be allocated across business lines. At the same time, the allocated cost also makes the return of business lines more clear. That can be used to judge the performance of the different lines.
In Venter (2004) [66], capital allocation is generally not an end in itself, but rather an intermediate step in a decision-making process. In Bodoff (2009) [7], how a firm allocates capital, similar to other cost allocation decisions, can significantly affect the measured profitability of a particular line of business. Moreover, allocating capital can affect target pricing margins and the volume of business the company writes in each line of business and product type. As a result, the topic is critically important and often the subject of contentious debate among the heads of the firm’s various business units.
DiCaro (2010) [21] answered why we are allocating capital as follows:
• Determine which business units are most profitable relative to the risk they bring to the enterprise
• Include a risk charge in pricing
• Compensation/performance management
• Regulatory/Rating compliance?
• Enterprise Risk Management (ERM) processes allocate capital to risk categories: catastrophe risk, market risk, counterparty risk ...
1.3.2
Different viewpoints
In Dhaene et al. (2011) [19], there are some different viewpoints about capital allocation.
• Owners’ i.e. shareholders’
Allocating capital may help to identify areas of risk consumption within a given orga-nization and support the decision making concerning business expansions, reductions or even eliminations.
• Business line managers’
A good allocation helps evaluate performance of his own business line and compare with other business lines. It allows one to distinguish the most profitable business
• Regulators’
The regulator, primarily sharing the interests of depositors and policyholders, estab-lishes rules to determine the required capital to be held by the company. From a capital allocation perspective, the regulators will be concerned to see that capital is optimally used within the business to ensure security for policyholders.
In this thesis, the regulator’s viewpoints are used.
1.3.3
Overview of literature
Dhaene et al. (2011) [19] give a very good overview of the literature. There are many different approaches to allocate the aggregate capital of a company to its different business units. Mutual dependencies that may exist between the performances of the various busi-ness units make capital allocation a non-trivial exercise. Accordingly, there is an extensive amount of literature on this subject with a wide number of proposed capital allocation algorithms. Cummins (2000) [11] provides an overview of several methods suggested for capital allocation in the insurance industry and relates capital allocation to management decision making tools such as RAROC (risk-adjusted return on capital) and EVA (eco-nomic value added). Myers and Read Jr. (2001) [44] consider capital allocation principles based on the marginal contribution of each business unit to the company’s default op-tion. The default value is the present value of the insurance company’s option to default. LeMaire (1984) [42] and Denault (2001) [13] consider that in the language of game theory, the risk capital allocation problem is modelled as a game between the constituents of the firm. The allocation of the overall capital costs to the policies has to be fair, which means that no subportfolio of policies, would be better off on their own. Tasche (2000) [54] cal-culates the risk contribution by the marginal (’Euler’) principle and argues by means of portfolio steering/performance measurement. The risk contribution should be calculated in such a way that it rewards policies with a positive contribution to the overall result, and punishes policies with a negative contribution. Further approaches to capital allo-cation include Kalkbrener (2005) [35], where an axiomatic alloallo-cation framework is used, formulating desirable properties. Further, there is an extension of this approach to spectral
measures of risk, see Overbeck (2004) [46]. A commentary on the various approaches to allocating capital has appeared in Venter (2004) [66]. Another very general approach to capital allocation using different methods is found in Denneberg and Maass (2006) [14]. A recent work by Kim and Hardy (2008) [38] proposed a method based on an insolvency exchange option (default option) and which explicitly accommodates the notion of limited liability of the shareholders and can further decompose the allocated capital.
Panjer (2001) [48] considers the particular case of multivariate normally distributed risks and provides an explicit expression of marginal cost based allocations, when the risk mea-sure used is Tail Value at Risk (TVaR). Landsman and Valdez (2003) [41] extends these explicit capital allocation formulas to the case where risks belong to the class of multi-variate elliptical distributions, for which the class of multimulti-variate normal is a special case. Dhaene et al. (2008) [16] derive the results of Landsman and Valdez (2003) [41] in a rather more straightforward manner and apply these to sums that involve normal as well as lognormal risks. In Valdez and Chernih (2003) [60], expressions for covariance-based allocations are derived for multivariate elliptical risks. Tsanakas (2004) [55] studies allo-cations where the relevant risk measure belongs to the class of distortion risk measures, while Tsanakas (2008) [57] extends these allocation principles to the more general class of convex risk measures including the exponential risk measures. Furman and Zitikis (2008) [26] introduce the class of weighted risk capital allocations ”which stems from the weighted premium calculation principle”.
The multitude of allocation methods proposed in the literature is complicated. Allocation methods are sometimes proposed in anad hocfashion usually lacking much economic jus-tification and are thereby viewed as arbitrary. This motivated some authors to doubt the legitimate purpose of the exercise itself of allocating capital e.g. Gr¨undl and Schmeiser (2007) [29]. Gr¨undl and Schmeiser (2007) [29] point out this importance because accord-ingly, certain allocation techniques can dangerously lead to wrong financial decisions. For example, they think that that capital allocation to lines of business based on the Myers and Read approach is either not necessary for insurance rate making (in the case of no frictional costs) or even leads to incorrect loadings (when frictional costs are considered). The following references are taken from the literature list in Valdez (2012) [65].
• Cummins (2000) [11]; Venter (2004) [66] Some methods based on decision making tools:
• Cummins (2000) [11] - Risk-adjusted return on capital (RAROC), economic value added (EVA)
• LeMaire (1984) [42] and Denault (2001) [13] - game theory
• Tasche (2000) [54] - marginal costs
• Kim and Hardy (2008) [38] - solvency exchange option with limited liability Some methods based on risk measures/distributions:
• Panjer (2001) [48] - TVaR, multivariate normal
• Landsman and Valdez (2003) [41] - TVaR, multivariate elliptical
• Valdez and Chernih (2003) [60] - covariance-based allocation, multivariate elliptical
• Tsanakas (2004) [55] and (2008) [57] - distortion risk measures, convex risk measures
• Furman and Zitikis (2008) [26] - weighted risk capital allocation Methods also based on an optimality principle:
• Dhaene et al. (2003) [20]; Laeven and Goovaerts (2004) [39]; Zaks, Forstig and Levikson (2006) [24]
• Biard (2010) [6] study the optimal allocation to minimize the asymptotic ruin prob-ability.
Methods special emphasis on heavy-tailed distribution
• Hult and Lindskog (2006) [32] analyze the impact of rules for transfer of capital on the ruin probability and they draw conclusions about possible benefits from diversi-fication;
• Asimit et al. (2011) [3] - TVaR, distributions from Maximum Domain of Attraction (MDA)
• Asimit et ai. (2013) [4] - the distortion and weighted risk measures and allocations, as well as their special cases such as the conditional layer expectation, tail value at risk, and the truncated tail value at risk, multivariate Pareto distribution of the second kind
Chapter 2
Basic concepts
2.1
Risk measures
Economic capital and capital allocation are calculated based on risk measures. An intro-duction to the theory of risk measures may be found in Wang (2009) [67].
According to Hardy (2006) [30], in actuarial applications we often work with loss distri-butions for insurance products. For example, in Property & Casualty insurance, we can develop a compound Poisson model for the losses under a single policy or a whole portfolio of policies. In life insurance, we can develop a loss distribution for a portfolio of policies, often by stochastic simulation.
In addition, it is usually appropriate to assume, in insurance contexts, that the lossX is non-negative. It is not essential however, and the risk measures that we describe can be applied (perhaps after some adaptation) to random variables with possible values in any part of the real line.
Following Dhaene et al. (2008) [17], we consider a set Γ of real-valued random variables defined on a given measurable space (Ω,F,P).We will assume thatX, Y ∈Γ implies that X+Y ∈Γ, and also aX∈Γ for any a >0 and X+b∈Γ for any realb. A functional
mapping every element of a loss (or profit) distribution in Γ to the real numbers, is called arisk measure(with domain Γ). The risk measure is assumed in some way to encapsulate the risk associated with a loss distribution.
In this thesis, we will interpret Ω as the set of all possible states of nature at the end of some fixed reference period, for instance one year. The set Γ will be interpreted as the extended set of financial losses under consideration at the end of the reference period, related to insurance and investment portfolios that a particular regulatory authority controls. LetX be an element of Γ. In case all claims of the corresponding insurance and investment portfolio are settled at the end of the reference period and all premiums are paid at the beginning of the reference period, the (aggregate) lossXcan be defined as claims minus the sum of premiums and investment income. In a general setting, we can defineX as the sum of the claims to be paid out over the reference period and the provisions to be set up at the end of the reference period, minus the sum of the provisions available at the beginning of the reference period, the investment income, and the premiums received over the reference period. Here, claims, premiums and provisions are understood as gross amounts, i.e., including expenses. The valuation principles, on the basis of which the value of the assets (represented by the provisions available, the premiums received and the investment income generated) and in particular the liabilities (represented by the provisions to be set up and the claims to be paid out) are determined, are left unspecified in this thesis; our set-up is compatible with any particular valuation basis.
2.1.1
Coherent risk measure
Corrigan et al. (2009) [10] agreed that a good allocation method should be coherent. In Artzner et al. (1999) [2], a risk measure ρ is called a coherent risk measure, if it satisfies the following axioms: monotonicity, positive homogeneity, translation invariance and subadditivity.
Axiom 2.1. Monotonicity: for anyX andY ∈Γ withX ≤Y, we haveρ[X]≤ρ[Y]. This rules out the risk measure,ρ[X] = E[X] +ασ[X], where α > 0 and σ denotes the standard deviation operator.
Axiom 2.2. Positive homogeneity: for anyλ >0 andX∈Γ,ρ[λX] =λρ[X].
If position size directly influences risk (for example, if positions are large enough that the time required to liquidate them depends on their sizes) then we should consider the consequences of a lack of liquidity when computing the future net worth of a position. Axiom 2.3. Translation invariance: for any X ∈ Γ and all real numbers b, we have
ρ[X+b] =ρ[X] +b.
This says that a sure loss of amountbsimply increases the risk byband it is an axiom for accounting-based risk measures. For many external risk measures, such as a margin deposit, the accounting-based risk measures seem to be reasonable. For internal risk measures, attitude-based measures may be preferred.
Axiom 2.4. Subadditivity: for allX andY ∈Γ,ρ[X+Y]≤ρ[X] +ρ[Y].
We argue that a subadditivity property, which reflects the diversification of portfolios (see
Meyers (2000) [43]), or that ‘a merger does not create extra risk,’ is a natural requirement. In the following, risk measure can also be a function of a vector. For example, if X = (X1, . . . , Xn)T,ρ[X] = (ρ[X1], . . . , ρ[Xn])T.
Note 1. Example of non-coherent risk measure, Value at Risk
It is well known that value at risk is not, in general, a coherent risk measure as it does not respect the sub-additivity property, see the example in the next section. An immediate consequence is that value at risk might discourage diversification.
Value at risk is, however, coherent, under the assumption of elliptically distributed losses (e.g. normally distributed).
2.1.2
Important risk measures
2.1.2.1 Value at Risk - the quantile risk measure
According to Hardy (2006) [30], the Value at Risk, or VaR risk measure was actually in use by actuaries long before it was reinvented for investment banking. In actuarial contexts it is known as the quantile risk measure or quantile premium principle. VaR is always specified with a given confidence levelα - typicallyα= 95% or 99%.
In broad terms, theα-VaR represents the loss that, with probabilityα, will not be exceeded. Since that may not define a unique value, for example, if there is a probability mass around the value, we define theα-VaR more specifically.
Definition 2.1.For a given probability levelα, Value at Risk (VaR) is denoted byQα[X],
or alternativelyV aRα[X], and defined as the α-quantile ofX, i.e.,
Qα[X] = inf{x∈R|Pr[X ≤x]≥α} f or α∈(0,1). (2.1)
For continuous distributions this simplifies toQα[X] such that
P r[X ≤Qα] =α. (2.2)
That is, Qα[X] = FX−1(α) if FX(α) is continuous and strictly monotone, where FX(α) is the cumulative distribution function of the loss random variableX. The reason for the ’inf’ term in the Definition 2.1 is that for loss random variables that are discrete or mixed continuous and discrete, we may not have a value that exactly matches equation (2.2). The following lemma expresses the quantiles of a function of a random variable in terms of the quantiles of the random variable.
Lemma 2.5. Quantiles of transformed random variables Let X be a real-valued random variable, andα∈(0,1). For any non-decreasing and left continuous functiong, it holds that
Qα[g(X)] =g(Qα[X]).
A proof of this result can be found in Dhaene et al. (2002) [15]. 22
Example 2.6. It is very easy to create an example of a violation of VaR subadditivity: for example, consider two different bonds A and B with nonoverlapping default probabilities (if one defaults the other will not and vice versa). A portfolio that contains both bonds may have a global VaR which is greater than the sum of the two VaRs. For instance, consider the following numerical example. Each bond has a default with a probability of 4%, and we receive recovery value at 70 if a default occurs. Otherwise they will redeem at 100. The 95% VaR of each bond is therefore 70, soV aR95%[A] =V aR95%[B] = 70,V aR95%[A]+ V aR95%[B] = 140. Defaults are independent. Elementary calculations then establish that we receive a value at 140 with a probability of 0.16%, a value at 170 with a probability of 4%×96%×2 = 7.68%, and a value at 200 with a probability of 92.16%. Hence
V aR95%[A+B] = 170. Thus, V aR95%[A] +V aR95%[B]< V aR95%[A+B], and the VaR violates subadditivity.
F inal Event A B A+B P rob 1 70 70 140 4%×4% = 0.16% 2 70 100 170 4%×96% = 3.84% 3 100 70 170 96%×4% = 3.84% 4 100 100 200 96%×96% = 92.16% V aR95% 70 70 170
According to Heyde, et al. (2006) [31], VaR has been criticized because of its lack of subadditivity. However, VaR is subadditive for elliptically distributed,En(µ,Σ, φ)random
vectors (defined in 2.3.1 below) as shown by see Embrechts (2002) [22].
Theorem 2.7. Subadditivity of VaR. SupposeXi ∼En(µ,Σ, φ) withσ2[Xi]<∞ for
alli. Let P= ( Z= n X i=1 λiXi|λi∈R )
be the set of all linear portfolios. Then for any two portfolios Z1, Z2∈Γ andα∈[0.5,1), Qα[Z1+Z2]≤Qα[Z1] +Qα[Z2].
Z2 have distributions of the same type. Let qα be the α-quantile of the standardized distribution of this type. Then
Qα[Z1] = E[Z1] +σ[Z1]qα, Qα[Z2] = E[Z2] +σ[Z2]qα,
Qα[Z1+Z2] = E[Z1+Z2] +σ[Z1+Z2]qα, Sinceσ[Z1+Z2]≤σ[Z1] +σ[Z2] andqα≥0 the result follows. Let us consider when the equality holds.
σ[Z1+Z2] =σ[Z1] +σ[Z2] if and only if
σ2[Z1] +σ2[Z2] + 2Cov[Z1, Z2] =σ2[Z1] +σ2[Z2] + 2σ[Z1]σ[Z2] if and only if Cov[Z1, Z2] =σ[Z1]σ[Z2].
That also means the correlation coefficientρ= 1.It is reasonable that ifZ1, Z2is a perfect positive linear relationship, then the VaR will satisfy additivity.
In the article I, there are some comments about VaR and additivity.
Although in the center of the distributions VaR may violate the subadditivity, Dan´ıelsson et al. (2005) [12] questioned whether the violation is merely a technical issue, at least if one focuses on the tail regions which are the most relevant regions for risk management. Indeed they showed that VaR is subadditive in the tail regions, provided that the tails in the joint distribution are not extremely fat (with tail index less than one). They also carried out simulations showing that VaR is indeed subadditive for most practical applications. Distributions with tail index less than one have very fat tails. They are difficult to find and easy to identify. Dan´ıelsson et al. (2005) [12] argued that they can be treated as special cases in financial modelling.
Uryasev (2010) [59] presents some pros and cons for VaR. VaR: Pros
1. VaR is a relatively simple risk management concept and has a clear interpretation 2. Specifying VaR for all confidence levels completely defines the distribution
3. VaR focuses on the part of the distribution specified by the confidence level 4. Estimation procedures are stable
5. VaR can be estimated with parametric models VaR: Cons
1. VaR does not account for properties of the distribution beyond the confidence level 2. Risk control using VaR may lead to undesirable results for skewed distributions 3. VaR is a non-convex and discontinuous function for discrete distributions
2.1.2.2 Tail Value at Risk
Following Dhaene et al. (2004) [18], a single quantile risk measure of a predetermined level α assesses the ‘worst case’ loss, where worst case is defined as the event with a (1−α) probability. One problem with the quantile risk measure is that it does not take into consideration what the loss will be if that (1−α) worst case event actually occurs and does not give any information about the thickness of the upper tail of the distribution function fromQα[X] on. The loss distribution above the quantile does not affect the risk measure. A regulator is not only concerned with the frequency of default, but also about the severity of default. Also shareholders and management should be concerned with the question ‘how bad is bad?’ when they want to evaluate the risks at hand in a good way. Therefore, we also use another risk measure which is called the Tail Value at Risk (TVaR) at levelα. It is denoted byT V aRα[X] and defined by
T V aRα[X] = 1 1−α Z 1 α Qq[X]dq, α∈(0,1). (2.3) It is the arithmetic average of the quantiles of X, from α on. Note that the TVaR is always larger than the corresponding quantile. From the equation (2.3) definition it follows immediately that the Tail Value at Risk is a non-decreasing function ofα.
Let X again denote the aggregate claims of an insurance and investment portfolio over a given reference period. We could define ‘bad times’ as those whereX takes a value in the interval [Qα[X], T V aRα[X]]. Hence, ‘bad times’ are those where the aggregate claims exceed the threshold Qα[X], but not using up all the available capital. The width of the interval is a ‘cushion’ that is used in case of ‘bad times’. For more details, see Overbeck (2000) [47].
TheExpected Shortfall (ESF) at levelα will be denoted byESFα[X], and is defined as ESFα[X] =E[(X−Qα[X])+], α∈(0.5,1). (2.4) This risk measure can be interpreted as the expected value of theshortfall of X and the quantileQα[X], (X−Qα[X])+:= max(X−Qα[X],0).
Figure 2.1: Graphical derivation of stop-loss E[(X−d)+] for a discrete cumulative
distribution function from Karniychuk (2006) [36].
The following relation holds between these risk measures defined above.
Theorem 2.8. Relation between Quantiles, TVaR and ESF. For α ∈ (0,1), we have that
T V aRα[X] =Qα[X] + 1
1−αESFα[X]. (2.5)
Proof. Expression (2.5) follows from ESFα[X] = Z 1 0 (Qq[X]−Qα[X])+dq= Z 1 α Qq[X]dq−(1−α)Qα[X].
Uryasev (2010) [59] presents some pros and cons for TVaR and the some observations for VaR and TVaR.
TVaR: Pros
1. TVaR has a clear engineering interpretation
2. Specifying TVaR for all confidence levels completely defines the distribution 3. TVaR is a coherent risk measure
4. TVaR is continuous. 5. TVaR is a convex function.
TVaR: Cons
1. TVaR is more sensitive than VaR to estimation errors.
2. TVaR accuracy is heavily affected by accuracy of tail modelling
Some observations for VaR and TVaR.
1. VaR does not control scenarios exceeding VaR and may lead to bearing high uncon-trollable risk
2. VaR estimates are statistically more stable than TVaR estimates 3. TVaR is more sensitive than VaR to estimation errors
4. TVaR accuracy is heavily affected by accuracy of tail modelling
2.2
Dependence
If risks are independent, the calculation of risk mesure is simple,. Mathematically it is easy to deal with independence. However in most real life situations we are not confronted with independent risks. Usually the risks from different business lines are dependent. For instance, business cycles affect different business lines in some way.
2.2.1
Correlation
2.2.1.1 Pearson’s correlation
The most familiar measure of dependence between two quantities is the Pearson product-moment correlation coefficient, or ”Pearson’s correlation.” It is obtained by dividing the covariance of the two variables by the product of their standard deviations.
The population correlation coefficient ρX,Y between two random variables X and Y with expected valuesµX andµY and standard deviationsσX andσY is defined as:
ρ[X, Y] =Cor(X, Y) =Cov(X, Y) σXσY
=E[(X−µX)(Y −µY)] σXσY
, (2.6) where E is the expected value operator, cov means covariance, and, cor a widely used alternative notation for Pearson’s correlation.
2.2.1.2 Rank correlation
Rank correlation is an alternative to the use of Pearson correlation as a measure of depen-dence. The two common types of rank correlationρrank are:
1. Spearman coefficient; and 2. Kendall Tau correlation.
Definition 2.2. The Spearman coefficient is defined as the Pearson correlation coefficient between the ranked variables.
If we are given two vectors X = (X1, . . . , Xn) andY = (Y1, . . . , Yn) that present observa-tions of the random variablesX andY, then Spearman coefficientρSbetweenX andY is a Pearson correlation between the vectors of ranks ofXiandYi.
Definition 2.3. Let (X1, Y1)and(X2, Y2) be independent and identically distributed ran-dom vectors. Then the population version of Kendall’s tau is defined as:
τ =τX,Y =P[(X1−X2)(Y1−Y2)>0]−P[(X1−X2)(Y1−Y2)<0].
The following property holds for rank correlation:
ρrank[T(X), T(Y)] =ρrank[X, Y] (2.7) for any non-linear monotonic transformationT.
2.2.2
Copula
In recent years, it is more and more popular to describe dependence by copula. Shaw et al. (2010) [49] comment that the copula approach is different from comparing with the covariance matrix. It involves a Monte Carlo simulation with the full marginal risk distribution of each risk and a copula function to produce a meaningful aggregate risk distribution. The copula is a convenient method for combining individual distributions
2.2.2.1 Introduction
Shaw et al. (2010) [49] give a very good introduction to the copula theory. Copulas are very flexible in that one can combine a varied number of marginal risk distributions together with a varying number of copula distributions.
In a simple case of two risks X1 and X2, a copula C(u, v) is part of a mathematical expression of their joint distribution functionF(x1, x2) in terms of the individual marginal risk distributionsF1(x1) andF2(x2):
F(x1, x2) =C(F1(x1), F2(x2)). (2.8) Sklar’s Theorem provides the theoretical foundation for the application of copulas. Theorem 2.9. Sklar’s theorem
IfF(x1, . . . , xn)is a joint distribution function with marginal distributionsF1(x1), . . . , Fn(xn),
then there exists a copulaC such that
F1(x1), . . . , Fn(xn) =C(F1(x1), . . . , Fn(xn)).
2.2.2.2 Tail dependence
The following approach, as provided in the monograph of Joe (1997) [33], represents one of many possible definitions of tail dependence, see Schmidt [50].
Let X = (X1, X2)T be a two-dimensional random vector. We say that X is (bivariate) upper tail-dependent if:
λU = lim
v→1−1P{X1> F
−1
1 (v)|X2> F2−1(v)}>0, (2.9) in case the limit exists. F1−1 andF2−1 denote the generalized inverse distribution functions ofX1andX2, respectively. Consequently, we sayX = (X1, X2)T is upper tail-independent ifλU equals 0. Further, we callλU the upper tail-dependence coefficient (upper TDC).
In caseX = (X1, X2)T is standard normally ort-distributed, formula (2.9) simplifies to: λU = lim
v→1−1λU(v) = limv→1−12P{X1> F
−1
1 (v)|X2=F2−1(v)}. (2.10)
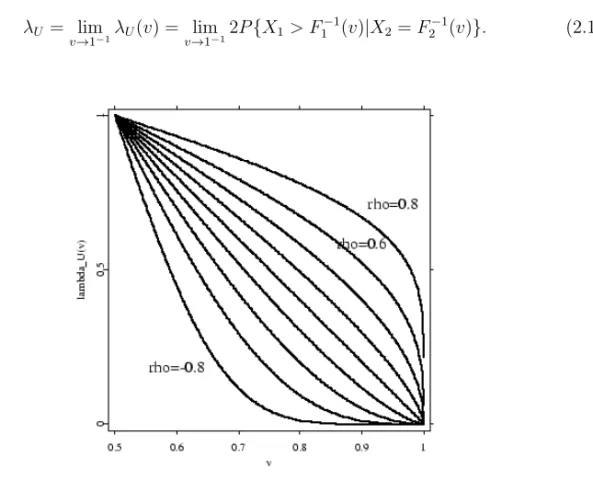
Figure 2.2: The functionλU(v) = limv→1−12P{X1 > F1−1(v)|X2=F2−1(v)}for a
bi-variate normal distribution with correlation coefficientsρ=−0.8,−0.6, ...,0.6,0.8. Note thatλU = 0 for allρ∈(−1,1). The normal distribution fails to catch the tail dependence.
The figure is from Schmidt [50].
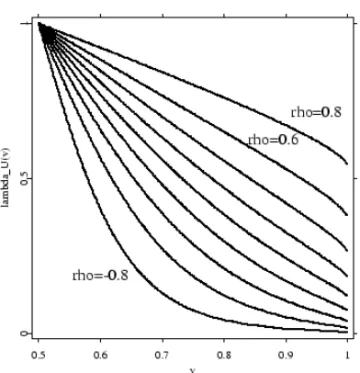
Figures 2.2 and 2.3 illustrate tail dependence for a bivariate normal and t- distribution. Irrespectively of the correlation coefficient ρ, the bivariate normal distribution is (upper) tail independent. In contrast, the bivariatet-distribution exhibits (upper) tail dependence and the degree of tail dependence is affected by the correlation coefficientρ.
Example 2.10. Normal distribution
If X and Y are jointly normal and uncorrelated, then they are independent. The require-ment that X and Y should be jointly normal is essential, without it the property does not hold. For non-normal random variables uncorrelated does not imply independence.
Figure 2.3: The function λU(v) = limv→1−12P{X1 > F1−1(v)|X2 = F2−1(v)} for a
bivariatet-distribution with correlation coefficientsρ=−0.8,−0.6, ...,0.6,0.8. The figure is from Schmidt [50].
tail covarianceT Cp[X] = 0.
The Pearson correlation is +1 in the case of a perfect positive (increasing) linear rela-tionship (correlation), -1 in the case of a perfect decreasing (negative) linear relarela-tionship (anticorrelation), and some value between -1 and 1 in all other cases, indicating the degree of linear dependence between the variables.
Assume that σ1 =σ2 = 1. If correlation is 1, we can think X2 =X1+b, the upper tail covariance
T Cp[X] =Cov[X1, X1+b|X1> FX−11(p), X2> F
−1
X2(p)] = 1, p∈(0,1). (2.11)
2.2.2.3 FGM copula
A dependence structure for (X1, X2) based on the FGM copula is introduced.
Theorem 2.11. Sklar’s theorem. For any bivariate distribution function H(x, y), let
F(x) =H(x,∞) and G(y) =H(∞, y) be the univariate marginal probability distribution
functions. Then there exists a copula C such that
H(x, y) =C(F(x), G(y)).
The copulas of the Farlie-Gumbel-Morgenstern family are defined by Cθ(u1, u2) =u1u2(1 +θ(1−u1)(1−u2))
for ui ∈ [0,1],i = 1,2, and dependence parameter θ∈ [−1,1]. We simulated 500 obser-vations from the two extreme members (θ = −1 andθ = 1) of this family using the R package copula, see Figure 2.4.
0.0 0.2 0.4 0.6 0.8 1.0 0.0 0.2 0.4 0.6 0.8 1.0 0.0 0.2 0.4 0.6 0.8 1.0 0.0 0.2 0.4 0.6 0.8 1.0
Figure 2.4: Scatter-plots for FGM copulas
Definition 2.4. Let (X1, Y1)and(X2, Y2) be independent and identically distributed ran-dom vectors. Then the population version of Kendall’s tau is defined as:
For FGM copulas,τθ = 2θ/9∈[−2/9,2/9]. The details can be found in Nelsen (2006) [45], p. 162.
Definition 2.5. Let (X1, Y1), (X2, Y2) and (X3, Y3) be three independent and identically distributed random vectors. Then the population version of Spearman’s rho is defined as:
ρX,Y = 3(P[(X1−X2)(Y1−Y3)>0]−P[(X1−X2)(Y1−Y3)<0]).
For FGM copulas,ρθ=θ/3∈[−1/3,1/3]. The details can be found in Nelsen (2006) [45], p. 168.
Proposition 2.12.LetX1 andX2 be two exponentially distributed withλ1andλ2, respec-tively. Suppose that the dependence is defined by the FGM copula with parameterθ. Then the correlation betweenX1 andX2 isρX1,X2=θ/4∈[−1/4,1/4].
Proof. Pearson’s correlation is ρX1,X2= Cov[X1, X2] p V ar[X1]V ar[X2] = E[X1X2]−E[X1]E[X2] p V ar[X1]V ar[X2] . (2.12) To calculateE[X1X2], we need know that the joint cdf of (X1, X2) is
FX1,X2(x1, x2) =H(x1, x2) =FX1(x1)FX2(x2)(1 +θ(1−FX1(x1))(1−FX2(x2)))
and the joint pdf fX1,X2(x1, x2) = ∂2F X1,X2(x1, x2) ∂x∂y = ∂2C θ(u1, u2) ∂u1∂u2 ∂u1∂u2 ∂x∂y = ∂ 2C θ(u1, u2) ∂u1∂u2 fX1(x1)fX2(x2) = (1 +θ(1−2u1)(1−2u2))fX1(x1)fX2(x2) = (1 +θ(1−2FX1(x1))(1−2FX2(x2)))fX1(x1)fX2(x2) = (1 +θ(1−2(1−e−λ1x1))(1−2(1−e−λ2x2)))λ1e−λ1x1λ2e−λ2x2
= (1 +θ)λ1e−λ1x1λ2e−λ2x2+θ2λ1e−2λ1x12λ2e−2λ2x2
−θ(2λ1e−2λ1x1λ2e−λ2x2+λ1e−λ1x12λ2e−2λ2x2)
Thus, the expectation of X1X2 is E[X1X2] = Z +∞ 0 Z +∞ 0 x1x2fX1,X2(x1, x2)dx1dx2 = Z +∞ 0 Z +∞ 0
x1x2((1 +θ)λ1e−λ1x1λ2e−λ2x2+θ2λ1e−2λ1x12λ2e−2λ2x2
−θ(2λ1e−2λ1x1λ2e−λ2x2+λ1e−λ1x12λ2e−2λ2x2))dx1dx2.
Since Z +∞ 0 Z +∞ 0 x1x2λ1e−λ1x1λ2e−λ2x2dx1dx2= Z +∞ 0 x1λ1e−λ1x1dx1 Z +∞ 0 x2λ2e−λ2x2dx2 (2.13) and we know Z +∞ 0 xλe−λxdx=1 λ, then Z +∞ 0 Z +∞ 0 x1x2λ1e−λ1x1λ2e−λ2x2dx1dx2= 1 λ1λ2. So E[X1X2] = 1 +θ λ1λ2 + θ 2λ12λ2 −θ 1 2λ1λ2 + 1 λ12λ2 = 1 +θ λ1λ2 + θ 4λ1λ2 − θ λ1λ2 = 4 +θ 4λ1λ2. From equation (2.12), the correlation
ρX1,X2= E[X1X2]−E[X1]E[X2] p V ar[X1]V ar[X2] = 4+θ 4λ1λ2− 1 λ1λ2 1 λ1λ2 =θ 4. ThusρX1,X2 ∈[−1/4,1/4].
Even if the FGM copula introduces only weak dependence, it can include positive as well as negative dependence and independence by choosing different θ. It is also known that the FGM copula is a Taylor approximation of order one of the Frank copula (see Nelsen (2006) [45], page 133), Ali-Mikhail-Haq copula and Plackett copula (see Nelsen (2006) [45], page 100).
2.2.3
Right Joint Excess Probability
In modelling a loss, there is usually considerable concern about the chance and sizes of large claims - in particular, the study of the (right) tail, see Boland (2007) [8]. In Shaw et al. (2010) [49], there is a description of the Right Joint Excess Probability (RJEP). Definition 2.6. For a pair of risks, the Right Joint Excess Probability is the joint proba-bility that two risks are greater than some deemed threshold.
RJEP(p) =P[FX(x)> p, FY(y)> p] =P[x > FX−1(p), y > F− 1
Y (p)]. (2.14)
For independent random variables, the value ofRJEP(p) is (1−p)2.
2.3
Distributions
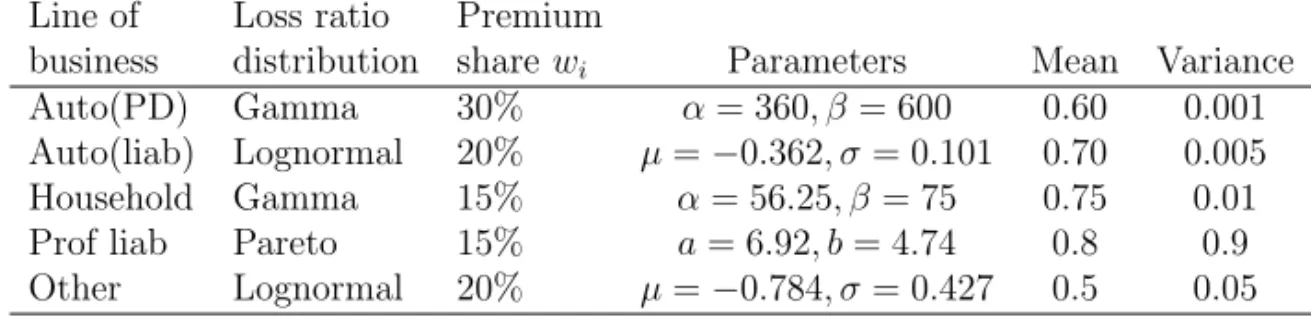
In this section, we present some of the classic distributions used to model losses in insurance and finance. Some of these distributions such as the exponential and gamma are frequently used in survival analysis and engineering application, see Boland (2007) [8]. We will also consider distributions such as Pareto and lognormal which are particularly appropriate for studying losses.
Here we are interested in heavy-tailed distributions from theoretical point of view. The empirical point of view was studied by Kaasik (2009) [34]. When dealing with some empirical data, which seem to be heavy-tailed, Kaasik (2009) [34] investigated how to find the right distribution with suitable parameters.
2.3.1
Elliptical and Log-Elliptical distributions
According to Valdez (2005) [64], the class of elliptical loss distribution models provides a generalization of the class of normal loss models. The class of elliptical distributions has been introduced in the statistical literature by Kelker (1970) [37] and widely discussed in
Fang et al. (1990) [23], see also Landsman and Valdez (2003) [41], Valdez and Dhaene (2003) [62], and Valdez and Chernih (2003) [61] for applications in insurance and actuarial science. Embrechts et al. (2002) [22] also provides a fair amount of discussion of this important class as a tool for modelling risk dependencies.
Definition 2.7. The random vector Y = (Y1, Y2, . . . , Yn)T is said to have an elliptical
distribution, written asY∼En(µ,Σ, ψ), if its characteristic function can be expressed as
ϕY(t) =E[exp(itTY)] = exp(itTµ)ψ 12tTΣt
, tT = (t1, t2, . . . , tn), (2.15)
for some n-dimensional column-vectorµ, somen×n semi positive-definite matrixΣand scalar functionψ(t), which is called the characteristic generator.
An elliptical distributed random vectorY∼En(µ,Σ, ψ) does not necessarily have a prob-ability density. A necessary condition for Yto possess a density is that rank(Σ) =n. If Yhas a density fY(y), then it has the following form:
fY(y) = cn p |Σ|gn h 1 2(y−µ) T Σ−1(y−µ)i, (2.16) for some non-negative functiongn(·), which is called thedensity generator. The condition
Z ∞
0
yn/2−1gn(y)dy <∞ (2.17) guarantees thatgn(·) is a density generator, see Fang et al. (1990) [23].
The normalizing constantcnin (2.16) is given by cn= Γ (n/2) (2π)n/2 Z ∞ 0 yn/2−1gn(y)dy −1 , (2.18)
which is assumed to be finite. More details on the elliptical family of distributions can be found in [23], [41], amongst others.
Example 2.13. The n-dimensional random vectorYhas themultivariate normal dis-tribution with parametersµ andΣ, notation Y∼Nn(µ,Σ), if its characteristic function
is given by
E[exp(itTY)] = exp(itTµ) exp −1 2t
TΣt. (2.19)
From (2.15) we see thatNn(µ,Σ)has an elliptical distribution with characteristic generator ψgiven by
ψ(t) = exp(−t). (2.20)
Since ψ0(0) = −1 the matrix Σ in (2.19) is the covariance matrix of Y. In case Σ is
positive definite, the random vectorY∼Nn(µ,Σ)has a density which is given by fY(y) = 1 (2π)n/2p|Σ|exp h −1 2(y−µ) T Σ−1(y−µ)i. (2.21)
Comparing with (2.16), we find that the density generatorgnand the normalising constant cn ofNn(µ,Σ)are given by
gn(y) = exp(−y) and cn=(2π1)n/2 (2.22) respectively.
Definition 2.8.The random vectorX= (X1, X2, . . . , Xn)T is said to have alog-elliptical
distribution, written as X ∼ LEn(µ,Σ, ψ), if Y = lnX = (lnX1,lnX2, . . . ,lnXn)T ∼ En(µ,Σ, ψ) with expectations µ, generalized covariance matrixΣ and characteristic gen-eratorψ.
If the density ofY= lnX∼En(µ,Σ, ψ) exists, then the density ofX∼LEn(µ,Σ, ψ) also exists. From (2.16), it follows that the density ofXis equal to
fX(x) = cn p |Σ| n Y k=1 x−k1 ! gn 1 2(lnx−µ) TΣ−1(lnx −µ), (2.23) see Fang et al. (1990).
2.3.2
Exponential distribution
In Boland (2007) [8], the exponential distribution is one of the simplest and most basic distributions used in modelling. The random variable X is exponential distributed with parameterλ. Its density function is
fX(x) =λe−λx (2.24)
and the survival function is
¯
FX(x) =e−λx (2.25)
forx >0.
An exponential random variableX has the memoryless property in that for anyM, x >0, P(X > M+x|X > M) =P(X > x). (2.26) For an exponential distributionX, the tail probability ¯FX(x) =P(X > x) =e−λxconverge to 0 exponentially fast. In many situations, it may be appropriate to try and model a slower vanishing tail distribution. For example, ifP(X > x) is of the formaα/(bx+c)αfor certain positive constanta, b, candα, then the tail probability of X goes to 0 at a slower polynomial rate. For a function of the form aα/(bx+c)α to be the survival function of a positive random variable, one must have thatp(X >0) = (a/c)α = 1. This gives rise to the Pareto family of distributions.
2.3.3
Pareto distribution
We use the introduction of Pareto distribution from in Boland (2007) [8].
The random variableXis Pareto with positive parametersaandbif it has density function f(x) = ab
a
or equivalently, survival function ¯ FX(x) = b x+b a (2.28) forx >0. The Pareto distribution is names after Vilfredo Pareto (1848-1923) who used it in modelling welfare economics. Today it is commonly used to model income distribution in economics or claim-size distribution in insurance.
Like the exponential family of random variables, the Pareto distributions have density and survival function which are very tractable. Pareto random variables have some nice preser-vation properties. For example, ifX ∼P areto(a, b) andk >0, thenkX ∼P areto(a, kb) since P(kX > x) =P(X > x/k) = b x/k+b a = kb x+kb a . (2.29) This property is useful in dealing with inflation in claims. Moreover, ifM >0, then
P(X > M+x|X > M) = b x+M +b a / b M +b a = M+b x+M +b a , (2.30) which implies that ifX > M, thenX−M (or the excess ofX overM) isP areto(a, M+ b). The property is useful in evaluating the effect of deductibles and/or excess levels for insurance in handling losses.
2.3.4
Gamma distribution
The gamma family of probability distribution is both versatile and useful, in Boland (2007) [8]. The gamma function is defined for anyα >0 by
Γ(α) =
Z +∞
0
yα−1e−ydy, (2.31) and has the properties that
Γ(n) = (n−1)Γ(n−1) (2.32)
and Γ(1/2) =√pi.
The gamma distributionX can be parametrized in terms of a shape parameter αand an inverse scale parameterβ, called a rate parameter:
f(x;α, β) = β α Γ(α)x
α−1e−βx (2.33) forx≥0 andα, β >0.
IfX ∼Γ(α, λ), then Moment-generating function (mgf)MX(t) = [β/(β−t)]α fort < β, E[X] =α/β andV ar[X] =α/β2. In a Poisson process where events are occurring at the rate of β per unit time, the waiting timeTα until the α-th event ”arrives” has a gamma distribution with parametersαandβ,Tα∼Γ(α, β).
when the shape parameter α = 1, we obtain the exponential distributions. Moreover, the Γ(v/2,1/2) distributions is theχ2 distribution withv degrees of freedom. Hence the gamma family includes both the exponential andχ2 distributions.
Chapter 3
Capital allocation
3.1
How to allocate?
Consider a portfolio ofnindividual losses asX= (X1, X2, . . . , Xn)T at a fixed date. Denote each economic capital for lossXibyρ[Xi].
The aggregate loss is defined by the sum S=
n
X
i=1
Xi, (3.1)
and the total economic capitalK=ρ[S].
The allocation problem is to determine a capitalKifor each loss Xiand n
X
i=1
Ki=K, Ki≥0. (3.2)
Usually, the total economic capital is smaller than the sum of the economic capital for each risk, K <Pni=1ρ[Xi] because there is diversification benefit. Allocating the total capital back to the lower levels also means allocating the diversification benefit to individual risks.
3.2
Different principles
The section will present different principles of capital allocation and illustrates with the example from Corrigan et al. (2009) [10].
There are three portfolios of company X = (X1, X2, X3)T. Losses from portfolios are assumed to be normally distributed, with meanµ= (50,40,70)T and standard deviation
σ= (10,7,12)T.
The following correlation are specified between the 3 portfolios:
Corr= 1 0.8 0.3 0.8 1 0.2 0.3 0.2 1 (3.3)
V aR0.995 is used as a risk measure to determine the capital requirement for each ofX1, X2 andX3 in this example; in practice, any risk measure can be used. The risk measures are : ρ[X] =V aR0.995[X] = (75.9,58.8,102.7)T. (3.4) We sum up the risk S =X1+X2+X3 and the total risk is a normal distribution with meanµS= 50 + 40 + 70 = 160 and stand deviation
σS= p σ[X]TCorr σ[X] = v u u u u t(10,7,12) 1 0.8 0.3 0.8 1 0.2 0.3 0.2 1 10 7 12 = 22.6. (3.5)
The total economic capital isK=ρ[S] =V aR0.995[S] = 227.0. The results presented in the table.
Note, the sum of partsPρ[Xi] = 237.4 is greater than the total portfolio capital require-mentK = 227.0 . The aim of this example is to allocate theK= 227.0 back to portfolio X1, X2 andX3.
Table 3.1: Capital allocation Portfolio µ σ V aR0.995 X1 50 10 75.9 X2 40 7 58.8 X3 70 12 102.7 Sum S 160 22.6 227.0
3.2.1
Proportional capital contribution
The total capital requirement is allocated linearly to each loss Xi. The capital for each loss can be calculated by:
Ki= K
Pn i=1ρ[Xi]
ρ[Xi], i= 1, . . . , n. (3.6) In this example, each receive the allocations of 28.2/44.7(15.8,8.0,20.9)T = (9.9,5.1,13.2)T, see the following table.
Table 3.2: Proportional capital allocation
Portfolio Capital requiredρ[Xi] Proportional allocation
X1 75.9 72.5
X2 58.8 56.2
X3 102.7 98.2
Sum 237.4 227.0
Capital requirementK forS 227.0
The advantage is very simple. The disadvantage is that diversification benefit allocated is in proportion to capital requirement but not correlation. Hence, the portfolio with higher mean obtains greater diversification benefit. However, the portfolio with lower correlation with the total portfolios should gain greater diversification benefit.
To improve the principle, we extend the risk measureρ[Xi] toρ[Xi, S], including the sum S=Pni=1Xi.
3.2.2
Covariance allocation principle
Covariance allocation principle is a special case of proportional capital allocation when ρ[Xi, S] =Cov[Xi, S].
According to Dhaene et al. (2011) [19], the covariance allocation principle proposed by e.g. Overbeck (2000) [47] is given by
Ki=
Cov[Xi, S]
V ar[S] K, i= 1, . . . , n, (3.7) whereCov[Xi;S] is the covariance between the individual loss Xiand the aggregate loss SandV ar[S] is the variance ofS. Because clearly the sum of these individual covariances is equal to the variance of the aggregate loss,PCov[Xi, S] =V ar[S], the full allocation requirement is automatically satisfied in this case,PKi=K.
The covariance allocation rule explicitly takes into account the dependence structure of the random losses (X1, . . . , Xn). Business lines with a loss that is more correlated with the aggregate lossS are penalised by requiring them to hold a larger amount of capital than those which are less correlated.
The advantage of this principle is that it is easy to calculate and only need know the covari-ances Cov[Xi, Xj] between different risks. The allocation percentage Cov[Xi, S]/V ar[S] to a line of business is the sum of the appropriate row of the covariance matrixCov[X] divided by the sum of all elements, see the Covariance method from the website, Pricing Wiki.
In this example, the covariance matrix
Cov[X] =σ[X]Corr σ[X]T = 10 7 12 1 0.8 0.3 0.8 1 0.2 0.3 0.2 1 (10,7,12) = 10 56 36 56 49 16.8 36 16.8 144 .
The allocation percentageki=CovV ar[Xi,S[S]] and allocation can be found in following Table. Other allocation principles require more information, such as the joint distribution of the X’s. Even knowing the distribution, it is usually difficult to find an explicit formula and so we often need to calculate them from simulation data. The covariance allocation principle
Table 3.3: Covariance capital allocation
Portfolio allocation percentage % Covariance allocation
X1 37.6 85.4
X2 23.9 54.1
X3 38.5 87.5
Sum 227.0
models dependence explicitly, which is an advantage.
The covariance allocation principle is, however, not a good way to allocate capital if the role of our risk capital is to cover claims from all lines of business.
Let us assume that there are two losses, constantC and random variableX. The sum of the two losses is S=C+X.
If the economic capital isK=V aRq[S] andq∈(0,1), then the capital for this case is K=V aRq[S] =V aRq[C+X] =C+V aRq[X]. (3.8) According the covariance allocation principle, the allocation to the constant loss is
K1=Cov[C, S]
V ar[S] K= 0 (3.9)
and for the other loss, allocation is all the capitalK.
Non-risky loss still needs some share of the capital. Economic capitalKshould be sufficient to pay the liabilities of the company, both risky ones and non-risky ones.
It can be noted that the allocation percentages Cov[Xi, S]/V ar[S] are not dependent on the levelq. The allocationKican be a function of the levelqif the total allocated capital K is the function ofq, for instance,K=V aRq[S].
3.2.3
Discrete marginal contributions
Discrete marginal contribution of Xi = the capital requirement of the total portfolioK -the capital requirement of -the total portfolio excluding -the portfolioXi, denoted byK¯i.
For example, when consideringX1, check the capital of portfolioK¯1=S¯1=X2+X3. S¯1 is a normal distribution with meanµS¯1 = 40 + 70 = 110 and stand deviation
σS¯1 = p σ[X23]TCorrσ[X23] = v u u t(7,12) 1 0.2 0.2 1 ! 7 12 ! = 15.1. (3.10)
Aggregate the capital requirements ofX2 andX3:
K¯1=V aR0.995[S¯1] = 148.8. (3.11) The required capital ofX1X3 andX1X2 are 165.8 and 124.3 separately.
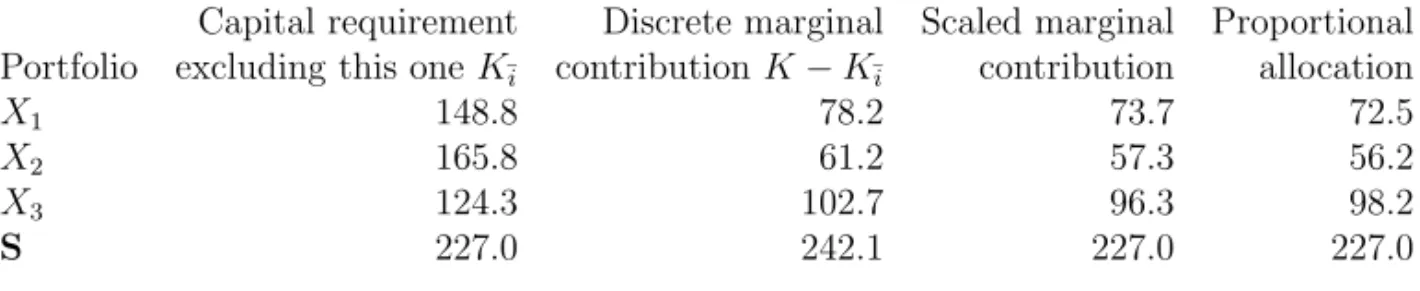
In next table, the discrete marginal contributions of portfolioX1, X2 and X3 are 227.0− 148.8 = 78.2, 227.0−165.8 = 61.2 and 227.0−124.3 = 102.7 separately. Then scale them with the sum as the capital requirement of total portfolio 227.0. For example, the scaled marginal contribution ofX1 is 78.2*227.0/242.1=73.3.
Table 3.4: Discrete marginal capital allocation
Capital requirement Discrete marginal Scaled marginal Proportional Portfolio excluding this one K¯i contributionK−K¯i contribution allocation
X1 148.8 78.2 73.7 72.5
X2 165.8 61.2 57.3 56.2
X3 124.3 102.7 96.3 98.2
S 227.0 242.1 227.0 227.0
Compared with proportional allocation, the capital requirement of portfolioX1 andX3 is more in scaled marginal contribution andX2 less. Comparably great positive correlation betweenX1 andX2 makesX1 more allocation in marginal principles.
Note 2. If all the correlations between portfolios are equal to 1, discrete marginal contri-bution, scaled marginal contribution and proportional allocation will be the same.
The advantage is that this is a more sophisticated approach. The disadvantage is that the calculation may generate negative values for capital requirements, for example, if there is one or more negative correlations between the portfolios.
3.3
Optimal capital allocations
According to Dhaene et al. (2011) [19], consider a portfolio ofnindividual lossesX1, X2, . . . , Xn at a fixed future dateT. Assume thatX= (X1, X2, . . . , Xn)T is a random vector on the probability space (Ω,F,P). We will always assume that any loss Xi has a finite mean. The distribution function P[Xi≤x] ofXiwill be denoted by FXi(x). We can look for a method of allocation from the optimal capital allocation problem.
Give the aggregate capitalK >0, allocate the capitalKi to business lineiby solving min K1,...,Kn n X j=1 1 vj E(Xj−Kj)2g(X) , such that n X j=1 Kj =K, (3.12)
where the vj are non-negative real numbers such that Pnj=1vj = 1, the g(X) are non-negative random variables such thatE[g(X)] = 1.
Dhaene et al. (2011) [19] explain vj as a measure of exposure or business volume of the j-th unit, such as revenue, insurance premium, etc. These scalar quantities are chosen such that they sum to 1. These vj are used as weights attached to the different values ofE[(Xj−Kj)2g(X)] in the minimization problem (3.12), in order to reflect the relative importance of the different business units. The non-negative function g(X) are used as the portfolio performance weight factor to the outcomes of the deviations (Xj−Kj)2. The allocations based ong(X) will be called portfolio driven allocations.
Theorem 3.1. The optimal allocation problem (3.12) has the following unique solution:
Ki=E[Xig(X)] +vi(K− n
X
j=1
E[Xjg(X)]), i= 1, . . . , n, (3.13)
where the vj are non-negative real numbers such that Pnj=1vj = 1, the g(X) are
non-negative random variables such thatE[g(X)] = 1.
We define the volumesviby vi=
E[Xig(X)]
Pn
we find that the capital allocation principle (3.13) reduces to the proportional allocation rule Ki= E[Xig(X)] Pn j=1E[Xjg(X)] K, i= 1, . . . , n. (3.14) In Dhaene et al. (2011) [19], there are tables showing different E[Xjg(X)] by choosing differentg(X).
Table 3.5: Business lines driven risk measures
Risk measure g(Xi) E[Xig(Xi)]
Standard deviation principle
1 +aXi−E[Xi] σXi , a≥0 E[Xi] +aσXi B¨uhlmann (1970) [9] Tail VaR 1 1−q1(Xi> F− 1 Xi(q)), q∈(0,1) T V aR[Xi] Overbeck (2000) [47]
Distortion risk measure h0( ¯F
Xi(Xi)), h: [0,1]→[0,1], E[X ih0( ¯FXi(Xi))] Wang (1996) [71], Acerbi (2002) [1] h0>0, h00<0 Exponential principle R1 0 eγaXi E[eγaXi]dγ, a >0 1 alnE[e aXi] Gerber (1974) [27]
Esscher principle eaXi
E[eaXi], a >0
E[XieaXi] E[eaXi] Gerber (1981) [28]
In this thesis, we will use the proportional allocation Ki=
K
Pn
i=1ρ[Xi, S]
ρ[Xi, S], i= 1, . . . , n. (3.15) By choosing different risk measuresρ[Xi, S], we can otain different capital allocations.
Table 3.6: Aggregate portfolio driven allocations Reference g(S) E[Xig(S)] Overbeck (2000) [47] 1 +aS−σE[S] Xi , a≥0 E[Xi] +a Cov[Xi,S] σS Overbeck (2000) [47] 1−1q1(S > FS−1(q)), q∈(0,1) E[Xi|S > FS−1(q)] Tsanakas (2004) [56] h0( ¯FS(S)), hh0>0, h: [0,001]<→0 [0,1], E[Xih0( ¯FS(S))] Tsanakas (2009) [58] R01Ee[γaSeγaS]dγ, a >0 E[XiR01 e
γaS E[eγaS]dγ] Wang (2007) [72] Ee[eaSaS], a >0
E[XieaS] E[eaS]
![Figure 2.1: Graphical derivation of stop-loss E[(X − d) + ] for a discrete cumulative distribution function from Karniychuk (2006) [36].](https://thumb-us.123doks.com/thumbv2/123dok_us/10025738.2494922/31.918.102.742.567.937/figure-graphical-derivation-discrete-cumulative-distribution-function-karniychuk.webp)


![Table 3.6: Aggregate portfolio driven allocations Reference g(S) E[X i g(S)] Overbeck (2000) [47] 1 + a S −E[S] σ Xi , a ≥ 0 E[X i ] + a Cov[Xσ i ,S]S Overbeck (2000) [47] 1 −q1 1(S > F S −1 (q)), q ∈ (0, 1) E[X i |S > F S −1 (q)] Tsanakas (2004) [56](https://thumb-us.123doks.com/thumbv2/123dok_us/10025738.2494922/56.918.181.778.544.813/table-aggregate-portfolio-allocations-reference-overbeck-overbeck-tsanakas.webp)