QUT Digital Repository:
http://eprints.qut.edu.au/
Chikolwa, Bwembya (2007)
The development of commercial mortgage-backed
securities in Australia.
Pacific Rim Property Research Journal, 13(4). pp. 397-422
Pacific Rim Property Research Journal, Vol 13, No 4 397
THE DEVELOPMENT OF COMMERCIAL
MORTGAGE-BACKED SECURITIES IN AUSTRALIA
BWEMBYA CHIKOLWA
Queensland University of Technology
ABSTRACT
The paper explores the development of the Australian Commercial Mortgage-Backed Securities (CMBS) market from 1999 to 2006 and outlines similarities and dissimilarities with the United States (US) and European (EU) CMBS markets. Whilst the US has been the market leader in terms of issuance volumes and diversity of asset classes backing the issues, the other two regions have not lagged far behind and have replicated the US CMBS model to suit their local needs. In comparison to the much bigger US and EU CMBS markets, the Australian CMBS market is well matured as seen by the diversity of asset classes backing the issues and transaction types, tightening spreads and record issuance volumes. The strong commercial real estate market outlook supports further CMBS issuance, with Listed Property Trusts (LPTs) continuing their dominance as issuers.
Keywords:
Commercial Mortgage-Backed Securities, underlying collateral, credit rating, transaction type, spreads, performanceINTRODUCTION
In Australia, the description of Commercial Mortgage-Backed Securities (CMBS) has been expanded and accepted in the market to include a form of securitisation of direct property assets (Jones Lang LaSalle 2001), in addition to the traditional definition of the securitisation of commercial mortgages (Jacob and Fabozzi 2003). The Australian Commercial Mortgage-Backed Securities (CMBS) market has been one of the most dynamic and fastest-growing capital market sectors in the last few years (Richardson 2003). The market has undergone significant development since the first transactions came to the market in 1999, with a range of transaction types and issuers now accessing the market. The first CMBSs in Australia were done by Leda Holdings in 1999, the Longreach/Qantas head office securitisation and the David Jones flagship stores deals in 2000. To date, a total of over 60 CMBSs with nearly 180 tranches totalling over AU$17.4 billion have been issued.
The growth of the CMBS market as a funding source and as an investment option is attributable to its advantages of lower pricing, improved liquidities, diversification on lenders, non-recourse to the parent company, release of value while retaining future
growth potential, and off-balance sheet financing in comparison to bank financing. Jones Lang LaSalle (2001) illustrated the potential of CMBSs being a cheaper and alternative debt financing option for companies with property exposure. They further added that CMBSs offered investor advantages of insolvency remoteness, greater diversification and greater transparency. Roche (2000), Blundell (2001) and Morrison (2001) also stated the advantages of CMBS over traditional bank financing as including cost effectiveness, flexible arrangement and longer repayment timeframes that closely match the long-term nature of property investment. The Reserve Bank of Australia (RBA) (2006) also noted that increased supply of CMBS, with a range of subordination, has broadened the investor base in real estate debt markets and reduced the commercial property sector’s dependence on bank financing.
In Australia, the growth of the CMBS market is linked to that of Listed Property Trusts (LPTs). The single-purpose-vehicle-like characteristics of LPTs have helped in their establishment as major players in the CMBS market. LPTs continue to be the mainstay of the Australian CMBS market, with 65% of issuance market share. If wholesale funds are included, this figure increases to 75% (Standard & Poors 2005b). Draffin (2002) attributed the strong interest in CMBS issuance from LPTs to the ability to achieve AAA rating matched by strong investor demand; the cost effectiveness of CMBS debt relative to traditional forms of property finance; and the potential flexibility afforded by structured CMBS debt. Many LPTs used equity capital to fuel growth and expansion during the mid-1990’s, but later switched to debt financing in 1997 when the RBA cut interest rates in the second half of 1996, which made debt financing a cheaper option to equity capital (Kavanagh 1997). Jones Jang LaSalle (2001) predicted the rise of LPT CMBSs on the premise that they had AU$16 billion debt, of which 50% was bank debt. Between 2001 and 2004, LPTs issued CMBSs worth over AU$3.7 billion via 27 issues (eg: Mirvac, Macquarie Goodman Industrial, ING Office, ING Industrial, Investa, Macquarie Office) and LPT bonds worth over $AU4.8 billion via 40 issues (eg: Gandel, Commonwealth Property, GPT, Stockland, Westfield) (Newell and Tan 2005). This increased participation in CMBS issuance can also be partly attributed to the high demand by institutional investors, mainly superannuation funds, for shares and bonds issued by LPTs in comparison to investing in direct property.
The total contribution of asset allocation by Australian superannuation funds to property (both direct and indirect) declined from 17% in 1988 to 9% in 2000-2002, though the contribution of indirect property increased from 3% to 7% over the same period (InTech 2003). In 2005, 95% of superannuation funds had a specific allocation to property (either direct or indirect), averaging 10% (Newell 2006). The introduction of compulsory superannuation in 1992 saw superannuation funds increase their total assets from only AU$36 billion in June 1984 and AU$238 billion in June 2005 to AU$946 billion in September 2006 (Australian Prudential Regulatory Authority 2006b). Their growth has been underpinned by strong investment returns and new contributions. With the drop in public bond issuance, bonds and CMBSs issued by LPTs have been an attractive investment option for superannuation funds. Outstanding government securities fell from
Pacific Rim Property Research Journal, Vol 13, No 4 399
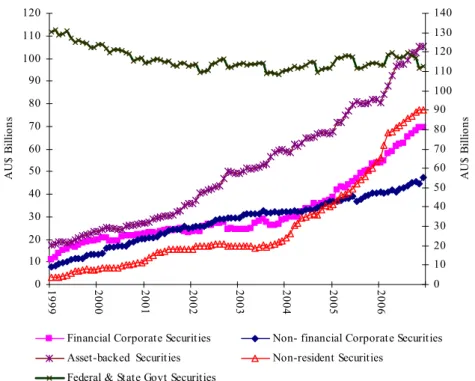
AU$130 billion in 1999 to AU$112 billion at the end of 2006. On the contrary, outstanding amounts for other debt securities; in particular asset backed securities1 increased from AU$17.5 billion to AU$104 billion over the same period. Figure 1 shows outstanding debt securities from 1999 to 2006.
Figure 1: Outstanding debt securities (1999-2006)
0 10 20 30 40 50 60 70 80 90 100 110 120 19 99 2000 2001 2002 2003 2004 2005 2006 A U $ B illi on s 0 10 20 30 40 50 60 70 80 90 100 110 120 130 140 A U $ B illi on s
Financial Corporate Securities Non- financial Corporate Securities Asset-backed Securities Non-resident Securities
Federal & State Govt Securities Source: Reserve Bank of Australia (2007)
On a global level, the CMBS market increase is linked to the United States (US) market. For the 1999 to 2006 period, CMBSs totalling over AU $977 billion (US$770 billion)2 had been issued in the US compared to AU$367 billion (US$289 billion) for the rest of the world; see Figure 2. Industry data shows that in 2006, issuance of commercial CMBS in the US was around AU$261 billion (US$206 billion), a 22% increase over the previous year, and non-US issues were AU$118 billion (US$93 billion), representing an increase of
1These include commercial mortgage-backed securities
2 For ease of comparison, the interbank exchange rates of US$1=AU$1.27 and EUR€1=AU$1.67 as at
34% over the 2005 period (Commercial Mortgage Alert 2007). There was strong activity in Europe (EU) in 2006, where around AU$108 billion (€64.75 billion) of CMBS were issued in 2005, with around three quarters of this amount issued in the United Kingdom (UK). In 2006, AU$4.9 billion of newly rated notes were issued in Australia, an increase of 38% on the previous year (Standard & Poors 2007b).
Figure 2: CMBS global issuance (1999-2006)
$49 $49 $74 $52 $78 $93 $169 $206 $8 $12 $23 $29 $21 $34 $70 $93 0 50 100 150 200 250 300 350 1999 2000 2001 2002 2003 2004 2005 2006 U S $ B illio n s
US CMBS Issuance (US$Bil.) Non-US Issuance (US$Bil.)
Source: Commercial Mortgage Alert (2007)
The 2006 CMBS issuance of AU$261 billion (US$206 billion) in the US, AU$108 billion (€64.75 billion) in the EU and AU$4.9 billion in Australia, represents 40%, 12% and 7% respectively of the overall securitisation markets in these regions (Standard & Poor's 2007a; 2007b). Although these percentages appear to be low except for the US, CMBSs are seen as a good source of funding by issuers and as a good investment option by investors.
As such, given the rapid growth of the Australian CMBS market, the purpose of this paper is to retrace this growth and compare it with that of US and the EU; particularly focussing on market structure and issues details. Furthermore, the paper presents a future outlook of the Australian CMBS market.
Pacific Rim Property Research Journal, Vol 13, No 4 401
SIGNIFICANCE OF COMMERCIAL MORTGAGE BACKED
SECURITIES
The significance of the CMBS market is best illustrated by looking at developments in the bigger US and EU markets. Comparing with developments in the US and EU markets aids the analysis of how the Australian CMBS market has evolved.
US CMBS market
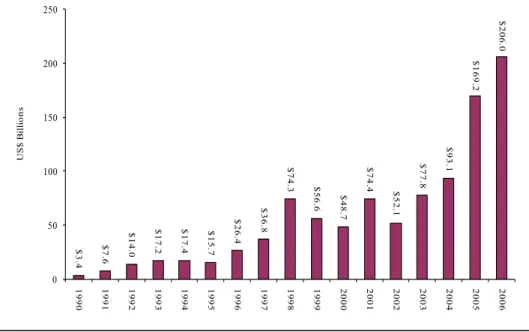
The US has been leading the way in global issuance of CMBSs. For the period 1990 to 2006, CMBSs totalling over AU$1257 billion (US$990.7 billion) had been issued in the US. Figure 3 shows the total amount of CMBS issuance per year since 1990.
Figure 3: US CMBS issuance (1990-2006) $3. 4 $7. 6 $1 4. 0 $17 .2 $ 17. 4 $15 .7 $ 26. 4 $36 .8 $74 .3 $56 .6 $48. 7 $ 74. 4 $52. 1 $77 .8 $ 93. 1 $ 169. 2 $ 206 .0 0 50 100 150 200 250 1990 1991 1992 1993 1994 1995 1996 1997 1998 1999 2000 2001 2002 2003 2004 2005 2006 U S $ B illio n s
Source: Commercial Mortgage Alert
US CMBS issuance rose from AU$4.3 billion (US$3.4 billion) in 1990 to AU$261 billion ($US$206 billion) in 2006. As of the second quarter of 2005, there was AU$596 billion ($470 billion) worth of CMBS outstanding in the US market, representing around 40% of the overall asset-backed securities market and around 20% of the overall commercial loan market.
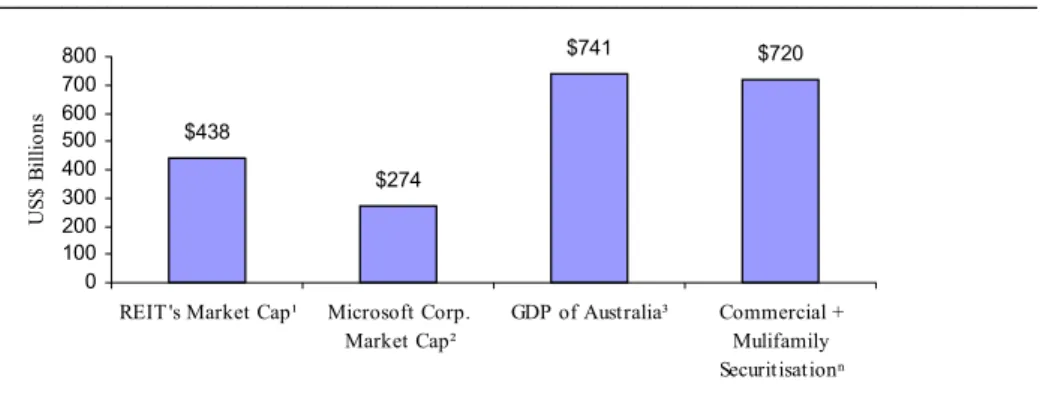
Figure 4 shows market size of commercial and multifamily securitisations ($720 billion) with that of REITs ($438 billion market cap), Microsoft ($274 billion market cap on the New York Stock Exchange) and the GDP of Australia ($720 billion). The $720 billion worth of commercial and multifamily securitisations outstanding only represents about 26% of commercial and multifamily mortgages that have been issued (Figure 5). This further shows the growth potential of this investment class.
Figure 4: Market comparison (as of December 31, 2006)
______________________________________________________________________ $438 $274 $741 $720 0 100 200 300 400 500 600 700 800
REIT 's Market Cap¹ Microsoft Corp. Market Cap² GDP of Australia³ Commercial + Mulifamily Securitisationⁿ U S$ B illio ns
____________________________________________________________
Source: (1) NAREIT; (2) Microsoft Website(3) The Economist, January 3, 2007 (n)Federal Reserve, Flow of Funds
Figure 5: Market comparison (as of September 30, 2006)
______________________________________________________________________ $5.6 $4.8 $7.8 $9.5 $2.8 0 1 2 3 4 5 6 7 8 9 10
Corporate Debt Federal Agncy Securities Single Family Securities Single Family Mortgages Commercial + Mulifamily Mortgages U S$T ri lli ons 0 1 2 3 4 5 6 7 8 9 10 U S$T ri lli ons
Current CMBS Outstanding
_________________________________________________________________________________________ Source: Federal Reserve, Flow of FundsPacific Rim Property Research Journal, Vol 13, No 4 403
According to Commercial Mortgage Alert (2007), retail collateral has commanded roughly a 25% share of issues by value for several years. The multi-family sector has declined in its share as office properties have increased in importance. The industrial and hotel property types have retained relatively small, but significant shares.
Since 1993, the proportion of issues carrying triple-A ratings has increased steadily, largely as a result of a number of improvements throughout the CMBS market. Originators and issuers have improved underwriting, documentation and marketing, which have helped to improve the average loan quality. Rating agencies have improved the rating process, with more sophisticated models incorporating more historical performance data, thereby providing a better guidance on risk. Property market fundamentals have remained healthy; and the market for CMBS has deepened, particularly for highly rated securities such as triple A rated CMBS, encouraging an increase in their supply. This trend is also driven in part by the shallow market for lowest grade CMBS tranches3, a chronic condition that exerts significant influence on both the public and private real estate debt markets.
The last three years (2004-2006) have seen a predominance issuance of floating rate notes. In 2006, 81% of the issues were floating rate notes, representing an increase of 1.2 % and 4.9% over 2005 and 2004 respectively.
The US CMBS market is dominated by conduit/fusion transactions4. In 2006, they accounted for 88% of the outstanding CMBS issuance, and the large loan deals for the remaining 12% (Standard & Poors 2006b). For analytical purposes, re-REMICS, CRE CDOs and corporate-dependant deals have been included in the above two categories due to their special collateral characteristics.
Conduit transactions have had strong investor appeal as evidenced by contraction in spreads. Figure 7 shows the 10-year fixed conduit spreads between 1996 and 2006. The earlier years saw upward movements in annual average spreads of between 44 basis points (bp) and 53 bp, with the exception being 1998 which recorded a high of 111 bp. However, after 2001, there has been a fall from a high of 53 bp to just less than 30 bp as at the end of 2006 (Commercial Mortgage Alert 2007).
3 Tranching involves issuance of several classes of securities against a pool of assets, each with distinct
risk-return profiles.
4CMBS backed by reasonably large, well diversified pools of small-to medium-sized and large-sized secured
Figure 6: 10-year fixed conduit spreads and 10-year treasury rate ______________________________________________________________________ 0 1 2 3 4 5 6 7 Year Jun-1997 Jun-1998 Jun-1999 Jun-2000 Jun-2001 Jun-2002 Jun-2003 Jun-2004 Jun-2005 Jun-2006 % 0 10 20 30 40 50 60 70 80 90 100 Bp
10 Year T reasury Rate 10 Year Conduit Rate
________________________________________________________________________________________ Source: Commercial Mortgage Alert
According to Fitch Ratings (2007b), by the end of 2006, the ratio of upgrades to downgrades was 34:1 (the highest ratio for structured finance products). Of the nearly 5000 CMBS deals they rated, the surveillance group upgraded 1,781 tranches and downgraded 52. Credit rating upgrades depict mainly an improvement in the performance of the underlying asset backing a CMBS issue and downgrades the opposite.
EU CMBS market
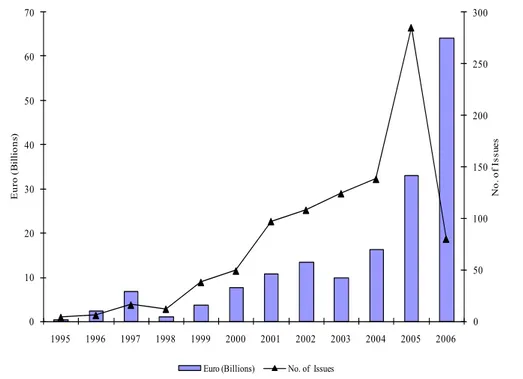
EU CMBS issuance in 2006 was AU$108 billion (€64.75 billion), an increase of 39% on 2005 levels. The number of transactions increased to 80 from 64 (Standard & Poors 2007a). Between 1997 and 2004, more than AU$129 billion (€77 billion) was raised from 124 transactions. Figure 7 shows an historical overview of annual issuance.
Pacific Rim Property Research Journal, Vol 13, No 4 405 0 50 100 150 200 250 300 0 10 20 30 40 50 60 70 1995 1996 1997 1998 1999 2000 2001 2002 2003 2004 2005 2006 N o . o f I ssu es E u ro ( B il li o n s)
Euro (Billions) No. of Issues Figure 7: EU CMBS issuance: 1995-April 2006
Source: Barclays Capital
The UK has been traditionally the dominant jurisdiction in EU CMBS issuance, accounting for 74% in 2004. Germany is rapidly catching up, with multifamily deals making up 23% of all CMBS and 29% of conduit deals in 2006 (Structured Finance International 2006).
In terms of asset composition, office and retail properties continued to form the dominant collateral security in 2006 at 31% and 28% respectively. The residential sector emerged as a leading collateral security in 2006, mainly driven by securitisation of loans secured by German multifamily portfolios; it increased from 15% in 2005 to 23% in 2006 (Moody's Investor Service 2007a).
By 2005, EU CMBS issuance was largely in the AAA rating category, with 60% of the total and AU$7.5 billion (€4.5 billion) worth of non-investment grade CMBS issued from 2000.Vresen (2005) points out that the majority of EU CMBS issuance from 2000 to Q1 2005 were floating notes averaging at 73%.
No single transaction type made up a majority issuance, mainly due to a wide range of legal structures to accommodate each of the transaction types. However, the single largest transaction type was the single-borrower single-property transaction with 28% of the total issuance to the end of 2004. Together, the single borrower and multi-borrower property categories made up 605 ( 68.8%) of the 879 issues as at end of 2005 (Vresen 2005). EU CMBS transactions are generally grouped into three segments: true-sale single borrower5, true-sale multiple borrower6 and synthetic transactions7. Figure 8 shows the dominance of true-sale transactions from 1999-2004. True-sale multiple borrower transactions comprised 68% and 42.3% of all true-sale transaction in 2003 and 2004 respectively (Moody's Investor Service 2005).
Figure 8: EU CMBS volume by structure category (1999-2004)
Source: Author’s compilation from various Moody’s Investor Service EU CMBS Year-end and Outlook Reports
Spreads tightened by approximately 60% in the last three quarters of 2004. In July 2004, the market saw AA spreads at around 40 bp, with two recent first quarter 2005 transactions closing at 17 bp for the AAA classes. This implied a 57.5% tightening in AAA over the last three quarters. Furthermore, the BBB class saw spreads at 200 bp in July and in the first quarter of 2005 at around 75%. This implied a 62.5% tightening at BB
5 True-sale borrower (single property, multiple-property, liquidating pool, credit tenant lease) 6True-sale multiple borrower (single property and multiple property)
7Synthetic transactions are typically funded through the sale of credit linked notes
7.1% 16.2% 35.7% 30.6% 32.1% 10.0% 92.9% 83.8% 64.3% 69.4% 67.9% 90.0% 0% 10% 20% 30% 40% 50% 60% 70% 80% 90% 100% 1999 2000 2001 2002 2003 2004 Segment Pe rcenta ge
Pacific Rim Property Research Journal, Vol 13, No 4 407
over the last three quarters. As a result, the difference between AAA and BBB spreads narrowed from 160 bp to only 58 bp, a 64% reduction (Vresen 2005). Obviously, lower spreads mean that bond investors are not being compensated as they were for similar risk. On the other hand, it also means that costs of funds for originators and borrowers are lower, making CMBS even more attractive as a financing source.
According to Vresen (2005), EU CMBS showed the best upgrade performance in 2004 of any major EU ABS sector, with 7.6% of the ratings being upgraded. This compares with an average upgrade in EU ABS of 4.5%. The 2004 CMBS downgrade-to-upgrade ratio was 0.4, just behind residential mortgage backed securities and consumer ABS, both which saw downgrades in 2004. Moody’s (2007b) reported 2006 EU CMBS upgrades at 8% and downgrades at 2.1%.
METHODOLOGY AND DATA
All CMBS presale reports from 1999 to 2006 as found in Standard and Poor’s Ratings Direct database were assessed. During this period, a total of 65 issues with over 180 tranches, worth over AU$14.8 billion were issued; this represents 100% of all the CMBS issued to 2006, excluding credit lease and small ticket transactions. These generic CMBSs which are single-borrower and multi-borrower transactions accounted for 62% of all the CMBS issuances in 2005 (Standard & Poor's 2005a). Credit lease and small ticket transactions are not discussed in this paper. Tables 1 and 2 show some of the major CMBS issues and some of the major properties in the portfolios backing these issues respectively.
Specific details obtained per CMBS issue were on issue size, underlying collateral, rating tranche distributions, interest rate types and transaction types. Details on CMBS market size, spread trends, and performance of the issues were obtained from other secondary sources. All these were used to assess how the market had developed and to compare and contrast with that of the US and EU. A cogent review and explanation of these features will help to understand the changing nature of the Australian CMBS market. Using the historical approach, a researcher endeavours to record and understand events of the past. In turn, interpretations of recorded history hold to provide better understanding of the present and suggest possible future directions (Baumgarter and Hensley 2005).
Table 1: Major Australian CMBS issues by transaction type No. Issue
Date Sector Issue Transaction Type S&P Rating Issued Amount (AU$m)
Coupon
Type Coupon/BBSW+ Scheduled Maturity DSCR** LTV** Security 1 Apr-01 Office CPIT 2006
Aurora Bonds Single-borrower single-property
Aaa* 150 Floating 41 Mar-06 2.0 32% ABN AMRO Office Tower with a total portfolio value of AU$713 million 2 Jun-01 Diversified Mirvac Capital Pty Ltd - Series 2001-1 Single-borrower multi-property AAA AAA 150 350 Fixed Floating 6.50% 41 Jun-06 Jun-06 2.2 2.2 40% 40% 25 modern, investment-grade buildings in the office, hotel, retail, industrial & carpark sectors with a total portfolio value of AU$1,430 million 3
Feb-02 Office ING Office Finance Pty Ltd Single-borrower multi-property AAA
AAA 230 178 Fixed Floating 6.25% 40 Feb-07 Feb-07 2.4 2.4 39% 39% 18 commercial office properties with a total portfolio value of AU$1,215 million 4 Jun-02 Diversified Challenger Capital Markets Ltd Multi-borrower multi-property AAA AAA A A BBB+ BBB BBB NR 100 120 61 54 55 17 10 99 Fixed Floating Fixed Floating Floating Fixed Floating Floating 6.00% 40 6.50% 80 100 6.75% 130 P Jun-05 Jun-05 Jul-05 Jul-05 Jul-05 Jul-05 Jul-05 Jul-05 2.7 2.7 1.8 1.8 1.5 1.4 1.4 2.7 32% 32% 48% 48% 56% 60% 60% 32%
25 retail, office, industrial, cinema and car park properties with a total portfolio value of AU$798 million 5 Nov-03 Retail ALE Finance Company Pty Ltd - Series 1 Whole-business AAA AAA AAA AAA AA 100 110 45 35 40 Fixed Floating Floating Floating Floating 6.60% 47 90 120 67 Nov-08 Nov-08 Nov-08 Nov-08 Nov-08 3.1 3.1 2.2 1.8 2.6 43% 43% 60% 71% 51%
101 pub assets with a total portfolio value of AU$562 million 6 May-05 Office Multiplex MPT CMBS Series 2005-1 Single-borrower multi-property AAA AA A BBB BBB- 343 61 54 51 28 Floating Floating Floating Floating Floating 20 30 40 57 80 May-08 May-08 May-08 May-08 May-08 2.0 1.7 1.5 1.4 1.3 40% 47% 53% 59% 62%
8 commercial properties with a total portfolio value of AU$932 million 7 May-05 Diversified Multiplex MPT CMBS Series 2005-2 Single-borrower multi-property AAA AA A BBB BBB- 298 53 39 52 21 Floating Floating Floating Floating Floating 25 40 50 75 90 May-10 May-10 May-10 May-10 May-10 2.0 1.7 1.5 1.4 1.3 40% 47% 52% 59% 62%
5 commercial and 4 retail properties with a total portfolio value of AU$804 million
8 Dec-06 Office Series MCWF 2006-1 Single-borrower multi-property AAA AA A BBB BBB- 320 50 25 30 15 Floating Floating Floating Floating Floating 19 23 27 47 57 Jun-11 Jun-11 Jun-11 Jun-11 Jun-11 1.8 1.5 1.5 1.4 1.3 44% 51% 54% 58% 60%
52 retail centres with a total portfolio value of AU$802 million 9 Dec-06 Office WOT CMBS Pty Ltd Series 1 Single-borrower multi-property AAA AA A BBB 320 45 90 50 Floating Floating Floating Floating 26 31 41 61 May-11 May-11 May-11 May-11 N/K N/K N/K N/K N/K N/K N/K N/K
2 office buildings, 1 retail building and 1 university building with a total portfolio value of AU$ 10 Dec-06 Retail Centro Shopping Centre Securities - CMBS Series 2006-1 Conduit AAA AAA AAA AA A BBB BBB- 250 300 170 37 62 53 28 Floating Floating Floating Floating Floating Floating Floating 19 24 18 28 40 65 85 N/K N/K N/K N/K N/K N/K N/K 1.8 1.8 1.8 1.8 1.8 1.8 1.8 43% 43% 43% 45% 49% 52% 54% 13 mortgage facilities secured against 47 retail properties and 1 retail distribution centre with a total portfolio value of AU$1,580 million
N/K: Not Known
Table 2: Major properties in Australian CMBS issues
Source: Author’s compilation from various Standard and Poor’s CMBS presale reports
Sector Issue Date of
Issue Major Property in Issue Property Value (AU$ M)
Office CPIT 2006
Aurora Bonds Apr-01 ABN AMRO Tower $495
Office Deutsche Office
Finance 2004-CMBS Trust
May-04 Governor Phillip
Tower and Governor Macquarie Tower, Sydney NSW $478 Retail/Office/ Hotel Quay 62 Pty Ltd Series 2005-1
Apr-05 Collins Place, 25-55 Collins Street,
Melbourne VIC
$425
Retail Quay 62 Pty Ltd
Series 2003-1 Oct-03 Southland, VIC $350
Office Mirvac Capital
Pty Ltd
Jun-01 The Optus
Centre, Miller St NSW
$330
Retail Deutsche Office
Finance 2004-CMBS Trust May-04 Southgate Complex, Melbourne VIC $316
Retail Centro Shopping
Centre Securities Limited - CMBS Series 2006-1
Jun-06 Centro Galleria, WA (50%) & Centro
Goulburn, NSW (50%)
$299
Retail Quay 62 Pty Ltd
Series 2003-1
Oct-03 Pacific Fair, Broadbeach $292 Industrial Deutsche Industrial Finance 2002 - CMBS Trust
Dec-02 DB Office Park,
North Ryde NSW $103 Industrial Macquarie Goodman Industrial Finance Pty Ltd.
Nov-01 City West Office Park, Pyrmont NSW
Pacific Rim Property Research Journal, Vol 13, No 4 411
ANALYSIS OF AUSTRALIAN COMMERCIAL MORTGAGE
BACKED SECURITIES
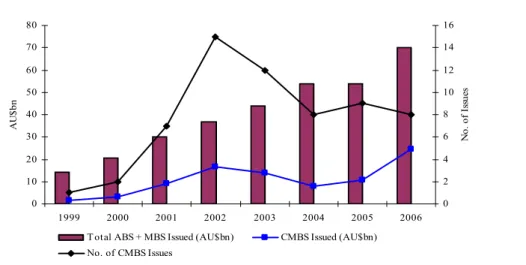
The overall cumulative Australian CMBS issuance since 1999 reached AU$17.5 billion at the end of 2006. In 2006, a record number of new issuances exceeding AU$4.9 billion were issued, passing the earlier issuance record year of 2002 (AU$3.7 billion)(Standard & Poors 2007b). The years 2003 and 2005 produced stable issuances of over AU$2 billion per year. In 2004, there was a slight fall in issuances to AU$1.6 billion. Figure 9 shows the volume of CMBS issuances since 1999 in dollar amount and number of issues per annum. It also shows the size of the CMBS issues in relation to the overall asset backed securities market. The total ABS issuance in the year 2006 was AU$70 billion, of which the CMBS sub-market accounted for 7%. This represents a significant leap from 2% of the $14.4 billion ABS total issuance in 1999 (Fitch Ratings 2007a).
Figure 9: Australian annual ABS/MBS/CMBS issuance volumes
0 10 20 30 40 50 60 70 80 1999 2000 2001 2002 2003 2004 2005 2006 A U $bn 0 2 4 6 8 10 12 14 16 N o. o f Is su es
T otal ABS + MBS Issued (AU$bn) CMBS Issued (AU$bn) No. of CMBS Issues
Source: Standard and Poors (2006a)
The last three years has seen an average number of issues of eight which is lower than the record number of issuances of fourteen in 2002. However, the size of issues has been increasing. For instance, all the new issues in 2006 each had a combined tranche value of over AU$400 million. Furthermore, the last two years have seen record issue sizes with AU$1 billion for Multiplex MPT CMBS Series 2005-1&2 in 2005 and AU$900 million for Centro Shopping Centre Securities - CMBS Series 2006-1 in 2006.
Figure 10 presents CMBS issuance by sector from 2000 to 2006, excluding credit lease and small ticket transactions. Over this six year period, the most dominant CMBS issues
have been in the office sector (AU$5.2 billion), followed by the retail sector (AU$4.5 billion). The diversified sector and the industrial sector have had AU$3.4 billion and AU$1.4 billion worth of CMBS issuance respectively.
Figure 10: Australian CMBS issuance by sector (2000-2006)
__________________________________________________________________________________________ 0 500 1000 1500 2000 2500 3000 3500 4000 4500 2000 2001 2002 2003 2004 2005 2006 A U $ m illio ns
Diversified Industrial Office Retail
_________________________________________________________________________________________ Source: Author’s compilation from Standard and Poor’s presale reports
Over 2000-2006, diversified backed issues had the most tranches at 31%, followed by retail backed issues at 28% and office at 23%. The least number of tranches were in the industrial backed issues at 18%. This is shown in Table 3.
Table 3: Number of tranches in Australian CMBS issues (2000-2006)
Sector 2000 2001 2002 2003 2004 2005 2006 2000-2006 % of Total Diversified 1 2 11 7 7 14 13 55 31% Industrial 4 3 6 12 4 3 0 32 18% Office 0 3 4 5 9 10 11 42 23% Retail 0 0 15 9 0 8 18 50 28% Total 5 8 36 33 20 35 42 179 100%
Source: Author’s compilation from Standard and Poor’s presale reports
Majority of the tranches have been A-class rated, though lower B-class tranches are becoming common as well (Figure 11). This shows the growth/maturing of the market,
Pacific Rim Property Research Journal, Vol 13, No 4 413
increased acceptance of the investment asset and the increased participation of more knowledgeable investors.
Figure 11: Australian CMBS issuance by tranche type and amount (1998-2006)
Source: Standard and Poors, 2006 #362
A combination of both fixed-interest and floating-rate notes have been issued to attract a broad spectrum of investors. In the earlier years, floating rate notes and fixed rate notes were issued in equal proportions. However, the last few years have been predominated by floating rate notes. For instance, in 2005, 68% were floating rate notes in comparison to 32% fixed rate notes.
Majority of the issues are in the single borrower multi-property category, with over 95% of the total issuance to date. The CPIT 2006 Aurora Bonds CMBS issued in April 2001 is the only single borrower single-property issuance to date being for a single Sydney CBD office property. Two multi-borrower multi-property issues have been by MCS Capital Pty Limited issued in May 2002 and Challenger Capital Markets Ltd issued in June 2002. ALE Finance Company Pty Ltd - Series 1 CMBS, issued first in November 2003 and its tap issue in April 2006, is the only whole-business CMBS to date.
2006 saw the introduction of the first Australian conduit-style CMBS common in the US, Centro Shopping Centre Securities Ltd, CMBS Series 2006-1. This AU$900 million transaction is the securitisation of a portfolio of 13 non collateralised and non cross-defaulted real estate backed debt facilities to 12 obligators. Each financing is backed by between 1 and 11 retail properties located in major Australian cities and regional centres.
0 5,000 10,000 15,000 20,000 25,000
Dec-98 Jun-99 Dec-99 Jun-00 Dec-00 Jun-01 Dec-01 Jun-02 Dec-02 Jun-03 Dec-03 Jun-04 Dec-04 Jun-05 Dec-05 Jun-0
AAA AA+ AA AA- A+ A A- BBB+ BBB
BBB-A U $ ( M il lio n s)
The total independent value of the asset-backing of the issue was AU$1.67 billion. The diversity of issuance transaction types show the maturity of the market, as well as the arranger’s confidence in trying out various CMBS structures to suit market needs.
These deals are structured on a ‘secured loan’8 basis, unlike other parts of the world where they are done on a ‘true-sale’ basis. A possible explanation is the predominance of Listed Property Trusts in the CMBS market, having a 65% market share (Standard & Poors 2005b). LPTs’ core business is real estate investment and retaining control of the securitised assets is critical to their survival.
Given the general appetite for fixed-income securities and the limited supply in the market, CMBS credit spreads were contracting until the end of 2005 and have been stable since the start of 2006 as shown in Figure 12. In 2005, ‘AAA’ five-year, interest only notes were priced at 20-25 bps (basis points) over three month bank bill swap (BBSW), and three-year, interest-only notes at 17-20 bps over three-month BBSW. ‘BBB’ were priced at 60-95 bps over BBSW. These margins were lower than those of 2002, when they were priced at least 20 bps wider for ‘AAA’ and 60 bps wider at ‘BBB’ level. At the beginning of 2006, both ‘AAA’ five-year and ‘AAA’ three-year were trading at average ranges of 8-10 bps; as at the end of 2006, they were trading at average ranges of 15-17 bps.
Figure 12: AAA rated CMBS - average industrial spread to swap (April 2003- November 2006) 0 5 10 15 20 25 30 35 40 45 50
Apr-03 Aug-03 Dec-03 Apr-04 Aug-04 Jan-05 May-05 Sep-05 Mar-06 Jul-06 Nov-06
A ver ag e B B SW ( bp ) 0 5 10 15 20 25 30 35 40 45 50 A ver ag e B B SW ( bp )
3 year average BBSW 5 year average BBSW
Source: Author’s compilation from Property Australia magazine
8 This involves “selling” assets to a special-purpose “bankruptcy-remote” entity that, in turn, pledges the assets
Pacific Rim Property Research Journal, Vol 13, No 4 415
Over the past three years (2003-2006), there were more upgrades than downgrades, buoyed by improvements in property performance. Stable property markets continue to be reflected in steady cash flows and occupancy trends. No rating changes were experienced throughout the second half of 2005. Of the six rating changes in 2006, three upgrades resulted from improved property performance and the three downgrades resulted from lowering of a support party rating. 2006 also had fifteen rating affirmations (Standard & Poors 2007b). Table 4 shows the total number of upgrades and downgrades between 2003 and 2006.
Table 4: Australian CMBS upgrades and downgrades
Source: Standard and Poors (2006)
FUTURE OUTLOOK OF AUSTRALIAN CMBS
The following support continued dominance of LPTs in CMBS issuance:
Their structure and single-purpose nature have been well established and
accepted in the market. Only about a third of the 48 LPTs have issued CMBSs. The others are yet to utilise them as funding sources.
Of the AU$116 billion (68% market coverage) institutionally owned property in Australia, LPTs contribute AU$75 billion (61% of total) (Higgins 2006). These assets are best suited for securitisation due to their high capital values and stable cash flows.
The low gearing levels in comparison to the US (Newell and Tan 2005)present possibility for further issuance of debt securities via CMBS. Australian LPTs had an average gearing level of 42.1%, whereas their US counter-parts (Real Estate Investment Trusts) had levels higher than 50% (BDO Chartered Accountants & Advisers 2006).
The provision to buy and sale collateral assets in CMBS portfolios supports market growth though ‘tap’ issuances. In 2006, over 80% of activity came from tap issues, refinancing and restructurings from existing sponsors (Efrat 2006).
Year Upgrades Downgrades No. of Ratings
2003 1 1 135
2004 4 0 136
2005 0 1 134
2006 3 0 136
The insatiable demand alluded to earlier by superannuation funds for fixed income securities issued by LPTs.
Many industry experts are divided on the role that unlisted property trusts will play in the growth of the CMBS market (Efrat 2006). Some contend that unlisted property trusts have become sophisticated and have outgrown their existing financing mechanisms and that CMBS are an alternative debt funding tool for them. However, others have highlighted that the higher unlisted property trust gearing levels would entail issuance of lower rated tranches, for example, double B and lower, which are not favourable for both issuers and investors.
The launch of Centro Shopping Centre Securities - CMBS Series 2006-1 in 2006 marked a milestone in the Australian CMBS market. Being the first such multi-borrower program, it is anticipated that momentum for other similar issues will come from small to medium enterprises and the loans this sector has sitting on bank’s books, most of which hasn’t historically been securitised. As at June 2006, total commercial property exposure by all banks was AU$94.5 billion, with 0.4% and 0.2% classified as nonperforming and impaired9 respectively (Reserve Bank of Australia 2006). Banks have generally been reluctant to securitise their commercial property loans due to the low default rates as shown in Table 5.
Table 5: Australian commercial bank property exposure
Source: Reserve Bank of Australia (2006); Australian Prudential Regulatory Authority (2006)
9 Assets on which payments are in arrears by more than 90 days or otherwise doubtful and the amount due is not
well covered by the value of collateral. The remainder of these assets were in arrears, but were well covered by collateral. Sector Commercial Property Exposure- All Banks (%) Share of Total Commercial Lending (%) Impaired Assets Share of Commercial Property Exposure (%) Office 25.5 10 0.1 Retail 18.5 7 0.1 Industrial 10.7 4 0 Land Developments/subdivisions 10.8 * * Residential 17.8 11 0.4
Tourism and leisure 4.4 2 0.1
Other 12.3 4 0.2
Pacific Rim Property Research Journal, Vol 13, No 4 417
The strong commercial real estate market outlook supports further CMBS issuance. Investors in real estate have been rewarded with strong returns with both direct property and LPTs outperforming shares and bonds over a ten-year period to Q4.2005; see Table 6 (PCA/IPD 2007; UBS 2007). This has reinforced the importance of real estate as an asset class in its own right, leading to sustained demand for real estate as evidenced by continued yield compression. Figure 13 shows yield trends in the retail, office and industrial sectors from 1991 to 2006. These trends are expected to continue due to the limited number of ‘investment-grade’ properties (Murdoch 2004)and the huge amounts being allocated to property investment, as alluded to earlier. The future outlook of various property sectors is positive: there is strong economic outlook and investor sentiment for industrial property (Jones Lang LaSalle 2006c; Newell and Peng 2007); continued catalysts to growth in retail property of strong rental growth, stable income streams, favourable planning environment limiting new supply and undue competition, and strong investor support (Burdekin and Snoswell 2004); and further office market growth underpinned by strong economic growth. Australia is ranked as the sixth most competitive country in the world (IMD 2006)and Sydney ranks highly at 46 in CB Richard Ellis’ Global Market Rents Report at November 2006 (CB Richard Ellis 2006). Sydney and Melbourne also feature prominently among major Asia-Pacific cities at sixth and tenth respectively in Jones Lang LaSalle’s Asia Pacific Property Digest (Jones Lang LaSalle 2006a). Generally, office markets across Australia have performed well, with record sales activity and rental growth in Perth and Brisbane.
Table 6: Asset class performance Q4:2006
Average Annual Return (%) Asset Class 1Y 3Y 5Y 10Y Direct property 17.29% 14.48% 12.96% 11.68% Office 17.76% 12.21% 10.24% 10.14% Retail 17.67% 16.40% 15.40% 12.84% Industrial 13.43% 12.91% 13.27% 13.59% LPTs 25.90% 19.40% 16.10% 16.07% Office 19.60% 13.00% 11.80% 10.80% Retail 28.10% 20.50% 18.10% 16.40% Industrial 36.20% 27.20% 20.40% 17.80% Shares 20.50% 15.50% 13.10% 13.11% Bonds 5.30% 5.50% 6.50% 6.33%
Figure 13: Australian commercial property yields (1989-2006)
CONCLUSION
Understanding global CMBS trends is important for investors and issuers. The globalisation of financial markets has seen the developments in the US CMBS market replicated in other parts of the world, albeit with some adaptation to suit local conditions. Conduit programs in the EU are predominantly single borrower transactions and have just been introduced in Australia. Single borrower transactions are the dominant issuance vehicles in both the EU and Australia. In the US, multi-borrower conduit transactions dominate.
The last few years have seen spreads tighten in US, EU and Australia, showing the appeal of CMBS as a funding source. The performance of CMBSs has also been good as characterised by the number of CMBS credit rating upgrades outstripping downgrades. This is attributable to the strong property performance supported by improving business climate and the persistently low interest rate environment which has spurred demand for alternative investments, such as real estate, as part of the broadening hunt for higher yielding, and commensurately riskier assets (ECB 2007: 58 ).
4.0% 5.0%
6.0%
7.0%
8.0%
9.0% 10.0%
11.0%
12.0% 13.0% 14.0%
Jun-89
Dec -91 Jun -94 Dec-96 Jun-99
Dec-01 Jun-04 Jan -06 CBD Office Off-Syd Industrial Retail Ret-Reg Ret-SReg Bond rate
Pacific Rim Property Research Journal, Vol 13, No 4 419
The Australian CMBS market is well matured as can be seen by comparison with the much bigger US and EU CMBS markets. High property market transparency (Jones Lang LaSalle 2006b)and predominance of LPTs as CMBS issuers (Standard & Poors 2005b), who legally have to report their activities and underlying collateral performance to regulatory regimes such as ASX/ASIC and their equity partners, have contributed to the success of the Australian CMBS market.
REFERENCES
Australian Prudential Regulatory Authority 2006a, APRA Insight, Q2:2006, APRA, Canberra.
Australian Prudential Regulatory Authority 2006b, Statistics: Quarterly Superannuation Performance, APRA, Canberra.
Baumgarter, T. A. and Hensley, L. D. 2005, Conducting and Reading Research in Health and Human Performance, Fourth edn, McGraw-Hill, Columbus.
BDO Chartered Accountants & Advisers 2006, BDO Australian Listed Property Trust Survey 2006, BDO Chartered Accountants & Advisers,, Sydney.
Blundell, L. 2001, 'Fundamentals Firm as Economy Falters', Property Australia, May, pp. 18-22.
Burdekin, J. and Snoswell, D. 2004, 'Retail Yields: How Low Can They Go?', Australian Property Journal, Vol. 38, pp. 260-265.
CB Richard Ellis 2006, Global Market Rents: November 2006, Available:
[
http://www.cbre.com/NR/rdonlyres/19655449-4C90-4388-A74E-F05A58547B7D/0/GMRNov2006FINAL.pdf] (March 14, 2007).
Commercial Mortgage Alert 2007, Global CMBS Issuance in 2006, Commercial
Mortgage Alert, Hoboken.
Draffin, P. 2002, 'Property Trusts Reviewed', Australian Property Journal, Vol. 37, pp. 89-93.
ECB 2007, Financial Stability Review, Available:
[http://www.ecb.int/pub/pdf/other/financialstabilityreview200612en.pdf] (2007). Efrat, Z. 2006, CMBS Explosion, Australian Securitisation Forum, Sydney.
Fitch Ratings 2007a, Australian Structured Finance 2006 Summary and 2007 Outlook, Fitch Ratings, Sydney.
Fitch Ratings 2007b, U.S. CMBS 2007 Outlook, Fitch Ratings, New York.
Higgins, D. M. 2006, 'Positioning Commercial Property in the Australian Investment Market', in 12th Annual Conference of the Pacific Rim Real Estate Society, January 22 to 25, 2006, Auckland, New Zealand.
IMD 2006, World Competitiveness Yearbook, Available:
[http://www.imd.ch/research/publications/wcy/competitiveness_scoreboard_2006.cfm]
(March 14, 2007).
InTech 2003, Institutional Listed Property Exposure, JB Were Investment Series.
Jacob, D. P. and Fabozzi, F.J, 2003, The Impact of Structuring on CMBS Class Performance, Journal of Portfolio Management, Special Real Estate Issue, pp. 76-86. Jones Lang LaSalle 2001, Commercial Mortgage Backed Securities: The New Kid on the Block, Sydney.
Jones Lang LaSalle 2002, Europe's Real Estate Capital Markets: Debt Changing the Landscape, London.
Jones Lang LaSalle 2006a, Asia Pacific Property Digest: Q4, 2005, Jones Lang LaSalle, Sydney.
Jones Lang LaSalle 2006b, Global Real Estate Transparency Index, Jones Lang LaSalle, Chicago.
Jones Lang LaSalle 2006c, Survey of Investor Sentiment: December 2005, Jones Lang LaSalle, Sydney.
Kavanagh, J. 1997, 'Trust Changing Gear', Property Australia, June, pp. 14-15.
Moody's Investor Service 2005, 2004 Review and 2005 Outlook: EMEA CMBS: Near
Record Issuance and Continued Growth Expected for 2005, Moody's Investor Service, London.
Moody's Investor Service 2007a, 2006 Review and 2007 Outlook: EMEA CMBS: Another
Record Year with Tremendous Growth in the German CMBS and Multifamily Market,
Pacific Rim Property Research Journal, Vol 13, No 4 421
Moody's Investor Service 2007b, European Structured Finance rating Transitions: 1988-2006, New York.
Morrison, R. 2001, 'Sophisticated Debt Management by LPTs', Property Australia, Vol. 15, No. 10, pp. 16-17.
Murdoch, J. 2004, 'The Globalisation of Australian Listed Property Trusts', Australian Property Journal, February, pp. 5-11.
Newell, G. 2006, 'The Significance of Property in Industry Based Superannuation Funds in Australia', in 12th Annual Conference of the Pacific Rim Real Estate Society, January 22 to 25, 2006, Auckland, New Zealand.
Newell, G. and Peng, H. W. 2007a, 'The Significance and Performance of Industrial Property in Australia', in 13th Pacific Rim Real Estate Society Conference, 21-24 January, Fremantle.
Newell, G. and Peng, H. W. 2007b, 'The Significance and Performance of Retail Property in Australia', Journal of Property Investment & Finance, Vol. 25, No. 2, pp. 147-165. Newell, G. and Tan, Y. K. 2005, 'The Changing Risk Profile of Listed Property Trusts', in 11th Annual Conference of the Pacific Rim Real Estate Society, Melbourne, January 23-27.
PCA/IPD (2007). Investment Performance Index: December 2006, PCA/IPD. Sydney Reserve Bank of Australia 2006, Financial Stability Review: March 2006, RBA, Sydney. Richardson, K. 2003, 'CMBS Market Shaping For Another Growth Spurt', Property Australia, March, pp. 36-39.
Roche, T. 2000, 'Trends in the Debts Markets', Australian Land Economics Review, pp. 73-86.
Standard & Poors 2005a, Australia & New Zealand CMBS Performance Watch, Standard & Poors, Melbourne.
Standard & Poors 2005b, The Australian CMBS Market: The Story So Far, Standard & Poors, Melbourne.
Standard & Poors 2006a, Australia & New Zealand CMBS Performance Watch, December 31, 2005, Standard & Poors, Melbourne.
Standard & Poors 2006b, Standard & Poor's CMBS Surveillance Process, Standard & Poors, New York.
Standard & Poors 2007a, European CMBS Outlook 2007 - A Year of Continued Progress, Standard & Poors, London.
Standard & Poors 2007b, Fourth-Quarter and Year-End 2006 Australia and New Zealand Structured Finance Performance Trends, Standard & Poor's, Melbourne.
Structured Finance International 2006, 'Rise of the Conduits', In Structured Finance International, Vol. 47.
UBS (2007). UBS Indices: December 2006, UBS, Sydney
Vresen, H. J. 2005, European CMBS: A Market Overview, Investment Property Forum, London.