U.S. Department of Energy
Energy Efficiency and Renewable Energy Federal Energy Management Program United States
Environmental Protection Agency
B e s t P r a c t i c e s
Introduction
Laboratory ventilation systems are designed to isolate and protect occupants from hazardous fumes and to provide outside air at a comfortable temperature. Program-matic needs—such as exhaust devices, inter-nal loads, and safety-mandated air changes— usually call for a large volume of conditioned make-up air. Where a high volume of air must be exhausted, a once-through ventilation system is usually required. Once-through sys-tems are often mandated by codes that pro-hibit the recirculation of air from a laboratory space to adjacent spaces. The operational costs associated with high-airflow systems are magnified when laboratory ventilation sys-tems are operated continuously—24 hours per day, 7 days per week.
To optimize a laboratory’s mechanical heating, ventilating, and air-conditioning (HVAC) system, it is essential to recognize the building’s unique aspects and operation. To reduce energy use in laboratory buildings, the ventilation system is usually the largest and easiest target. Figure 1 is a breakdown of measured electricity use at Louis Stokes Laboratories on the National Institutes of Health campus in Bethesda, Maryland. The figure shows that, because ventila-tion consumes about 44% of the building’s total electricity usage, reducing its power requirement by 25% would save as much energy as the amount consumed by all the building’s lighting.
If only the regulated loads in American Society of Heating, Refrigerating, and Air-Conditioning Engineers (ASHRAE) standard 90.1 are considered, the percentage of energy savings is even higher. Implementing low-pressure-drop design strategies established in the early stages of the design process will result in much lower energy costs throughout the system’s life. First costs, however, typically will increase, because of such factors as the need for addi-tional mechanical room space and larger duct shafts and plenums. But these increases can be mitigated by the decreases in first costs resulting from the designers’ subsequent ability to reduce the size of fans and motors, specify duct construc-tion details (low vs. high pressure), and eliminate sound attenuators.
The design and planning team in the mechanical penthouse of Building 50, a new research laboratory in the National Institutes of Health campus in Bethesda, Maryland. Behind the team are supply ducts for the building’s air handler.
L
OW
-
PRESSURE
-
DROP
HVAC D
ESIGN
FOR
L
ABORATORIES
National
Institutes
of
This guide to low-pressure-drop design is one in a series on best practices for laboratories. It was produced by Laboratories for the 21st Century (“Labs 21”), a joint program of the U.S. Environmental Protection Agency and the U.S. Department of Energy. Geared toward archi-tects, engineers, and facility managers, these guides pro-vide information about technologies and practices to use in designing, constructing, and operating safe, sustainable high-performance laboratories.
Strategies
Impact of Ventilation Energy Use
The electrical power requirements of the ventilation system are represented by the combined supply and exhaust fan power. Fan input power can be estimated by the following equation (where airflow is in cubic feet per minute [cfm], pressure drop is in inches water gauge [in. w.g.], power is in brake horsepower [brake hp], and η is efficiency):
Reducing the energy consumed by a laboratory’s ven-tilation system requires changing one or more of the three variables in the equation above: fan system efficiency,
airflow, or system pressure drop. Table 1 indicates areas of opportunity for reducing the power requirement of a laboratory’s ventilation system.
Fan system efficiency: Standard design practice usual-ly results in an efficiency of around 62%. Careful selection of a direct-drive fan, where appropriate, and use of high-efficiency motors can push that high-efficiency up to around 72%, resulting in a power reduction of about 15% at best. While this is an important aspect of design, opportunities are minimal; if energy efficiency is emphasized as an important design criteria, however, conventional design methods can optimize the fan efficiency.
Airflow: The airflow through the system is typically set by the requirements of the facility, and two key design decisions separate typical laboratory facilities from energy-efficient ones. The design decision with greatest impact on airflow energy use is to use a variable-flow exhaust system rather than a flow or constant-volume (CV) system. Varying supply and exhaust flows based on actual usage immediately captures the signifi-cant savings possible from reducing the flow; a 25% reduc-tion in airflow results in about a 58% reducreduc-tion in the fan power required. Note that the ASHRAE 90.1 standard requires variable-air-volume (VAV) systems, with some exceptions. The second design decision typically impact-ing laboratory airflow levels is the determination of the minimum laboratory airflow rate. A minimum airflow rate exceeding 1 cfm per square foot should be carefully inves-tigated to verify whether it is truly necessary.
System pressure drop: This variable typically offers the greatest potential for energy savings in the ventilation system. Despite the huge impact of the ventilation system on yearly energy consumption, it is not uncommon to see laboratory buildings with a supply and exhaust system combined total of 8 to 12 in. w.g. pressure drop. As shown in the fan power equation, this very high pressure drop directly results in a ventilation system with high power consumption. To reduce the ventilation system’s energy consumption, then, all that is required is to reduce the system’s pressure drop. This area provides the most opportunities for significantly improving the efficiency
Figure 1. Breakdown of annual electricity use based on measured data from Louis Stokes Laboratories at the National Institutes of Health in Bethesda, Maryland. Lighting 11% Ventilation 44% Plug 23% Cooling 22%
Table 1. Potential for Ventilation Energy Savings in Traditional
Laboratory Designs
Parameter Savings Potential Comment
Fan system efficiency 5%–15% Minor potential, traditional design is often OK
Airflow 0%–60% VAVcompared with constant-flow systems; actual savings depend on facility usage 1 supply and exhaust systems provide big savings in fan and conditioning energy when System pressure drop 30%–65% Traditional design results in energy-intensive laboratory systems; large reductions are possible in numerous areas
1 VAV = variable air volume.
Airflow (
cfm
) x System air pressure drop
(in. w.g.)
=
Fan input
power
(brake hp)
6345 x Fan system efficiency
of a laboratory ventilation system; therefore, it is the focus of this guide.
The pressure drop in a laboratory ventilation system should be addressed throughout both the supply and exhaust sides of the system. The following sections describe how the pressure drop can be reduced in each component of an air distribution system, and they include pressure drop benchmarks corresponding to standard, good, and better practice. Although VAV systems inher-ently reduce pressure drop during non-peak loads by reducing the volume of airflow, designers using VAV sys-tems should still consider these recommendations. This is encouraged because sizing for low pressure drop under peak conditions also provides significant flexibility to add load to the system in the future. Also, some laboratories (e.g., at the University of California, Merced) are more con-cerned about controlling peak than saving energy. All else being equal, the economically optimum pressure drop for a VAV system will be higher than that for a CV system.
The following paragraphs discuss the implications and impacts of pressure drop in various HVAC compo-nents. These include air handler coils, energy recovery devices, VAV control devices, zone temperature control devices, ductwork, and exhaust stacks.
Air Handler Coils
Traditional air handler design for office buildings bases the size of the air handler on a face velocity of 500 feet per minute (fpm) at the coil face. Originally based on a balance between the first cost and the lifetime energy cost of the equipment, this decades-old rule of thumb for face velocity was never intended for sizing a unit that operates 8,760 hours per year. The face velocity is very important because it has a direct impact on the energy consumption of the AHU.
Selecting a lower face velocity reduces the pressure drop of the AHU and thus its energy consumption. As shown in Figure 2, a reduction in face velocity reduces the power requirement by the square of the velocity reduction; for example, a 25% reduction in face velocity yields a 44% reduction in the power requirement. The standard argu-ments against reducing the face velocity, which are usually refuted by the high life-cycle energy costs of a laboratory system, are that the first cost is too high and it requires too much floor space or additional ceiling height. Another concern is coil performance at low face velocities, especial-ly at velocities below 200 fpm. However, coils that perform well at low face velocities can be selected. Designers should review the selection of any coils that would operate below standard minimum face velocities with the coil manufacturer. In addition, the layout of plenums or unit
casings should be coordinated to ensure even airflow across the coil at all operating conditions.
The argument that decreasing the face velocity results in unacceptable cost increases fails on two fronts. The first is that the 500 fpm “standard” is a carryover from the operation of a typical office air handler, which is less than 4000 hours per year. The lifetime energy consumption costs of a laboratory system, even neglecting the typically much higher pressure drops, are double those of an office air handler. It is not possible for the 500 fpm rule of thumb for minimizing the lifetime costs of office air handlers to apply to operation at both 10 hours a day and 24 hours a day, and no substantive argument beyond convenience can be made for its continued use. The second consider-ation is that a unit with a lower face velocity not only results in lower energy consumption, it also tends to add little, if any, first cost when properly designed.
It is easy to understand how lowering the face veloci-ty requires a larger and thus more expensive enclosure. But any analysis of the added cost should not end with the enclosure cost, because the lower energy requirement reduces the cost of most other components. The coil will have double the surface area but half the rows, resulting in a minimal cost increase. The fan motor size in a typical system can be reduced by 25%–50% because of the lower pressure drop in the air handler alone.
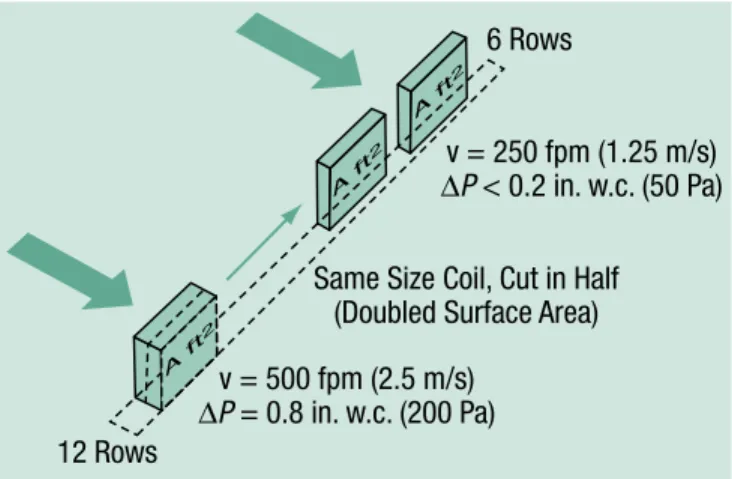
Figure 2. Coil configuration for low face velocity
6 Rows v = 250 fpm (1.25 m/s) ∆P < 0.2 in. w.c. (50 Pa) v = 500 fpm (2.5 m/s) ∆P = 0.8 in. w.c. (200 Pa) 12 Rows
Same Size Coil, Cut in Half (Doubled Surface Area)
1. Standard coil design is 500 fpm (2.5 m/s).
2. Cutting coil in half gives double the face area, half the velocity, and a quarter of the ∆P.
3. Filters, dampers, dehumidifiers similarly reduce ∆P by four times. This increases filter life, decreases by-pass leakage through filter frames and media, and improves aerodynamics through all elements.
4. Fans are much lower ∆P, less horsepower, less vibration and noise, and lower rpm; hence, better bearing life; smaller, cheaper VFD; cheaper casing; and reduced leakage
A smaller fan motor saves money, as does a smaller variable-frequency drive (VFD), smaller wiring, and the smaller circuits required to supply the motor. The smaller fan adds less heat to the supply air, which reduces the size and operating cost of the building cooling system. More filters will be required to fill the greater face area, but the filter change interval can be extended a proportional amount, resulting in no additional annual filter cost. A reduction in maintenance due to longer intervals between filter changes will typically result in a lower maintenance cost over the life of the unit. When all these effects are considered, the real cost increase of an “oversized” low-face-velocity air handler versus a standard unit is often negligible.
Typically, a lower face velocity air handler requires little additional floor space. When evaluating options, it is important to keep in mind that the air handler represents a significant amount of the system pressure drop in a very compact package. The air handler, with internal filtration and coils, represents more than 25% of the total supply and exhaust system pressure drop (about half of the sup-ply system drop). Reducing the face velocity in a typical 20,000-cfm AHU by 25% increases the width of the unit by only about 2 ft, possibly requiring an additional 50 ft2 of mechanical floor space (assuming that the height cannot be increased at all). A slightly larger face area has negligi-ble impacts on the architectural requirements of the air handler system when the face area is incorporated in the initial design stage. A design that incorporates increased coil face areas will have impacts on the size and configura-tion of other elements in the air handler, however, and the designer should engineer the system accordingly.
Component Standard Good Better
Air handler face velocity 500 fpm 400 fpm 300 fpm
Air handler pressure drop1 2.7 in. w.g. 1.7 in. w.g. 1.0 in. w.g.
1 The pressure drop includes coils, clean 30% and 85% filters, humidifier, and
intake damper.
Energy Recovery Devices
Four commonly used energy recovery systems are often considered for laboratories: energy recovery wheels, flat-plate air-to-air heat exchangers, heat pipes, and run-around coils. All these systems have unique pros and cons (for more information, see Energy Recovery for Ventilation Air in Laboratories in the Labs 21 Web site’s Tool Kit). The following sections consider the additional fan costs associ-ated with the pressure drop through various types of energy recovery devices.
Enthalpy wheels. For small applications, an enthalpy wheel can easily be sized for a reasonably low pressure
drop. In larger applications, the first cost of many low-pressure-drop wheel selections can be a concern. The need for protection from crossover typically requires a signifi-cant purge section; this results in a higher total ventilation rate (cfm) and increases the total fan energy required.
An enthalpy wheel also requires the main supply and exhaust ducts to be adjacent to each other. Because most laboratories have strict requirements for separation of the exhaust and intake air locations, configuring the supply and exhaust ducts to be next to each other usually causes more convoluted duct runs, resulting in higher pressure drops than if the supply and exhaust ducts were not adjacent. However, with careful architectural design and configuration of the ducting system, it is possible that duct layout requirements can be fulfilled with an efficient, low-pressure-drop layout.
Flat-plate heat exchanger systems. A flat-plate heat exchanger system can be very effective, assuming any cross-contamination issues are adequately addressed. It can be specified for a low pressure drop provided two key issues are addressed. The first is that, as with the energy recovery wheel, the supply and exhaust ductwork must be adjacent to each other. The second issue is the specification of the heat exchanger itself. Achieving the best possible performance requires a pressure drop of 0.25 in. w.g. on the supply side, and an equal or lower pressure drop on the exhaust side. This often requires the specification of very large units.
Heat pipe systems. A heat pipe system offers excellent energy recovery performance. One problem, however, is that restrictions on the supply and exhaust duct layout can be even more stringent than those of a flat-plate heat exchanger, although a new product allows the use of pumped refrigerant heat pipes that would overcome some of the restrictions. The additional restrictions increase the design challenge of laying out a clean, low-pressure-drop ducting system. Heat pipes not only require the supply and exhaust streams to be adjacent to one another, they also require a specific vertical/horizontal arrangement, because heat pipes are gravity-sensitive devices. At pres-ent, heat pipes are also a more expensive technology, and this results in a tendency to size them for a high pressure drop, 1.0 in. w.g. or higher, to minimize first cost.
Run-around coil systems. These systems can require significant effort to properly specify and optimize, but they offer great flexibility in minimizing pressure drop, because the supply and exhaust ducts do not have to be adjacent to each other. When combined with a low-face-velocity air handler, a run-around coil system can provide good energy recovery performance and very low pressure drop.
Component Standard Good Better
Energy recovery device pressure drop (per airstream)1
1.00 in. w.g. (when present)
0.60 in. w.g. 0.35 in.w.g.
1 Upstream filters would increase the pressure drop. For a standard 30% efficient
clean filter, the associated pressure drops are 0.27 in. w.g. at 500 fpm, 0.18 in. w.g. at 400 fpm, and 0.10 in. w.g. at 300 fpm.
VAV Control Devices
A variable-flow supply and exhaust system reduces the airflow, and the power required to run it is also reduced by approximately the cube of the reduction in flow. The greatest challenge in applying VAV systems in laboratories is ensuring that the balance between supply and exhaust is maintained properly. Numerous systems can maintain the precise airflow control required for effec-tive variable supply and exhaust systems. Typically, they make use of one of two general methods: direct pressure-independent measurement of air flows, or through-the-wall airflow or pressure measurement in the fume hood.
While these methods are radically different, the results are comparable. The primary difference is that the pres-sure drop associated with prespres-sure-independent flow measurement valves is about 0.60–0.30 in. w.g., in com-parison to about 0.05 in. w.g. pressure drop across a typical butterfly control damper. The energy savings associated with a 0.25 in. w.g. pressure difference on the supply and exhaust side adds up quickly when the entire laboratory facility’s airflow is considered.
Component Standard Good Better1
VAV control devices pressure drop
Constant Volume (NA)
0.30–0.60 in.
w.g. per device 0.10 in. w.g.
1 The relative merits of these flow control methods are not judged, only the
relative pressure drops (and associated efficiency potential). Other design requirements can also affect the best choice per application.
Zone Temperature Control Devices
If the airflow to a laboratory space is dictated by the minimum ventilation requirements of the space, vari-able airflow cannot be utilized for temperature control. When these conditions occur, the typical method to pro-vide zone temperature control is to propro-vide a zone reheat coil. The disadvantage of this system is the pressure drop incurred by the zone coil whenever the system is operat-ing, which can be all 8,760 hours in a year in some labora-tories. Consequently, the energy cost associated with zone coil pressure drop quickly adds up.
There are a number of ways to minimize the pressure drop of zone reheat systems. An easy first step is to use the high-volume, high-operating-hours nature of the system to justify the cost of a coil with lower face velocity. Such an
approach recognizes the cost of pressure drop and results in a fairly low-pressure-drop solution.
A better approach is to eliminate the zone coil from the primary supply airflow. Several design options will allow this. Reheat coils can be eliminated by utilizing radiant heating in the laboratory space. A radiant slab offers additional savings by reducing the heating of the air, which is rapidly exhausted from the space. A fan-coil unit with heating and cooling coils can be added to each zone. The fan coil should operate only when there is a need for additional heating or cooling in the zone. One way to reduce pressure drop in four-pipe fan-coil systems is to use a single coil with automatic isolation valves (pro-vided that some mixing of the cooling water and heating water is acceptable). In some light lab situations, radiant cooling can be used to good effect along with fan coils in spaces where higher capacity is required.
Implementing a fan coil in a space may require coor-dination with and education of local authorities if there are any prohibitions in the local codes on air recirculation in a laboratory space. A properly implemented fan-coil system will not mix air between any zones and will have no impact on space pressurization and ventilation rates. While it does not violate the intent of most code regula-tions, this approach may be unfamiliar and may require educating and gaining the approval of inspectors.
Component Standard Good Better
Zone coil pressure drop 0.42 in. w.g. 0.20 in. w.g. 0.00 in. w.g. (i.e., no reheat coils)
Ductwork
One simple measure that can reduce ductwork pressure drop (and costs) is to manifold fume hoods. Combined with the use of a VAV fume hood system, con-necting all the hoods to a common exhaust duct results in significant energy savings by taking advantage of opera-tional diversity. Manifolding exhaust is also essentially a prerequisite for both an energy recovery system and the most efficient exhaust fan and stack options. A manifold system is also typically less expensive to construct and maintain than is a configuration with a separate fan for every hood.
Reducing the ductwork pressure drop is perhaps the easiest design change that can be made to improve the efficiency of a laboratory’s mechanical system, because it requires little change in traditional design methods. Larger ductwork also provides flexibility in case flow requirements increase in the future. Like the air handler, supply ductwork is usually designed to a rule of thumb target pressure drop using the constant-pressure-drop
method carried over from office conditioning design, or it is designed to stay within maximum noise levels.
A common pressure drop range used for duct sizing in office buildings is 0.1 in. w.g. per 100 ft of ductwork, but sometimes higher. For a laboratory building operating 8,760 hours per year, it is often reasonable to design to half this pressure drop. Decreasing this design parameter to 0.05 in. w.g. per 100 ft is a simple step and is often defensible because it would halve the energy consump-tion attributable to the ducting system.
Exhaust ductwork is sometimes sized using the con-stant-velocity method, which leads to systems with higher pressure drop. A typical laboratory has high volumes of fume and vapor exhaust that do not require or benefit from a constant-velocity system. In the rare cases in which particulate exhaust is required, a separate, small exhaust system should be used to avoid incurring the energy pen-alty associated with high-pressure-drop constant-velocity design in the presence of high volumes of laboratory exhaust.
The incremental cost of larger ductwork is often overemphasized. Lower pressure drop design can reduce the complexity of ductwork, requiring fewer contraction fittings and shorter, more direct layout (which usually necessitates the cooperation of the project architect). The labor and fitting costs associated with numerous duct contractions versus longer runs of a single, larger diame-ter duct may help offset the additional madiame-terial cost. Construction management efficiencies may also be gained from using fewer different sizes of ductwork in a project, for example, when only round ductwork and fittings 24 in. and 18 in. in diameter are used for the distribution ducting.
Component Standard Good Better
Ductwork pressure drop 4.5 in. w.g. 2.25 in. w.g. 1.1 in. w.g.
Exhaust Stacks
Safe expulsion of exhaust air that may contain toxic contaminants is a requirement for laboratory buildings. To ensure adequate dilution of the exhaust, it must be ejected from either a significant height or at a high velocity (around 4,000 fpm). ASHRAE and American Industrial Hygiene Association (AIHA) guidelines require exit velocities of 2,000 to 3,000 fpm, even when a tall exhaust stack is used. The fan energy required to supply this velocity, which is part of the total pressure drop as veloci-ty pressure, and the pressure drop in the stack itself are the most significant components of the exhaust system pressure drop. In a CV system, the stack pressure drop
can be minimized using conventional duct design tech-niques. Minimizing the pressure drop in a VAV exhaust system is made more difficult by the varying exhaust flow. Sometimes laboratory owners may allow for a lower minimum based on wind tunnel modeling results but still require that the system be designed for a higher minimum exit velocity. In these cases, variable-frequency drives may be used to modulate exhaust flow between the minimum and the design exit velocity, allowing for lower discharge velocities during periods of reduced exhaust flows.
Another approach to a variable-flow exhaust system is to maintain a constant volume through the stack itself by drawing in dilution air immediately before exhaust air reaches the exhaust fan. The dilution air allows the stack to operate safely even when the laboratory exhaust vol-ume has dropped to the point where the stack exit velocity would be too low to ensure proper dispersion. Dilution air incurs a fan power penalty because more airflow than is required for the laboratory process must be pushed through and out the stack by the exhaust fan. When the velocity pressure is included, the use of this approach typ-ically results in a pressure drop greater than 0.5 in w.g. This fan power penalty still makes a VAV system far supe-rior to a CV system, however, in which, at low exhaust load conditions, dilution air is essentially drawn from the conditioned laboratory space.
Another alternative approach is to have multiple fans, each with a dedicated stack, draw from a common exhaust plenum. As the required exhaust volume drops, fans and their dedicated stacks are staged off. Motorized or flow-actuated backflow dampers are used to minimize leakage through shut-off stacks back into the plenum. Reducing the number of stacks in use allows a safe exit velocity to be maintained without having to maintain a constant, high-volume flow through the exhaust system. This is the case in Donald Bren Hall at the University of California, Santa Barbara (see the Labs 21 Web site Tool Kit for this case study). Note that the number of fans affects the ability to stage the fans, and the design stack velocity may need to be increased (e.g., peak at 4000 fpm, stage off at 3000 fpm).
Component Standard Good Better
Exhaust stack peak pressure drop 0.7 in. w.g. full design flow through entire exhaust system, constant volume 0.7 in. w.g. full design flow through fan and stack only, VAV system with bypass
0.75 in. w.g. averaging half the design flow, VAV system with multiple stacks
Design Considerations
Schematic Design
• Ensure that mechanical space (floor area and ceiling height) allows for low-face-velocity AHU design. • Design lab layout, service spaces, and AHU locations
to facilitate rationalized duct layout with short, straight runs, manifolded exhausts, and low-pressure-drop energy recovery.
• Ensure that service spaces (ceiling plenums, vertical chases) have adequate space for low-pressure-drop duct sizes.
• Set targets for pressure drop.
Design Development
• Size AHU components (fans, filters) based on reduced face velocity, not standard rules of thumb.
• Include pressure drop as a criterion in selecting an energy recovery device and VAV dampers.
• Consider removing zone coils from primary air supply (e.g., radiant floors and ceilings, fan coils, baseboard radiators).
• Specify larger, more direct, low-pressure-drop ductwork.
• During value engineering, ensure life-cycle cost of AHU includes first cost savings from downsized components as well as energy and maintenance cost savings.
Codes and Standards
Although ASHRAE 90.1 Energy Standard for Buildings Except Low-rise Residential Buildings does not explicitly address pressure drop in laboratory systems, it does contain fan power limitations that effectively require laboratories to adopt low-pressure-drop design in order to meet the standard. This has become an issue especially for laboratories applying for the U.S. Green Building Council’s Leadership in Energy and Environmental Design (LEED)™ rating, since LEED requires compliance with ASHRAE 90.1-1999. Other codes and standards that have implications for low-pressure-drop design include National Fire Protection Association (NFPA) 45,
Occupational Safety and Health Administration (OSHA) 1910.1450, and American National Standards Institute (ANSI) /AIHA Z 9.5.
Conclusion
Specifying low-pressure-drop design for a laborato-ry’s ventilation system has great potential for energy savings. High pressure drop results in a ventilation system with high power consumption. Pressure drop should be addressed throughout both sides—the supply and the exhaust. This guide has presented several strate-gies for reducing the pressure drop in each component of the air distribution system.
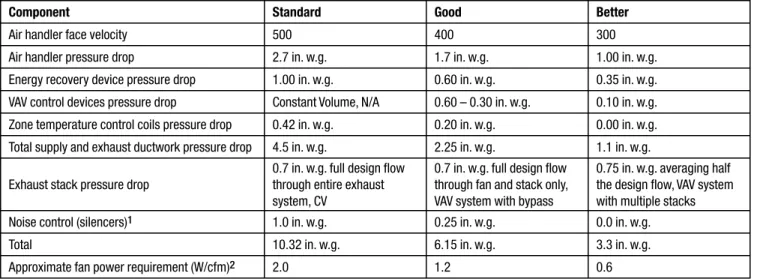
Table 2 summarizes the impacts that both good and better design practices can have on the pressure drop of a laboratory’s ventilation system.
Table 2. Summary of Impacts of Designing Ventilation Systems with Low
Pressure Drop
Component Standard Good Better
Air handler face velocity 500 400 300
Air handler pressure drop 2.7 in. w.g. 1.7 in. w.g. 1.00 in. w.g.
Energy recovery device pressure drop 1.00 in. w.g. 0.60 in. w.g. 0.35 in. w.g.
VAV control devices pressure drop Constant Volume, N/A 0.60 – 0.30 in. w.g. 0.10 in. w.g.
Zone temperature control coils pressure drop 0.42 in. w.g. 0.20 in. w.g. 0.00 in. w.g.
Total supply and exhaust ductwork pressure drop 4.5 in. w.g. 2.25 in. w.g. 1.1 in. w.g.
Exhaust stack pressure drop
0.7 in. w.g. full design flow through entire exhaust system, CV
0.7 in. w.g. full design flow through fan and stack only, VAV system with bypass
0.75 in. w.g. averaging half the design flow, VAV system with multiple stacks
Noise control (silencers)1 1.0 in. w.g. 0.25 in. w.g. 0.0 in. w.g.
Total 10.32 in. w.g. 6.15 in. w.g. 3.3 in. w.g.
Approximate fan power requirement (W/cfm)2 2.0 1.2 0.6
1 Good practice corresponds to the use of low-pressure-drop sound attenuators. Better practice corresponds to eliminating the need for sound attenuators by appropriate
duct design and layout.
2 To convert pressure drop values into the commonly used metric of W/cfm, these assumptions were used in the fan power equation: 0.62 fan system efficiency
Laboratories for the 21st Century U.S. Environmental Protection Agency
Office of Administration and Resources Management www.labs21century.gov
In partnership with the U.S. Department of Energy
Energy Efficiency and Renewable Energy
Bringing you a prosperous future where energy is clean, abundant, reliable, and affordable
www.eere.energy.gov Prepared at the
National Renewable Energy Laboratory A DOE national laboratory
DOE/GO-102005-2042 January 2005
Printed with a renewable-source ink on paper containing at least 50% wastepaper, including 20% postconsumer waste
References
American Society of Heating, Refrigerating, and Air-Conditioning Engineers. 2000. ASHRAE Handbook— HVAC Systems and Equipment, Chapter 18.
American Society of Heating, Refrigerating, and Air-Conditioning Engineers. 1999. ASHRAE Handbook— Applications, Chapter 43.
ASHRAE/IESNA Standard 90.1–1999. Energy Standard for Buildings Except Low-Rise Residential Buildings. American Society of Heating, Refrigerating, and Air-Conditioning Engineers, Atlanta, GA.
Laboratories for the 21st Century. 2003. Best Practices: Energy Recovery for Ventilation Air in Laboratories. Washington, D.C.: U.S. Department of Energy Federal Energy Management Program and U.S. Environmental Protection Agency. DOE/GO-102003-1774. Available on the Web at www.labs21century.gov/pdf/bp_recovery_508.pdf.
Laboratories for the 21st Century. 2003. Case Studies: Donald Bren Hall, Santa Barbara, California. Washington, D.C.: U.S. Department of Energy Federal Energy
Management Program and U.S. Environmental Protection Agency. DOE/GO-102003-1774. Available on the Web at www.labs21century.gov/pdf/cs_bren_508.pdf.
Lunneberg, Thomas. 1998. “High-Efficiency Laboratory Ventilation: Benefits and Opportunities.” E Source Tech Update, March.
U.S. Green Building Council. 2002. “LEED Green Building Rating System Version 2.1” See www.usgbc.org/ LEED/publications.asp#LEEDRS21.
Acknowledgments
The following individuals contributed to the prepara-tion and publicaprepara-tion of this guide to low-pressure-drop design:
Authors:
John Weale, P.E., and Peter Rumsey, P.E., Rumsey Engineers
Dale Sartor, P.E., Lawrence Berkeley National Laboratory (LBNL)
Lee Eng Lock, Super Symmetry
Reviewers:
Dan Amon, P.E., U.S. Environmental Protection Agency Will Lintner, P.E., U.S. Department of Energy
Nancy Carlisle, A.I.A., National Renewable Energy Laboratory (NREL)
Paul Mathew, Ph.D., LBNL
Scott Moll, P.E., Affiliated Engineers, Inc.
Michael Walsh, P.E., R.G. Vanderweil Engineers, Inc. Otto Van Geet, P.E., NREL
Production:
Paula Pitchford, editor, NREL
Susan Sczepanski, graphic designer, NREL
For More Information
On Low-Pressure-Drop HVAC Systems:
Dale Sartor, P.E.Lawrence Berkeley National Laboratory 510-486-4049
On Laboratories for the 21st Century:
Dan Amon, P.E.U.S. Environmental Protection Agency 202-564-7509
[email protected] Will Lintner, P.E.
U.S. Department of Energy
Federal Energy Management Program 202-586-3120