i
AN EMPIRICAL STUDY OF LIQUIDITY RISK EMBEDDED IN BANKS’ ASSET LIABILITY MISMATCHES
By
GODFREY MAROZVA
Submitted in accordance with the requirements for the degree of
DOCTOR OF PHILOSOPHY
In the subject
Management Studies
UNIVERSITY OF SOUTH AFRICA
Supervisor: Prof Daniel Makina 19 September 2017
ii Abstract
The correct measure and definition of liquidity in finance literature remains an unresolved empirical issue. The main objective of the present study was to develop, validate and test the liquidity mismatch index (LMI) developed by Brunnermeier, Krishnamurthy and Gorton (2012) empirically. Building on the work of these prior studies, the study undertook to develop a measure of liquidity that integrates both market liquidity and funding liquidity within a context of asset liability management. Liquidity mismatch indices were developed and then tested empirically to validate them by regressing them against the known determinants of liquidity. Furthermore, the study investigated the nexus between liquidity and profitability. The unit of analysis was a panel of 12 South African banks over the period 2005–2015.
The study developed two liquidity measures – the bank liquidity mismatch index (BLMI) and the aggregate liquidity mismatch index (ALMI) – whose performances were compared to and contrasted with the Basel III liquidity measures and traditional liquidity measures using a generalised method of moments (GMM) model. Overall, the two constructed liquidity indices performed better than other liquidity measures. Significantly, the ALMI provided a better macro-prudential liquidity measure that can be utilised in dynamic stochastic general equilibrium (DSGE) models, thus presenting a major contribution to the body of knowledge. Unlike the LMI, the BLMI and ALMI can be used to evaluate the liquidity of a given bank under liquidity stress events, which are scaled by theoretically motivated and empirically supported liquidity weights. The constructed BLMI contains information regarding the liquidity risk within the context of asset liability mismatches, and the measure used comprehensive data from bank balance sheets and from financial market measures. The newly developed liquidity measures are based on portfolio management theory as they account for the significance of liquidity spirals. Empirical results show that banks increase their liquidity buffers during times of turmoil as both BLMI and ALMI improved during the period 2007–2009. Subsequently, the improvement in economic performance resulted in a rise in ALMI but a decrease in BLMI. We found no evidence to support the theory that banks, which heavily depend on external funding, end up in serious liquidity problems. The findings imply that any policy implemented with the intention of increasing bank capital is good for bank liquidity since
iii
the financial fragility–crowding-out hypothesis is outweighed by the risk absorption hypothesis because the relationship between capital and bank liquidity is positive.
Keywords: Liquidity mismatch index, bank liquidity, liquidity risk, measures of liquidity, global financial crisis, systemic risk, market liquidity, funding liquidity.
iv ACKNOWLEDGEMENTS
Firstly, I would want to thank God for His undeserved love and wisdom.
My special thanks go to my promoter, Professor Daniel Makina, for unwavering support, valuable guidance, comments and support throughout this doctoral programme.
I am also thankful for the comments I got from participants of the 14th African Finance
Journal Conference held on the 17–18 May 2017.
Furthermore, I am grateful to Professors AQQ Aboagye, J Chisasa, A Mutezo, and Dr S Dzomira, for providing useful comments on this research during the masters and doctoral research colloquial held on the 12th of September 2014.
Special mention goes to my wife, Rudo and my children, Tawananyasha Godfrey, Abigail Tadiswanashe and Reuel Joseph TavoingaIshe, my brothers Ronald, Shadreck Polite Mashanda and my brother and sister-in-law Johnstone Maravanyika and Immaculate Chibango for enduring my absence during this fruitful process.
To my parents Kefasi and Alice Marozva, I thank you for all the sacrifices that you have made for me. You showed me what love is ever since I was young as you were there for me and fought my battles as your own. I dedicate this study to you, my parents, for their unwavering loving persona as a sign of my unfading gratitude. Outside Christ and my wife, I cannot compare you to anything in this dimension. You really project perfect love to me.
Finally, my gratitude goes to Jackie Viljoen, for providing editorial assistance. The responsibility for any other errors rests with me.
v DECLARATION
I, Godfrey Marozva, do hereby certify that this thesis, which is submitted to the University of South Africa, is my own work and all sources that I have used or quoted have been indicated and acknowledged by means of complete references.
vi TABLE OF CONTENTS Title page ... i Abstract ...ii Aknowledgements ... iii Decleration ...iv
List of tables ...ix
List of figures ... x
List of appendices ...xi
List of acronyms and abbreviations ... xii
CHAPTER 1: INTRODUCTION, RESEARCH PROBLEM AND OBJECTIVES ... 1
1.1 Introduction and background ... 1
1.2 Research problem ... 4
1.3 Aim and objectives of the study ... 6
1.4 Exegesis of banking and liquidity in South Africa ... 9
1.5 Structure of the thesis ... 12
CHAPTER 2: BANK LIQUIDITY: THEORY AND EMPIRICAL ISSUES ... 15
2 INTRODUCTION ... 15
2.1 Definition and types of liquidity ... 15
2.2 Liquidity, systemic risk and 2007–2009 global final crisis ... 16
2.3 Theory of bank liquidity ... 20
2.3.1 A neoclassical model of the banking firm and the separation theorem ... 20
2.3.2 Demand for money theory and liquidity preference theory ... 26
2.3.3 The portfolio management theory ... 30
2.3.4 Moral hazard incentives ... 33
2.3.5 Financial frictions and the business cycle ... 34
2.3.6 Liquid assets as a residual: the role of supply and demand ... 36
2.3.7 Liquid assets and liabilities: the role of market imperfections ... 37
2.3.8 The ladder approach ... 39
2.3.9 The risk absorption hypothesis and the financial fragility/crowding-out hypothesis ... 40
vii
2.4 Chapter summary ... 40
CHAPTER 3: MARKET LIQUIDITY, FUNDING LIQUIDITY AND LIQUIDITY SPIRALS 41 3 INTRODUCTION ... 41
3.1 Market liquidity ... 41
3.1.1 Definition of market liquidity ... 42
3.1.2 Theory of market liquidity ... 44
3.1.3 Measurements of market liquidity ... 50
3.1.4 Determinants of market liquidity ... 55
3.1.5 Conclusion on market liquidity ... 59
3.2 Funding liquidity ... 59
3.2.1 Definition of funding liquidity ... 60
3.2.2 Measurements of funding liquidity ... 61
3.2.3 Theory of funding liquidity ... 64
3.2.4 Determinants of funding liquidity ... 70
3.2.5 Conclusion on funding liquidity ... 75
3.3 Liquidity spirals ... 76
3.4 Chapter summary and conclusion ... 84
CHAPTER 4: HYPOTHESIS DEVELOPMENT ... 85
4 INTRODUCTION ... 85
4.1 Hypotheses ... 85
4.2 Chapter summary ... 99
CHAPTER 5. RESEARCH METHODOLOGY ... ERROR! BOOKMARK NOT DEFINED. 5.1 INTRODUCTION ... 100
5.2 Research paradigm and design... 100
5.2.1 Data and variables ... 102
5.2.2 Liquidity coverage ratio (LCR) ... 106
5.2.3 Net stable funding ratio (NSFR) ... 107
5.2.4 Liquidity mismatch index (LMI) ... 108
5.3.5 Micro- and macro-economic independent variables ... 114
5.4 Econometric model specification ... 121
viii
5.5 Chapter summary and conclusion ... 125
CHAPTER 6: DATA ANALYSIS AND DISCUSSION ... 127
6.1 INTRODUCTION ... 127
6.2 Data and descriptive statistics ... 128
6.2.1 Data ... 128
6.2.2 Descriptive statistics for the annual panel data ... 128
6.3 Construction of the MLMI ... 133
6.3.1 Composition of the BLMI and the ALMI ... 134
6.4 Econometric model estimation results, discussion and analysis ... 141
6.5 Summary of results ... 163
6.6 Bank profitability and MLMI ... 164
6.7 Chapter summary ... 170
CHAPTER 7 SUMMARY, CONCLUSIONS AND RECOMMENDATIONS FOR FUTURE RESEARCH ... 171
7.1 INTRODUCTION ... 171
7.2 The theoretical framework of the modified liquidity mismatch index ... 171
7.3 Summary of results ... 174
7.4 Contribution of the study ... 178
7.5 Limitations of the study and recommendations for future research ... 182
Bibliography ... 183
ix LIST OF TABLES
Table 2.1: Simplified bank balance sheet ... 19
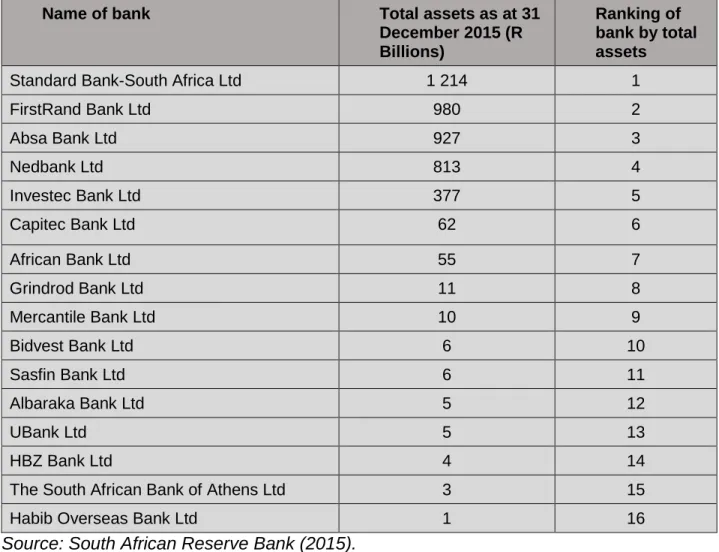
Table 5.1: List if South African registered banks ... 102
Table 5.2: Liquidity measures (dependent variables) ... 103
Table 5.3: Summary of independent variables and proxies ... 114
Table 6.1: Summary statistics for liquidity variables ... 127
Table 6.2: Summary statistics for independent variables ... 130
Table 6.3: Assets category and the allocated coefficient. ... 136
Table 6.4 Liability category and the all allocated coefficient ... 139
Table 6.5: Summary of results on the liquidity measures and the lagged dependent variable ... 141
Table 6.6: Summary of results on the liquidity measures and capital ratio ... 142
Table 6.7: Summary of results on the liquidity measures and deposits ... 145
Table 6.8: Summary of results on the liquidity measures and bank size ... 147
Table 6.9: Summary of results on the liquidity measures and loan growth... 149
Table 6.10: Summary of results on the liquidity measures and external funding dependence ... 151
Table 6.11: Summary of results on the liquidity measures and GDP ... 153
Table 6.12: Summary of results on the liquidity measures and inter-bank interest rates ... 155
Table 6.13: Summary of results on the liquidity measures and return on assets ... 157
Table 6.14: Summary of results on the liquidity measures and 2007–2009 financial crisis ... 159
Table 6.15: Dynamic panel-data estimations: ROA and BLMI ... 163
Table 6.16: Diagnostic statistics: ROA and BLMI ... 164
Table 6.17: Dynamic panel data estimations: ROA and ALMI ... 165
x LIST OF FIGURES
Figure 1.1 Total assets and liabilities ... 9
Figure 1.2 Liquid assets ... 10
Figure 2.1 Optimal loans or deposit volume ... 21
Figure 3.1 Stylised time line ... 67
Figure 3.2 Liquidity spirals ... 79
Figure 3.3: Liquidity spirals II ... 80
Figure 6.1: The calculated asset weight ... 135
xi LIST OF APPENDICES
Appendix 1 Dynamic panel-data estimations on the determinants of L1 liquidity measure ... 226 Appendix 2 Diagnostic statistics- determinants of L1 liquidity measure ... 227 Appendix 3 Dynamic panel-data estimations on the determinants of L2 liquidity measure
... 228 Appendix 4 Diagnostic statistics- determinants of L2 liquidity measure ... 229 Appendix 5 Dynamic panel-data estimations on the determinants of L3 liquidity measure
... 230 Appendix 6 Diagnostic statistics- determinants of L3 liquidity measure ... 231 Appendix 7 Dynamic panel-data estimations on the determinants of L4 liquidity measure
... 232 Appendix 8 Diagnostic statistics- determinants of L4 liquidity measure ... 233 Appendix 9 Dynamic panel-data estimations on the determinants of LCR liquidity
measure ... 234 Appendix 10 Diagnostic statistics- determinants of LCR liquidity measure ... 235 Appendix 11 Dynamic panel-data estimations on the determinants of NSFR liquidity
measure ... 236 Appendix 12 Diagnostic statistics- determinants of NSFR liquidity measure ... 237 Appendix 13 Dynamic panel-data estimations on the determinants of BLMI liquidity
measure ... 238 Appendix 14 Diagnostic statistics- determinants of BLMI liquidity measure ... 239 Appendix 15 Dynamic panel-data estimations on the determinants of ALMI liquidity
measure ... 240 Appendix 16 Diagnostic statistics- determinants of ALMI liquidity measure ... 241 Appendix 17 BLMI and ALMI computations ... 242
xii ACRONYMS AND ABBREVIATIONS
ALM asset liability management
ALMI aggregate liquidity mismatch index
BCBS Basel Committee on Banking Supervision BIS Bank for International Settlements
BLMI bank liquidity mismatch index BoE Bank of England
CAPM capital asset pricing model CEO chief executive officer CPI consumer price index CR capital ratio
DSGE dynamic stochastic general equilibrium ECB European Central Bank
EFD external funding deposit EP economic profits
FC fixed costs
FE fixed effects
FEM fixed effects model FSB Financial Services Board GDP gross domestic product
GMM Generalised method of moments HQLA high-quality liquid assets
IBR interbank rate
IFS International Financial Statistics ILR interbank lending rate
xiii IMF International Monetary Fund LCR liquidity coverage ratio
LG loan growth
LIX liquidity index
LMI liquidity mismatch index LSDV least square dummy variable MLMI modified liquidity mismatch index NLD net liquidity demand
NPL non-performing loans NSFR net stable funding ratio OMO open market operations RE random effects
REM random effects model ROA return on assets ROE return on equity
SABOR South African benchmark overnight rate SARB South African Reserve Bank
SD standard deviation
SLRI systemic liquidity risk index STBS SABOR–Treasury bill spread STR smooth transition regression TBill treasury bill
1
CHAPTER 1: INTRODUCTION, RESEARCH PROBLEM AND OBJECTIVES 1.1 Introduction and background
The 2007–2009 global financial crisis confirmed the need for effective systemic risk measurement and regulation (Andrievskaya, 2012). The turmoil revealed that if prices are pushed away from their fundamental values due to some temporary liquidity problems, they do not necessarily correct immediately. This demonstrated the need to rethink the role of liquidity risk in financial models since the traditional models have proved to be inadequate. Indeed, classic financial market theories (such as capital asset pricing model and Black–Scholes model) were created on the basis of frictionless markets. However, this assumption seems not to be consistent in all markets and different market conditions (Cetin, Jarrow, & Protter, 2004). Hence, market frictions, the absence of the price-taking assumption and competitive markets are the norm rather than the exception. This has been the status quo over the past six decades since Markowitz’s (1952) seminal article on portfolio selection. Financial theories and models assume markets are frictionless; thus, in traditional asset pricing models, liquidity plays no role at all because it is assumed away. The assumption of frictionless markets and perfectly efficient markets is not practical and is an oversimplification of reality (Grossman, 1976; Grossman & Stiglitz, 1980; Malkiel, 1999).
The literature on liquidity and asset pricing instead argues that liquidity is indeed priced and contains both theoretical models and empirical findings detailing how the liquidity of an asset affects expected returns (Amihud & Mendelson, 1986; Pástor & Stambaugh, 2003). However, much of this literature utilises an assets-only approach and is focused on equities, a relatively liquid asset class (Adler, 2014). Other scholars such as Chordia, Roll, and Subrahmanyam (2001), and Bekaert, Harvey, and Lundblad (2003) report that liquidity co-moves with returns and therefore can forecast future returns.
Since the financial crisis, illiquidity and other financial frictions have become critical to financial markets and the overall economy (Brunnermeier, Gorton, & Krishnamurthy, 2012; Bai, Krishnamurthy, & Weymuller, 2013; Drehmann & Nikolaou, 2013). Adler (2012) observes that the little academic literature and few models on the financial fragility and the possibility of a liquidity crisis were developed years before the actual global financial
2
crisis. The Adler (2014) further observes that most of the studies on liquidity are conceptual and lack testable predictions, and others have strong empirical results, but lack developed theory. The traditional measures of liquidity are believed to be basic and inadequate and they do not provide relevant information about the financial sector and its linkages to the real economy (Brunnermeier, Gorton, & Krishnamurthy, 2012). The current study undertook to develop, validate and test the liquidity mismatch index (LMI) developed by Brunnermeier, Gorton and Krishnamurthy, (2012). The liquidity mismatch indices in form of bank liquidity mismatch index (BLMI) and aggregate liquidity mismatch index (ALMI) were developed and were contrasted with the Basel III liquidity measures and traditional liquidity measures.
Furthermore, Brunnermeier at al. (2012) and Adler (2012) indicate that liquidity is not properly defined and neither is there a proper measure of liquidity. The aim of the present research was to provide some insights into the measurement of liquidity risk in the context of asset–liability management (ALM) in an attempt to offer some rationality on the bank’s optimal liquidity requirement, adding to what Bai et al. (2013) and Stein (2013) have already done.
The ALM has its beginnings in the duration analysis proposed by Macaulay (1938). Duration analysis involves profiling the maturity of bonds as the present value of payments to be received. The payments consist of both the face value and the coupon payments. Therefore, this theory could be used to analyse both funding and asset liquidity depending on the position of the bank. In recent years, ALM has become a tool of integrated analysis of assets and liabilities to value not only the interest rate risk but the solvency risk, firm strategies and asset allocation liquidity risk as well (Giandomenico, 2011). Viewing liquidity risk in the light of asset–liability mismatches is of vital importance since each asset and each liability contribute to the liquidity position of the bank (Bai et al., 2013). An earlier study by Brunnermeier (2008) laid the foundation to the understanding of systemic risk and liquidity spillover effects. Brunnermeier (2012) gave one basis for modelling the key response indicator of the spillover effects, the liquidity mismatch index (LMI).
3
Many measurements of liquidity risk are discussed in literature (e.g. by Ahmed, Ahmed, & Naqvi, 2011; Horvàth, Seidler, & Weill, 2012; Vodová 2013a). The present research builds on the measurement proposed by Brunnermeier et al. (2012b), the LMI. The measurement captures the most important attributes of bank liquidity, namely the overall funding liquidity and the market liquidity of its assets. Brunnermeier, Gorton, and Krishnamurthy (2013) observe that it is not the level of gearing that is important, but rather the proportion of debt comprising short-term demandable deposits. Thus, as banks hold illiquid assets financed by short-term debt, which if bank-run behaviour emerges, may in turn result in increased systemic risk. Since the standard measures, such as leverage, are unable to pick up these aspects of liquidity in a bank environment precisely, it is imperative for us to model a liquidity measure that will incorporate information from both the asset side of the balance sheet and the liability side, funding liquidity and market liquidity.
The pioneering work by Berger and Bouwman (2009) on LMI incorporates an important aspect of time-varying liquidity weights, as the variation of these liquidity weights is important in capturing liquidity stress during a financial crisis (Bai et al., 2013). Although Bai et al. (2013) propose a new way of measuring liquidity weights taking into consideration the repurchase agreements on the asset side and looking at maturity and contract contingency on the liability side, the present research tested their methodology further empirically using a different data set.
Since measurement is the essence of science, Brunnermeier, Gorton, and Krishnamurthy (2011) point out that measurement forms the basis of macro-prudential regulation and of the risk management systems of organisations. Finding a correct measure of liquidity risk will help to oversee the build-up of systemic risk (Brunnermeier, Gorton, & Krishnamurthy, 2013). The measurement of liquidity risk and systemic risk has of late attracted the interest of academic researchers, financial market analysts, bank management and bank monitors.
In finance and economic literature, liquidity is not clearly defined. Liquidity has been viewed in different contexts that relate to a number of transactional properties of the markets and its measurement has included direct trading costs, such as quoted or
4
effective bid–ask spreads, and indirect trading costs, such as price impact of trades (Loebnitz, 2006). We now have a new breed of researchers who have a different opinion on the definitions of liquidity (see Ippolito, Peydró, Polo, & Sette, 2016; Krishnamurthy, Bai, & Weymuller, 2016). They find the existing definitions limiting since these do not capture the multidimensional aspects of liquidity risk (Drehmann & Nikolaou, 2013). Most financial institutions are heavily geared. Thus, when they trade, they buy securities and use the same securities as collateral when they borrow. The difference between the security price and the collateral value must be financed by the traders’ own capital. When we look at liquidity from the perspective of the asset and liability, then it becomes a complex phenomenon that should be considered from two angles: the ease with which an asset is traded (market liquidity) affects and is affected by the ease with which traders can obtain funds (funding liquidity) (Drehmann, & Nikolaou, 2013).
1.2 Research problem
The 2007-2009 global financial crisis has underscored the significance of comprehensive bank liquidity management. In response, the Basel III framework, released in December 2010, proposed new liquidity standards for banks with the aim of making the financial system more stable and resilient (Basel Committee on Banking Supervision, 2010b). There is much literature (e.g. Berger & Bouwman, 2009; Acharya & Schnabl, 2010; Ivashina & Scharfstein, 2010) that attests to the fact that liquidity played a central role in the dynamics of the 2007–2009 global financial crisis. Brunnermeier et al. (2012b) note that the recent global financial crisis showed similarities with the recession of the 1930s when relevant information about the financial sector and its nexus to the economy was missing (see Benmelech, Frydman, & Papanikolaou, 2017).
The standard macro-economic models, such as the dynamic stochastic general equilibrium (DSGE) models (see Miao, Wang, & Xu, 2015), assume away financial frictions (Adler, 2012). In addition, the DSGE models have no special role for the financial sector. These models are also based on representative agents who are assumed to invest directly and not through financial intermediaries. The standard models were unable to predict the extent to which the financial sector played a central role in the financial crisis (Rajan, Seru, & Vig, 2015). The models even failed to predict how the real economy was
5
to be affected. According to Brunnermeier et al. (2012b), the problem could be that macro-economic frame and build models based on available data, while in finance we lack the much-needed data to build macro-finance models.
There are other general equilibrium macro models that attempted to account for financial frictions, such as those by Bernanke and Gertler (1989), Kiyotaki and Moore (1997), Bernanke, Gertler, and Gilchrist (1999), and Geanakoplos (2003). These authors only show how a small shock could be magnified into persistent fluctuations in the larger economy through the financial accelerator. Although this literature forms the basis of liquidity spirals, systemic and endogenous risk financial intermediaries are still not amenable to general equilibrium models.
Moreover, the systemic liquidity measure remains ambiguous and further research is required. Brunnermeier and Oehmke (2012) admit that the systemic liquidity measures proposed so far are not very useful since they cannot be estimated empirically. They contend that for risk measures to be useful, the inputs into the risk measure must be measurable in a timely fashion, which has so far proved to be challenging. Bai et al. (2013) also acknowledge the limitations of their LMI measure as they admit to ‘thumb sucking’ regarding the liquidity weights used in the computation of the LMI. This alone can justify the need for further research as liquidity weights play a crucial role in the dynamics of the LMI. Bai et al. (2013) further indicate the need for more empirical work to improve the liquidity weights and hence the liquidity measure.
Given that academic liquidity literature developed several models of financial fragility and liquidity before the actual crisis (see Treynor, 1961; Sharpe, 1964; Cohen, Black, & Scholes, 1972; Fama, & French, 1996;), the present research investigated the unsettled debate of the correct definition and measure of liquidity further (Brunnermeier et al., 2013). In line with more recent macro-friction models that give financial intermediaries a central role, the present research attempted to analyse and test the new measure of liquidity empirically. Very few studies have looked at the measure of liquidity risk in the context of asset and liability mismatches (see Brunnermeier et al., 2012a; Berger, & Bouwman, 2017) and so far, there is no study of which is known, which comprehensively and adequately tested the LMI empirically.
6
The liquidity measures that were tested in the present study allowed us to assess the interactions of market liquidity and funding liquidity risk in the context of asset and liabilities mismatches. This has been investigated theoretically by Bai, Krishnamurthy, and Weymuller (2014), Stein (2013), Brunnermeier and Pedersen (2009), whose outcomes were persuasive. Since the footprints of the nexus between funding liquidity and market liquidity are clear in the recent financial crisis (see Lou & Sadka, 2011; Berrospide, 2013), there is need for empirical testing of the measures proposed. Drehmann and Nikolaou (2013) show that there are strong negative interrelationships between funding liquidity risk and a measure for market liquidity. This is an indication that market liquidity is dependent on funding liquidity where higher funding liquidity risk implies lower market liquidity. However, a single measure that shows the interaction between the liquidity conditions is still lacking, perhaps because we lack a universally accepted definition of these variables.
The present study developed, validated and tested the liquidity mismatch index (LMI) developed by Brunnermeier, Krishnamurthy and Gorton (2012) empirically. Building on the work of these prior studies, the study undertook to develop a measure of liquidity that integrates both market liquidity and funding liquidity within a context of asset liability management. Liquidity mismatch indices were developed and then tested empirically to validate them by regressing them against the known determinants of liquidity.
Unlike other liquidity measures, the BLMI and the ALMI can be used to evaluate a bank’s liquidity condition as well as market wide liquidity respectively under liquidity stress events. The new liquidity indices were scaled by theoretically motivated and empirically supported elasticities.
1.3 Objectives of the study
Although some new liquidity measures have been proposed, there is still no clear-cut measure and definition of liquidity that can be used to provide a macro-prudential liquidity parameter. This fact is recognised by many researchers (for example Brunnermeier & Oehmke, 2012; Drehmann & Nikolaou, 2013; Bai et al., 2014) as they mention the obscurity in the new field of liquidity. However, discussions in this thesis show that
7
quantification of liquidity has been hindered by the lack of appropriate data, rather than by model considerations. The focus of this research was on both funding liquidity and market liquidity, since the easier one can trade a security the easier it is to get funds to trade securities. Ideally, market liquidity and funding liquidity are complementary. Most articles (see Diamond & Dybvig, 1983; Gorton & Pennacchi, 1990; Berger & Bouwman, 2009) were written on the sources of liquidity risk and on how markets should be designed and regulated to cope with the effects of illiquidity.
There is thus a need for the appropriate measure of liquidity, which is based on empirical studies that can form part of the risk management systems of financial institutions and also inform macro-economic policies accordingly. Failure to do so would leave most financial institutions exposed to significant systemic risk. This study attempted to integrate the concept of market liquidity into the broader framework of funding liquidity. It was necessary to do this research because of late, central banks have recognised that existing measurement systems are inadequate and have begun to think about revisions and additions (Eichner, Kohn, & Palumbo, 2013).
The broad aim of this study was to investigate empirically the liquidity risk embedded in asset–liability mismatches by banks. The global financial crisis of 2007–2009 prompted banks to realise the significance of liquidity risk management. Although liquidity risk may cause bank failures, Davis (2008) indicates that banks can protect themselves against liquidity risk. On the asset side, banks can hold a significant proportion of liquid assets. Banks can use cash immediately to settle current obligations or liquidity needs, while high-quality assets, e.g. treasury bills and government bonds, can be used readily as collateral when the banks borrow. On the liability side, banks need to have diverse sources of finance to minimise the effect of liquidity risk. Inasmuch as a bank can dispose of its current assets to obtain cash, just having a significant portion of current assets reduces the liquidity risk of a bank.
An understanding of liquidity risk is achieved through examination of determinants of liquidity. The determinants of liquidity are tested on how and to what extent they influence Basel III liquidity measures, other traditional liquidity measures and the new liquidity measure (the modified liquidity mismatch index). In an analysis of the modified LMI, the
8
Basel III liquidity measures and selected traditional liquidity measures are done at both bank-specific level and at macro level. This is done in a bid to compare and contrast the newly constructed bank liquidity mismatch index (BLMI) and the aggregate liquidity mismatch index (ALMI) with traditional measures of liquidity and Basel III measures of liquidity.
The LMI indices used in this study were modified ones based on the LMI measurement proposed by Brunnermeier, Krishnamurthy, and Gorton (2012). This measurement captures the most important attributes of bank liquidity that include the overall funding liquidity and the market liquidity of its assets. Brunnermeier et al. (2013) observe that it is not the level of gearing that is important, but rather the proportion of debt comprising term demandable deposits. Thus, as banks hold illiquid assets financed by short-term debt, which if a bank-run behaviour emerges, may in turn result in increased systemic risk. Since the standard and traditional measures of liquidity, such as leverage, are unable to pick up these aspects of liquidity in a bank environment precisely it was imperative for this study to model a liquidity measure that incorporated information from both the asset side of the balance sheet and the liability side, i.e. the market liquidity and funding liquidity respectively.
Most empirical studies so far investigated market liquidity and funding liquidity separately. It is only recently that researchers started paying attention to asset–liability mismatches and they are trying to build models that can capture this important aspect. Liquidity standard measures failed to capture banking sector important characteristic of liquidity spirals (Bai et al., 2013; Berger & Bouwman, 2009). The empirical findings of this study highlight the determinants of liquidity and the importance of measuring bank liquidity in the context of asset–liability mismatches. Policy implications for selected banks and the South African economy are drawn. Additionally, banks should revisit their liquidity measures and customise them to capture liquidity spirals and this will inevitably improve their liquidity risk management models.
Specifically, this study therefore wished to:
9
examine the key determinants of the modified liquidity mismatch indices in selected South African banks;
examine the determinants of Basel III liquidity measures and other standard traditional liquidity measures; and
analyse the BLMI and ALMI as determinants of bank performance. 1.4 Exegesis of banking and liquidity in South Africa
The South African banking system has developed significantly in terms of the regulatory system and technological advancement. However, Kumbirai and Webb (2010) argue that the banking sector in South African suffered from increased regulatory, competition and technology related costs. The sector also witnessed a huge influx of foreign banks since the country attained democracy in 1994. The dynamics in the banking sector underscored bank performance especially during and after the global financial crisis of 2007–2009. There is a plethora of studies (see Oberholzer & Van der Westhuizen, 2004; Okeahalam, 2006; Erasmus & Makina, 2014) on bank performance and efficiency in South Africa. However, very few studies (e.g. Visser, 2013; Visser & Van Vuuren, 2014) investigated the pertinent issue of bank liquidity in South Africa. However, Visser and Van Vuuren (2014) built liquidity stress testing model but did not examine the main determinants of liquidity risk. Moreover, their model was not tested within a context of other liquidity stress testing measures like the net stable funding ratio (NSFR) and the liquidity coverage ratio (LCR). Figure 1.1 show how the aggregate assets and liabilities of South African banks grew over the years.
10
Figure 1.1: Total assets and liabilities Source: Author’s computation
Data source: SARB – Banks BA900 Returns
https://www.resbank.co.za/RegulationAndSupervision/BankSupervision/Banking%20sec tor%20data/Pages/Banks-BA900-Returns.aspx
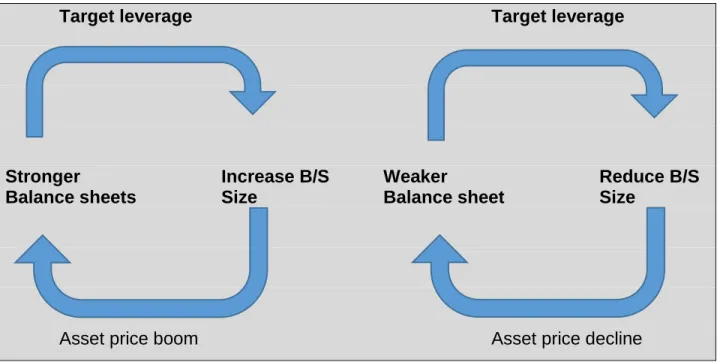
There was a general increase in assets and liabilities over the period. Total assets increased by 333% over the period from 2005 to 2016, which is on average 30.27% increase per annum. While, total liabilities increased by 320% over the same period, which is on average 29% increase per annum. However, some developments during the crisis resulted in a highly volatile asset base and a slight decrease of 3.23% in the value of assets. Liquidity spirals could best explain this fall in the value of assets. Brunnermeier and Oehmke (2012) argue that during crisis, first, there was a loss of spiral that was triggered by the decrease in asset prices, which led to forced selling resulting in the erosion of capital. The second liquidity spiral was the margin spiral, which mainly pertained to the liability side of the balance sheet. From Figure 1.1, it is clear that liabilities continued with the upward trend even during periods of economic recession. The increase in liabilities during the crisis is an indication that some of the banks could have failed to
0 1000 2000 3000 4000 5000 6000 To ta l a ss ets / To ta l l ia b ili ti es Period (Years)
Total assets and liabilities
Total assets Total deposit liabilities R Billions
11
honour their obligations and rolled over their liabilities. Liquidity spirals could explain this. As volatility increased, margins and haircuts increased, thereby increasing bank liabilities. The global financial crisis of 2007–2009 was synonymous with a liquidity crisis. Liquidity plays a central role in the operations of a financial institution. A shortage of liquidity causes havoc in the overall economy. López-Espinosa, Moreno, Rubia, and Valderrama (2012) note that short-term funding (funding liquidity) is the most important determinant of the contribution of a bank to global systemic risk. Liquidity risk in South Africa deserves greater scrutiny. The present study was motivated by the fact that the recent crisis did not spare the South African economy, as the crisis induced the economic slowdown in 2009 (Baxter, 2008). The South African economy slowed down in the fourth quarter of 2008 and officially entered into a recession in the first quarter of 2009 (Baxter, 2008). Figure 1.2 shows the development of bank liquidity over the period of the study.
Figure 1.2: Liquid assets (R million) Source: Author’s computation
Data source: SARB – Banks BA900 Returns
https://www.resbank.co.za/RegulationAndSupervision/BankSupervision/Banking%20sec tor%20data/Pages/Banks-BA900-Returns.aspx 0 500 1000 1500 2000 2500 3000 3500 4000 Mar ch -05 Mar ch -06 Mar ch -07 Mar ch -08 Mar ch -09 Mar ch -10 Mar ch -11 Mar ch -12 Mar ch -13 Mar ch -14 Mar ch -15 Mar ch -16 To tal b an ks' li q u id ity assets Period (Months)
Total banks' Liquid assets
12
Focusing on the period under investigation, Figure 1.2 shows that South African banks on aggregate increased their liquid assets from 2005 until the end of 2008. In 2009, we witnessed a decrease in liquid asset holdings by banks due to the adverse effects of the global financial crisis. In response to the liquidity crisis, banks in South Africa began to hold considerable liquid assets as exhibited by an increase in liquid assets by the end of 2010. Marozva (2012) indicates that, in periods of turmoil, the strength and resilience of the banking sector should be measured in terms of how liquid the bank is, instead of its balance sheet or profitability.
During periods of economic stability, banks could afford to profit significantly from asset– liability mismatches. Banks increased their loan portfolios during calm times which changed during the recent financial crisis (Barua, Battaglia, Jagannathan, Mendis, & Onorato, 2010). During the financial crisis, the need for liquidity became fundamentally inherent to the financial sector. The Basel lll framework, also calls for significant changes in liquidity requirements. The framework introduced more stringent liquidity requirements, which are being phased in over a number of years. Despite the introduction of the net stable funding ratio (NSFR) and the liquidity coverage ratio (LCR), banks consider it wise to maintain higher-than-recommended liquid asset buffers in their possession. What motivates banks to hold higher buffers than the required liquidity buffers, warrants further investigation.
1.5 Structure of the thesis
Chapter 1: Background and introduction
Chapter 1 gives an introductory background to the research study. The objectives, outputs and benefits of the study were discussed, and the structure of the rest of the thesis was summarised.
Chapter 2: Bank liquidity: Theories and empirical issues
This chapter clarifies the relevant terms and concepts including the delimitation of the topic. General operations of a commercial bank in the context of asset–liability management (ALM) are discussed. In the greater portion of the chapter discusses the theoretical issues and empirical evidence of bank liquidity in general. It was found out that
13
banks have diverse reasons to hold a significant proportion of total assets as liquid assets. Moreover, these factors depend on bank-specific, industry-specific and macro-economic factors.
Chapter 3: Market liquidity, funding liquidity and liquidity spirals
This chapter gives more insight into the composition of bank liquidity since it is split into funding and market liquidity. Theoretical and empirical issues of funding and market liquidity are discussed and unresolved empirical issues were put into context. In the last sections of the chapter, the important issue of liquidity spirals, i.e. the interaction between market liquidity and funding liquidity is highlighted. The main conclusion is that bank liquidity is a multidimensional phenomenon that is inclusive of both market liquidity and funding liquidity.
Chapter 4: The research question and hypothesis development
The research problem is set out as a logical consequence of the debate in Chapters 2 and 3. This research problem as developed into precise measurable hypotheses that were tested empirically, is stated in this chapter. In addition, this section gives more detail of the three main objectives of the study, as it was found that there was need to develop the LMI further and then to validate it empirically by regressing it against known determinants of liquidity. The section also highlights the nexus between liquidity and bank profitability.
Chapter 5: Methodology: research design and econometric methods
This chapter presents the methodologies that are applied in addressing the research objectives and the hypothesis developed. General methodological issues and problems pertaining to this particular research vis-à-vis other similar empirical studies are discussed. The pros and cons of different research designs and econometric methods are discussed for applicability for the study. This process led to the selection of the generalised method of moment (GMM) model as the preferred method for testing hypotheses.
14
Econometric test results of different approaches are presented and analysed. Confounding problems and probable resolutions are discussed. In this chapter, the research techniques discussed in Chapter 5 were employed to empirically test the liquidity measures against their determinants. The constructed liquidity mismatch indices are subsequently tested empirically by regressing them against the bank-specific factors as well as macro-economic factors. Other conventional liquidity measures and Basel III liquidity measures are also tested in a bid to validate the bank liquidity mismatch index (BLMI) and the aggregate liquidity mismatch index (ALMI).
Chapter 7: Summary of conclusions and directions for future research
In this chapter, the findings are summarised through provision of concluding remarks on theoretical and empirical findings of this research. Furthermore, a summary of the contribution of this study to the existing body of knowledge on liquidity risk in light of asset–liability mismatches is provided. Finally, the chapter highlights some shortcomings of this study, and provides directions for future research.
15
CHAPTER 2: BANK LIQUIDITY: THEORY AND EMPIRICAL ISSUES 2 Introduction
This chapter discusses the theoretical evidence and empirical evidence of bank liquidity. Drehmann and Nikolaou (2013) suggest that, as a result of the liquidity crisis of 2007– 2009, illiquidity and other financial frictions have become critical to financial markets and the overall economy. Adler (2012) observes that there are few academic literature and models on the financial fragility. Moreover, Adler (2012) points out that the models designed to predict the possibility of a liquidity crisis were developed years before the actual global liquidity crisis. Similarly, most financial prediction, valuation and pricing models assume away liquidity as markets are deemed to be frictionless. The traditional measures of liquidity are believed to be basic, inadequate and do not provide relevant information about the financial sector and its linkages to the real economy (Brunnermeier et al., 2011; Krishnamurthy, Bai, & Weymuller, 2016).
2.1 Definition and types of liquidity
In this section, the relevant terms and concepts including the delimitation of the topic are clarified. Stange and Kaserer (2009) show that liquidity in general can have different meanings depending on the setup. First, liquidity can mean solvency if it is to be viewed from the perspective of a firm. From the corporate perspective, liquidity measures the ability of a firm to settle its obligations with the existing assets. The ability to fund obligations as they fall due is driven by the liability side and is referred to as funding liquidity (Andrievskaya, 2012). On the other side, the ease with which a firm can liquidate its assets is commonly known as market liquidity in finance literature, but also can be called asset liquidity (Brunnermeier and Pedersen, 2009). Scholars naturally tend to use the term market liquidity to mean assets liquidity or vice versa, though in reality their usage should reflect whether the researcher is focusing on the balance sheet or whether the market is the focus (Fontaine, Garcia, & Gungor, 2015). A focus on the balance sheet requires the use of asset liquidity and a focus on the market requires the use of market liquidity. Secondly, liquidity can mean the marketability of a financial instrument from an investor's perspective, thus partially indicating the ease of trading a particular financial instrument. Lastly, liquidity can be viewed in line with the macro-economy that is a
16
monetary perspective where M1, M2 and M3 can be used to measure different degrees of liquidity in an economy. This study focused mainly on two types of liquidity: market liquidity and funding liquidity.
Liquidity, although not a new phenomenon in finance literature, has no universally accepted definition. Adler (2012) asserts that the lack of an agreed-upon definition emanates from the fact that the concept of liquidity arises from different economic perspectives. Liquidity can be defined in the context of how easily a security can be traded and in the context of how easily one can obtain funding to trade a security. Therefore, the focus of this research will be on both the funding liquidity and market liquidity, since the easier the security can be traded means the easier it is to get funds to trade securities, thus market liquidity and funding liquidity are complementary. Most research (e.g. Diamond & Dybvig, 1983; Gorton & Pennacchi, 1990; Berger & Bouwman, 2009) was done on the sources of liquidity risk and on how markets should be designed and regulated to cope with the effects of illiquidity.
Brunnermeier and Pedersen (2009) also indicate that liquidity is a multidimensional phenomenon that is comprised of mainly two elements: funding liquidity and market liquidity. Brunnermeier and Pedersen (2009) further provide a model that links the funding liquidity (i.e., the ease with which financial institutions can obtain funding) and the market (i.e. the easy at which a financial asset is traded). Therefore, financial market players (e.g. dealers, traders and finance houses) provide market liquidity, and their ability to provide liquidity depends on the availability of funding. A more detailed literature review on funding and market liquidity is done in Chapter 3. The next section discusses issues surrounding bank liquidity in general, systemic risk and the global financial crises of 2007– 2009.
2.2 Liquidity, systemic risk and 2007–2009 global final crisis
According to the International Monetary Fund (IMF), the Bank for International Settlements (BIS) and the Financial Stability Board (FSB) (2009), systemic risk is described as “the risk of disruption to financial services that results from impairment of all or part of the financial system and that has a potential to have negative consequences to the real economy”. Liquidity is certainly one of the main drivers of systemic risk as Adler
17
(2012) indicates, although systemic risk is much broader than liquidity risk. The drying up of liquidity is a key aspect of market-wide contagion. Though liquidity is the basis of systemic risk, measuring the threat of systemic risk is a challenge. Before the crisis, financial risk measures such as value at risk (VaR) were used, but they had limitations in the sense that risk was not measured in the context of the overall system (Adler, 2012). Instead, the measure was isolated within an individual institution. Therefore, these measures did not capture the instability of the financial system that resulted from failures of individual financial institutions. Ideally, systemic risk should depend primarily on the endogenous response of market participants (Brunnermeier, & Oehmke 2013). Therefore, there is need for adequate micro- and macro-prudential regulations that can account for bank level and market wide liquidity conditions (Krishnamurthy et al., 2016).
Due to the limitation of VaR, there has been a new breed of researchers that have proposed new measures assumed theoretically to capture systemic risks. Brunnermeier, Eisenbach, and Sannikov (2012) and Brunnermeier and Oehmke (2013) identify liquidity as a key response indicator, so that aggregate liquidity measures are important to detect a build-up of systemic risk. Ideally, systemic risk should be measured examining and taking into account the inter-bank market. This confirmed earlier studies by Sheldon and Maurer (1998) who provide an empirical investigation and Iori, Jafarey, and Padilla (2006) who took a theoretical approach. Systemic risk is believed to have resulted in the 2007– 2009 global financial crisis.
The global financial crisis is synonymous with a liquidity crisis. Since liquidity crunch is advocated as the trigger for, as well as the catalyst of, the problem that systemically devastated the global financial sector and eventually led to a global recession during the period from 2007 to 2009. The crisis emphasised the need for effective measurement of liquidity and liquidity risk management. De Haan and Van den End (2013) point out that liquidity problems was a result of drop in confidence of the sustainability of the global financial sector as most institutions were highly geared and had significant maturity mismatches. Financial institutions were heavily exposed to on-balance sheet and off-balance sheet asset and liability maturity mismatches. The exposure has built up for a
18
long period. Banks in United States of America (US) were highly leveraged during a period of low interest rate regime with their main source of funding being repurchase agreements (repos) (Brunnermeier, 2008).
Mishkin (2010) gives a detailed chronological analysis of events that led to the global financial crisis. The financial crisis of 2007 to 2009 is deemed to have been the first phase that involved mainly the US financial system during the period August 2007 to August 2008. The problem emanated from non-performing subprime residential mortgages. Many economists and other finance professionals (e.g. Calem & LaCour-Little, 2004; Purnanandam, 2010) thought it a mild problem that could not end in a crisis. It was after the second phase of the crisis that they revised their forecasts from slow-down to eminent recession. Mishkin (2010) indicates that in mid-September 2008 the financial crisis entered a very critical phase by illustrating how a significant portion of large financial institutions (e.g. Investment Bank of Lehman Brothers, AIG Insurance Company) collapsed. This was the beginning of the crisis. However, the question still remains what triggered this catastrophic event. It was maturity mismatches.
Most of the long-term loans were funded with short-term wholesale deposits and when the wholesale deposits dried up, these led to a substantial increase in maturity mismatches (Acharya & Skeie, 2011). Maturity mismatches are enshrined within the major role of financial intermediation of maturity transformation. Financial intermediaries play the major role of repackaging mostly cheap liquid liabilities into profitable illiquid assets, as described by Diamond and Dybvig (1983). The maturity transformation phenomenon can be viewed as liquidity management since this can be contextualised as a process of obtaining funding (funding liquidity) to trade a security. The ease of converting the assets into cash is referred to as ‘market liquidity’.
According to Brunnermeier (2008), the financial market turmoil that started in 2007 resulted in the worst financial crisis since the Great Depression. This was manifested by the extent to which the real economy was damaged. Brunnermeier (2008) further observes that the main trigger of the crisis emanated from the housing bubble that burst, forcing banks to write down several loans. Concurrently, there was a severe dip in stock prices of many financial institutions.
19
Macro-economic fundamentals played a pivotal role in what led to the housing bubble. The US Federal Reserve adopted a lax interest rate regime in 2005, which led to large capital inflows from abroad especially from European countries (White, 2009). During the same time, the traditional banking model, in which banks would lend money and wait for the repayment of the interest and capital, was replaced by asset securitisation, where loans were pooled into tranches and then resold. This innovation further allowed US financial institutions access to more capital from abroad as securitisation was deemed to stabilise the banking sector by transferring risk to those most able to manage it (Guttmann, 2008). Banks could fund their long-term assets with short-term maturity instruments, a change that exposed banks to a dry-up in funding liquidity. Furthermore, most financial intermediaries gradually moved towards the markets and this dynamic shift created complex risks that were difficult to comprehend (Ahmed, 2009)
Analysing the causes of the financial crisis, Brunnermeier (2008) proposes four important mechanisms through which the mortgage crisis was amplified:
borrowers’ balance sheet effects;
the lending channel;
runs on financial institutions, and
the network effect.
The borrowers’ balance sheet effect is viewed in the context of assets and liabilities resulting in liquidity spirals. Faced with liquidity problems, asset prices will fall and erode the capital of the banks. At the same time, funding of liabilities becomes difficult as borrowing standards tightens. The lending channels will dry up as banks take a cautious stance in case they may want to fulfil some obligations in the future and may fail. Hoarding of funds becomes the order of the day. This will subsequently lead to runs on banks, further worsening the position of the banks, liquidity wise as well as capital wise. During the crisis, the lack of funding liquidity pushed the banks into buffering of liquid assets to protect themselves from maturity and roll-over risks of short-term interbank borrowing. This was done in a bid to minimise the risk of maturity mismatches. Allen and Gale (2007) observe that investors generally prefer assets with shorter maturities which allow them to liquidate their positions at short notice. The network effect arises when the financial
20
institution acts as an intermediary between the surplus units and the deficit units, thereby acting as a lender and a borrower at the same time. Thus, a gridlock can occur when offsetting between trading parties fail as institutions become concerned with counterparty risk. For contingency sake, banks end up holding excess liquidity in case some of their obligations are not netted out.
2.3 Theory of bank liquidity
Before discussing different theories of liquidity, it is important to understand how banks operate within the context of ALM. Banks in general collect deposits from individuals and corporates (surplus units). Some of these deposits may be fixed, while some are withdrawable on demand. Fixed deposits are easy to price, and it is easy to model or measure the liquidity risk, while demand deposits have an undefined maturity which creates specific problems of pricing and measuring liquidity risk. Other sources of funds include subordinated bonds and equity. These are long-term in nature. On the asset side, banks buy fixed assets, hold some reserves at the central bank and advance the surplus as loans to corporates and individuals (deficit units).
The maturities of these assets are grossly different from those of the liabilities. Therefore, the mismatches between the maturities of assets and liabilities can create liquidity risk. Liquidity risk refers to the shortage of cash resulting from both the liabilities and the asset demands. Shortage may originate from unexpected increase in loan demand, a sudden increase in demand deposit withdrawals or margin calls on trading transactions (see Kusy & Ziemba, 1986; Zenios & Ziemba, 2007).
2.3.1 A neoclassical model of the banking firm and the separation theorem
The neoclassical model of the banking firm was developed by Klein (1971) and Monti (1972). Their theory indicates that the asset side of the balance sheet consists of the reserves deposited to the central bank (R), purchased government bonds (B), and loans (L). Whereas the funding side consists of equity (Equity) and deposits (D). The simplified balance sheet is shown in Table 2.1:
21
Table 2.1: Simplified balance sheet
Assets Liabilities and shareholders’ equity
Reserves Loans Bonds
Equity Deposits Source: Zenios and Ziemba (2007)
The required reserves are calculated as a percentage of deposits and yield no interest. The loans are issued at a price p and the demand for them is a decreasing function of the price. Government bonds yield an interest rate b and are considered to be perfectly elastic in a competitive market. Equity is the shareholder contribution whose required return is measured in terms of its opportunity cost, the exogenous government bond. In Klein’s (1971) model, parameters are known with certainty as the maturities of assets and deposits are theoretically assumed to be the same and all operating expenses, although linked to these deposits, are ignored. Banks are assumed to be rational and hence need to maximise economic profits (EP) by choosing low cost deposits and advance them as loans at a margin (Santomero, 1984).
𝐸𝑃 = (𝑝 × 𝐿 + 𝑏 × 𝐵 − 𝑑 × 𝐷) − 𝑏 × 𝐸 2.1
𝑆𝑖𝑛𝑐𝑒: 𝑅 + 𝐿 + 𝐵 = 𝐷 + 𝐸 if we substitute the balance sheet constraint into the objective
function, we end up with the following function:
𝐸𝑃 = [(𝑝 − 𝑏) × 𝐿] + [(𝑏 × (1 − 𝑟) − 𝑑) × 𝐷] 2.2
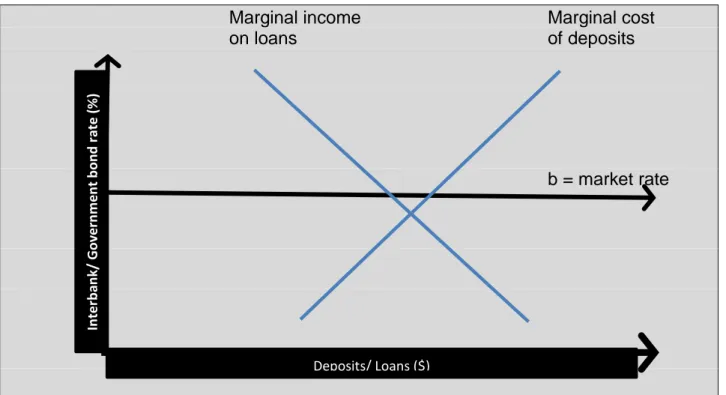
Monti (1972) argues that the end-period economic profit is given by income from loan net opportunity cost (the government bond rate, b), and income on deposits invested in securities with the returns reduced by the central bank’s required reserve ratio, r. This became the basis of separation theorem in banking, which alludes to the fact that loans and deposits should be priced independently, with reference to the market rate (the government bonds or interbank rate) (Keister, & McAndrews, 2009). The first derivatives for deposit and loans were developed as follows:
22 𝜕 𝐸𝑃 𝜕𝑑 = (𝑏 × (1 − 𝑟) − 𝑑) × 𝐷 ′− 𝐷 = 0 2.3 𝜕 𝐸𝑃 𝜕𝑝 = (𝑝 − 𝑏) × 𝐿 ′+ 𝐿 = 0 2.4
Where 𝐷′is the first derivative of D with respect to𝜕 𝐸𝑃𝜕𝑑 and 𝐿′ is the first derivative of L with respect to 𝜕 𝐸𝑃𝜕𝑝 . Taking ŋ𝐷 and ŋ𝐿 to represent interest elasticity and deposit elasticity respectively, the following equation is obtained:
𝑑 = 𝑏 × (1 − 𝑟) × (1 + ŋ𝐷−1)−1, 𝑝 = 𝑏 × (1 + ŋ
𝐿
−1)−1 2.5
The required reserve ratio is set to zero for a comprehensive and graphical illustration of the separation theorem and this is represented in Figure. 2.1. The following graph shows the interaction between the marginal cost of loans and market rate as well as the association between the marginal cost and the market rate.
Marginal income Marginal cost
on loans of deposits
b = market rate
Figure 2.1: Optimal loans or deposit volume Source: Zenios and Ziemba (2007)
Fig 2.1 shows that the optimal volume of deposits is reached when the marginal cost of deposits is equal to the market rate, b. The optimal loan volume is achieved when the
In te rb an k/ G o ve rn m e n t b o n d r ate ( % ) Deposits/ Loans ($)
23
marginal revenue from loans is equal to marginal investment rate, the market rate, b. This clearly proves the separation theorem as funding and lending decisions are done separately. When the difference between the optimal borrowing and lending volumes is positive it is an indication that the bank is a net lender in the market. However, this is not always the case as the bank can sometimes be a net borrower.
This is, however, an over-simplification of reality as the model is based on unrealistic assumptions and more so, the failure of the theory to acknowledge that banks are complex organisations that are engaged in many different types of activities. Banks are involved in deposit taking, underwriting, trading, provision of loans, extension of brokerage services, providing fiduciary services, giving corporate finance advice, offering mutual funds, and the list goes on (Kashyap, Rajan, & Stein, 2002). Besides the obvious limitations of the separation theorem, there were factors that were recognised that destabilised the theory. A joint-revenue function or joint-cost function breaks the equilibrium. This can be a situation where the volume of deposits received is linked to the volume of loans approved.
Due to 2007/9 liquidity crisis, joint maximisation of profits became particularly of paramount importance. Under the separation theory, banks were regarded as insurers. One type of insurance rendered by banks was liquidity insurance, whereby depositors and borrowers were able to withdraw money on demand. Therefore, banks were required to have enough liquidity to cover to their daily payments made on the central bank system. This liquidity, according to Diamond and Dybvig (1983), consists of the required reserves with the central bank, borrowings from other banks, a discount window from the central bank, and expected income flows from other banks. What then determined the liquidity level was based on the nature of assets and the ability of the bank to access cash from the central bank, or alternatively through interbank or money market transactions (Bianchi, & Bigio, 2014). It becomes apparent that one main reason banks exist is to provide liquidity and there is a price for liquidity. Portfolio management theory (see Kusy, & Ziemba,1986).) is one theory that accounts for the significance of liquidity spirals (Brunnermeier & Pedersen, 2009).
24
The confidence of investors in financial markets hinges on the fact that they can always transact at a fair market price as quickly as possible. Liquidity is central to a well-functioning financial system (Acharya & Naqvi, 2012). The growing importance of liquidity management, particularly in the increasingly integrated global market, is emphasised by the sequence of huge bank failures and economic distresses that have been initiated by liquidity risk mismanagement and model failure (Freixas, Parigi, & Rochet, 2000; Rosengren, 2008). This makes liquidity a very important aspect of well-functioning financial markets as investors are allowed to complete their transactions quickly and without significant price movement.
The determinants of liquidity are a debatable issue even though there is a general consensus on certain aspects of liquidity. An asset is considered liquid if it can be traded quickly (speed of transaction) at a low risk (resilience of the market/greater market depth/low price impact/low cost/information is readily available) and has a short maturity (Tsuchida, Watanabe, & Yoshiba, 2016). Examples of liquid assets for banks include cash, the reserves banks hold for contingency purposes other than those required by law, short-term securities (e.g. treasury bills, commercial paper), and inter-bank loans with very short maturity ranging from one day to a year (Tobin, 1982).
According to Cucinelli (2013) and Moussa (2015), the liquid asset level for banks depends on an array of factors including the behaviour of bank managers, aggregate market conditions, bank custodians’ risk preferences, macro-economic events and, even the behaviour of investors in which the bank operates. The determinants of liquidity risk are deemed multi-faceted and driven by the complex factors that define the flow of information. In the banking sector, these factors influence how banks manage liquidity. Therefore, it is essential to determine the factors that influence banks to keep certain levels of liquid assets to determine crucially the optimal stability and efficiency of banks and the financial system as a whole.
Having understood how banks operate in terms of ALM and the importance of liquidity to banks, institutional and individual investors, we can move on to review theories on liquidity. Specifically, the focus is on the theories that provide an understanding of what determines the levels of liquid assets of banks.
25
There are models that show directly or indirectly how banks determine their levels of liquid assets. About five main categories of theories are distinguished and reviewed in this regard. In the first one, the demand for money and the liquidity preference theories that were extensively developed in the 1950s by Baumol (1952), Tobin (1956), and Friedman (1959). In their approach, economic agents primarily demand cash for precautionary, speculative, and transaction purposes. Interest rates are the main determinant for speculative and precautionary motives for holding/demanding cash and there is an inverse relationship. The theory according to Baumol (1952) and Tobin (1956) showed that there are important economies of scale associated with holding significant cash balances. This first approach forms the basis of all the other theories that followed. The second theory to be reviewed is the portfolio management theory developed in the 1950s and 1960s. In the portfolio management approach, the level of liquid assets chosen by a bank is primarily determined by the bank manager’s risk averseness. This is in contrast to the theories that follow which assume that bank managers are risk neutral, and therefore that the level of risk does not matter in the determination of the liquid asset level of banks.
The third category of theories interrogates the determinants of credit supply and deposit demand. This theory has its roots in the 1960s (e.g. Brunner & Meltzer, 1964) and since then this has been the main focal point for the determinants of liquidity in banks. The theory dictates that liquid assets are the residual, between (on the one hand) the equity and liabilities of the bank, and (on the other hand) the loan portfolio (Arestis & Howells, 1999).
The first three categories of theories do not explicitly account for liquidity spirals and the unpredictability of deposit withdrawals and unpaid loans. As previously discussed, liquidity is the main characteristic of a well-functioning financial system. Thus, banks that aim to stay in business wish to keep a good reputation concerning meeting its obligations as they fall due. Consequently, banks may want to keep liquid assets in order to be able to meet the large uncertainty regarding the amount of withdrawals of deposits or the renewal of rolled-over inter-bank loans.