JSSA-SV-002
CHECK LIST OF REFERENCES CAREFULLY
Profiling Disadvantaged Undergraduate Students in Higher
Education
Bhekimpilo Mpofu
Department of Sociology, University of Johannesburg, Kingsway Campus, Auckland Park, 2006, Johannesburg, South Africa
Telephone: +27763846253, E-mail: <[email protected]>,<[email protected]>
KEYWORDS Livelihoods. Disadvantage. Academic Progress. Quintiles. Higher Education. Capabilities
ABSTRACT The focus of this paper is the academic progress of university students who come from disadvantaged schools. While research has been conducted on students’ academic progress at higher education instit utions, previous studies were generic in that they treated students as a homogenous group. This study differ entiates different groups of students using the quintile system and links this to their academic progress.Thi s study was conducted within the sustainable livelihoods approach and sought to explore three aspects of the population under study: namely, livelihood assets, context, andoutcomes both before attending university and during their studies. It measured pre-university assets (such as school quintile) against pre-university outcomes (such as matric scores) and then applied these to university outcomes such as grade point average (GPA) and time to graduation. The results show that low quintile students have much lower average matric scores, achieve amuch lower GPA of just 50% and lower, have a much higher dropout rate (of more than 51%) and take longer to achieve a degree (four to seven years for three-year degrees and five to seven years for four-year degrees) than high quintile students.
INTRODUCTION
Attrition rates in the South African higher education system have been exponential since 2005. This periodisation is important because official data on dropout rates in South African higher education was first published in 2005 for the 2000 cohort of students. The second set of data was published in 2013 by the Council on Higher Education (CHE) with Ian Scott and the Department of Higher Education and Training for the 2005 to 2010 group (CHE 2013).The attri-tion rates have not changed in this seven-year period. Given this evidence, some scholars have dubbed the South African higher education tem a ‘low-participation and high attrition sys-tem’ (Fischer and Scott 2011). The data present-ed in the 2013CHE report is remarkably similar to that reported by the Mail and Guardian in 2006, based on the 2000 student cohort. Some 46% of all students who enrolled for three- and four-year degrees in 2005 at South Africa’s 22 univer-sities, excluding Unisa, had dropped out by 2010 (CHE 2013). Public discussions and reports have linked student failure to poor primary and sec-ondary schooling, poverty, academic underpre-paredness (Letseka and Maile 2008), and lack of support (Gwala SABC Asikhulume 2007; John 2013 in Mail and Guardian; CHE 2013) in terms of career guidance and financial assistance.
The abovementioned studies followed the general trend of treating students as a homoge-nous group. The only real differentiation made by these studies is that their analyses of aca-demic progress focused on variables such as race and gender. While such variables are im-portant in terms of inequalities and/or socio-eco-nomic disparities in higher education opportu-nities and outcomes from a historical perspec-tive, they do not provide a clear indication of who the ‘really’ disadvantaged are in higher ed-ucation in South Africa.
There is a paucity of data on which to base an empirical analysis of disadvantage in higher education in South Africa. The CHE report iden-tified financial constraints as a major obstacle to poor students for succeeding at university (Let-seka and Maile 2008), while also citing academic factors as core impediments (CHE 2013). Thus, financial aid is used as a proxy for disadvantage in higher education.The questionsare: Who are these disadvantaged students? How well do they perform academically compared to their more advantaged counterparts? This paper seeks to present a well-rounded account of the characteristics of a disadvantaged student in the South African context. Different groups of disadvantaged students are differentiated and defined using the quintile system; this is then linked to students’ academic progress at
uni-versity. The study aims to contribute to the dis-course of social justice in higher education and to facilitate the development of disadvantaged students’ abilities, promoting livelihood oppor-tunities and enhancing capabilities.
The quintile system groups students into five categories based on the relative poverty of their catchment communities. It is based on av-erage measures of income, unemployment rates and functional literacy as depicted in the Expen-diture Survey of 2002.
Literature
Analytical Approach: The Sustainable Livelihoods Perspective
While the Sustainable Livelihoods Approach (SLA) has been applied mainly in studies of pov-erty rather than education, its use in this study is due to its potential to provide a broader pic-ture of academic progress. Most conventional defin itions an d appr oach es to academic progress have focused on GPA, tests and other ‘tangible’ assessment measures as if these were the only units of analysis. There has been a ten-dency to brush aside other salient aspects of academic progress (in higher education) such as poverty or student food insecurity, which are sources of vulnerability and academic (and so-cial) exclusion. Thus, the motivation for using the SLA as an analytical tool hinges on its po-tential to investigate three factors relating to the sample of the population under study, namely, livelihood context, assets and the outcome (Chambers 1988; Chambers and Conway 1992). For the purpose of this study a composite defi-nition which encapsulates the three aspects not-ed above as propoundnot-ed by Chambers and Con-way (1992), has been adopted, namely:
a livelihood comprises the capabilities, as-sets (stores, resources, claims and access) and activities required for a means of living: a live-lihood is sustainable which can cope with and recover from stress and shocks, maintain or enhance its capabilities and assets, and pro-vide sustainable livelihood opportunities for the next generation; and which contributes net benefits to other livelihoods at the local and global levels and in the short and long term
(Chambers and Conway 1992).
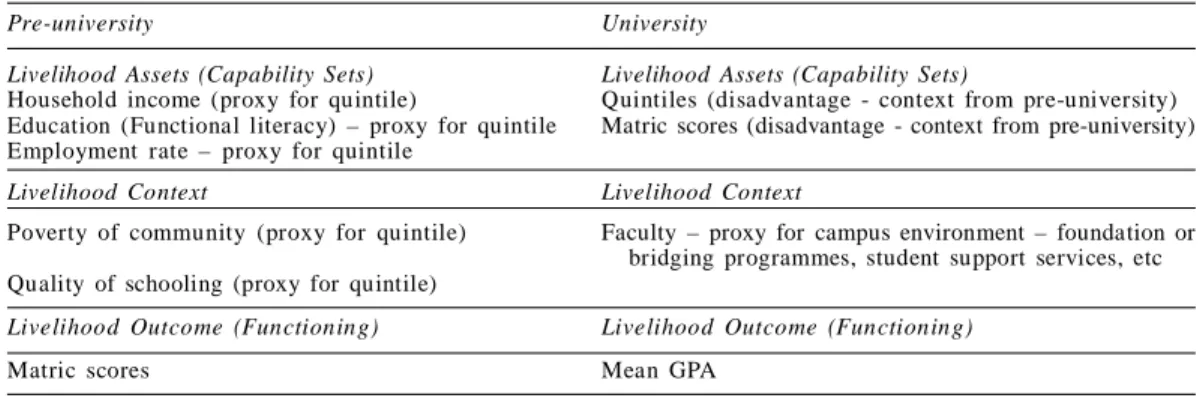
This is a flexible approach that can be used to both qualitatively (descriptively) and quanti-tatively understand a phenomenon. At the quan-titative level, the researcher sought to under-stand the academic progress (livelihood out-come in terms of GPAs and matric scores) of students from low SES (subsumed in the quin-tile system). At a theoretical level, the research-er sought to link the quintile factor and matric score (livelihood context at the pre-university stage) with livelihood outcomes (GPA) at the university level. In this study the context in the pre-university stage becomes an asset in the university stage. Thus, quintile, which is classi-fied as the context in the pre-university stage, becomes an asset in the university stage. Mat-ric score, which is an outcome in the pre-univer-sity stage, becomes an asset in the univerpre-univer-sity stage (Table 1). This study measures assets to assets (quintile to matric), and assets to out-comes (quintiles or matric to GPA; length of reg-istration) and context to outcome faculty to ma-tric and GPA) (Tables 3, 5, 7).
As the following analysis indicates, the live-lihood context (faculty as a proxy for university environment – Table 1) may be a source of vul-nerability (capability constraint) or strength and is also related to livelihood assets which reflect
Table 1: Application of the SLA approach
Pre-university University
Livelihood Assets (Capability Sets) Livelihood Assets (Capability Sets)
Household income (proxy for quintile) Quintiles (disadvantage - context from pre-university) Education (Functional literacy) – proxy for quintile Matric scores (disadvantage - context from pre-university) Employment rate – proxy for quintile
Livelihood Context Livelihood Context
Poverty of community (proxy for quintile) Faculty – proxy for campus environment – foundation or bridging programmes, student support services, etc Quality of schooling (proxy for quintile)
Livelihood Outcome (Functioning) Livelihood Outcome (Functioning)
the students’ social capital base. From a social capital perspective, student support services, the level of education of a society or a communi-ty constitutes social capital. Disadvantaged stu-dents reflect a low social capital base because they come from low SES schools and communi-ties as reflected by a low quintile status (quin-tiles 1, 2 and 3). Thus, low quintile schools are underresourced in terms of financial capital, so-cial capital and human capital. A number of stud-ies have affirmed the association between SES and academic progress. Understanding disad-vantaged students therefore requires an assess-ment of their capabilities in terms of assets (fi-nancial capital, human capital, social capital and physical capital) based on the context of vulner-abilities (capability constraints) within which they operate such as trends, shocks and stress-es (for example, student failure, dropout, taking longer to graduate) and environmental factors. Amartya Sen’s capability approach, which is normatively similar to the SLA, focuses on what people are effectively able to do and to be. The analytical distinction in the capability approach is that between the means and ends of well-be-ing and development (Robeyns 2005). Only ends are of fundamental significance and means are merely instruments to achieve well-being, jus-tice and social development. In the context of this study, the capability to study and graduate with a university degree (an end) is an important variable and unit of analysis. Similarly, the SLA is people-centred; it focuses on what people can do, given their livelihood context and livelihood assets to determine livelihood outcomes. In the capability approach, livelihood outcome is akin to the notion of functioning.
In this study, the focus is on basic capabili-ties which speak to the real opportunity to avoid failure or dropout from university, or failure to graduate in the set time. As the numerical re-sults show, students from low quintile schools take longer to graduate and have a higher drop-out rate. These results point to the fact that stu-dents from low quintile schools (quintiles 1 through 3) do not possess the capability to en-sure academic success or progress.
How does this analysis contribute to the dis-course of social justice? As long as students from low quintile schools do not possess the capability to progress academically, the notion of disadvantage should continue to be analy-sed. From the subsequent statistical analysis, we can infer that the academic progress of
stu-dents from low quintile schools is affected by school SES as subsumed in the quintile system which, in turn, results in low matric scores and poor performance at university in terms of their GPA. Thus, from a social justice point of view, addressing the notion of higher education dis-advantage requires an examination of the school system in order to improve the matric scores of these students and provide remedial programmes in the faculty or university system to assist stu-dents who have been disadvantaged by their poor schooling. The theme of social justice is explicated later in the discussion and conclu-sions sections.
Livelihood Context, Assets and Students’ Academic Progress
This section presents a focused literature reviewthat links the quintile system to liveli-hoodsand the academic progress (outcome) of students at university. In this paper, most of the socio-economic status (SES) variables are sub-sumed in the quintile factor. The quintile factor also underscores growing socio-economic dis-parities in the South African education system. For example, th e CHE (2013) affir med that,”access to and success in higher education is strongly influenced by the socio-economic background of individuals” (See 2008). Other studies haveshown that the majority of South African children are raised in households with-out adequate access to nutrition and healthcare (Smith 2013).This hinders their academic progress at school. Smith (2013) observes that, inequalities in South Africa’s public school sys-tem arethe main factor contributing to poor and r acially skewed per for man ce in h igh er education.At school level, De Wet (2013) has observed that disparities between the health and well-being of school children in different prov-inces in South Africa contribute to dropout rates. Furthermore, a substantial number of black students at university come from low-income households without the financial capital to sup-port their studies (see Smith 2013). The number of young adults who attend tertiary education may be smaller in poorer households than in richer households due to financial constraints (Branson et al. 2009; Wolfe 1982).
The international literature demonstrates that school background matters when it comes to academic achievement in East Asia, the USA and Western Europe (Ho 2003; Yang 2003; Gorard et
al. 2009; Fuchs and Wobmann 2004; Pascarella and Terenzini 2005). Worldwide, students from higher SES families and those who studied in schools with higher average SES, tend to achieve significantly better and exhibit a higher locus of control than those from lower SES families as well as those who studied in schools with a low-er mean SES (Ho 2003). Pascarella and Tlow-erenzini (2005) found that, in the US, the high schoolis a telling variable when it comes to academic achievement at university (Tinto 1975; Astin 1993). This is supported by Vermunt’s (2005) study, which concluded that the quality of schoolingeither facilitatedor thwartedstudents’ preparedness for further study or employment (TIMMS 2003).
The South African literature concurs that socio-economic status is related to dropout or perseverance at university (DoE 2008/9; Letse-ka and Maile 2008; Ministerial Report 2008; CHE, 2010; Smith 2013; John 2013; CHE 2013); this resonates with the international literature (Tinto 1975, 1993; Pascarella and Terenzini 2005; Cardak and Ryan 2006; Clarke 2009).
Letseka and Maile’s (2008) study revealed that 70% of the families of the surveyed higher education dropouts were in the category ‘low income status’, and were predominantly Black South Africans. Furthermore, the parents and caregivers of Black students earned R1600 or less a month in certain cases (Letseka and Maile 2008). Thus, the literature overwhelmingly points to the prominence of the quintile system indica-tors (wealth/poverty, income, employment, liter-acy rates) in determining the academic progress of students at both school and university. These indicators underscore the importance of liveli-hoods in terms of the livelihood context, assets (capabilities to offset shocks such as poverty, which is linked to dropout rates) and outcomes (academic progress in terms of grade point aver-age (GPA), failure or dropout). Thus, differential capacity in terms of assets determines the liveli-hood outcomes of students in higher education. Like livelihood assets, the livelihood context re-flects the extent of the capabilities or vulnerabil-ity of each group of students, which also affects their livelihood outcome (academic progress in terms of GPA).
METHODOLOGY
The full dataset comprises the records of 234 886 individuals who registered at a South Afri-can university during the period 1990 to 2010.
The data on academic progress indicators is drawn from the student management system (SMS) and from the Centre for Higher Education Studies (CHES) in an SPS system which allows for new variables to be created. The data on school quintile was gathered from the website of the Department of Basic Education, South Africa, which is accessible to the public.
The GPA was recorded for each of the two sets of selected samples of the student popula-tion at a SouthAfrican university in 2009 for the population of GPAs and graduates for the peri-od 1990 - 2004. The schools at which these stu-dents matriculated were graded according to quintiles 1 to 5, with schools in quintile 1 the most disadvantaged and those in quintile 5 the least disadvan taged. Th e matr ic scor es (matscore) of the students were subdivided into five categories according to the values shown in Table 2 because the faculties at this universi-ty had different admission criteria. In South Af-rica, matric scores and grades for each subject are calculated using a Swedish formula to pro-vide the overall score.
The abovementioned information was ob-tained for each of the following eight faculties: Engineering, Science, Health Sciences, Medi-cine, Education, Humanities, Law and Manage-ment. The purpose of the analysis is to deter-mine the relationships between GPA, matric score and quintile for each faculty.The matric codes assigned to each faculty in Table 2 are used to decide whether a student is eligible for admis-sion to university. Every year, the Student Man-agement System (SMS) collects a student’s GPA which is the average score gained per credit, and is an important factor in understanding aca-demic progression or progress at university.
The technique utilised in this analysis was analysis of variance (ANOVA). This is useful in testing the differences between means for dif-ferent variables of interest. Thus, if significant differences (close to p-value=0.050) were picked up, a follow-up test (Duncan’s test for differenc-es in means) was performed to determine which means are different and to what extent they are
Table 2 :Codes for matric scores
matscore <27 28- 32 33- 36 37- 40 >41
different. The main thrust of this method of anal-ysis is to determine the association between the variables of interest in this study.
Samples
The following figures reflect the two sam-ples used in this paper for populations of GPAs and graduates, respectively. They both indicate the number that was available for this analysis, namely:
a. 17 991 in 2009; and b. 54 143 in 1990 – 2004.
The GPA was recorded for each of these sam-ples at a South African university between 1990 and 2009. This enabled this researcher to anal-yse GPA patterns against matric, quintile, faculty*matscore, quintile*matscore as revealed
in the sections that follow.
RESULTS
Comparative Analysis of Relationships between GPA,Matric Score and Quintile for Each Faculty
For this section, 17 991 cases were selected from the dataset for the comparative analysis of the relationship between GPA, matric score and quintile for the eight faculties using a method-ological technique calledANOVA.The SLA was used to illuminate the results and findings. This approach sought to explain three factors
relat-ing to the population under study, namely, live-lihood assets, context, and outcomes. Thus, all the findings that are discussed in the sections that follow will be interpreted and explained un-der the rubric of the SLA.
Analysis of Variance and Faculty *Matscore
effect
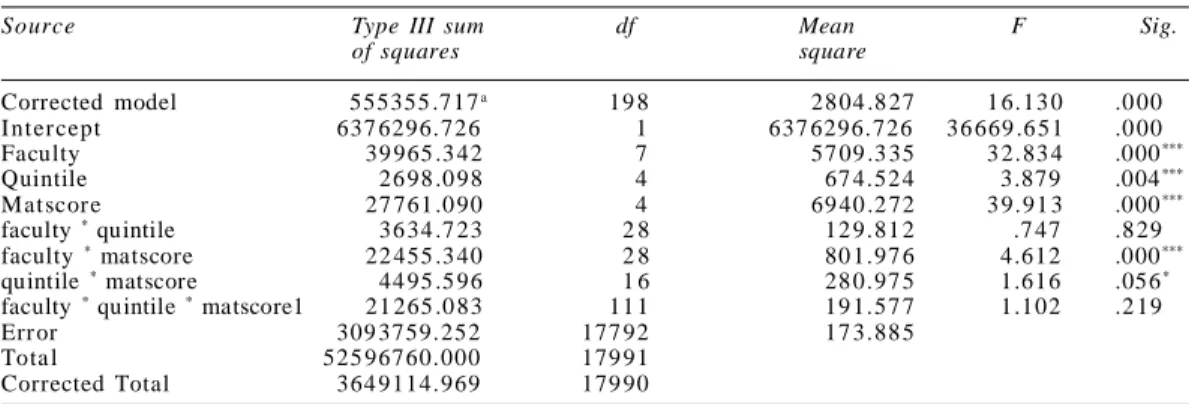
Table 3 shows that the faculty, quintile, matscore, faculty*matscore and quintile*
matscore effects are significant (all close to a p-value=0.050).
Mean GPA for Matscore per Faculty
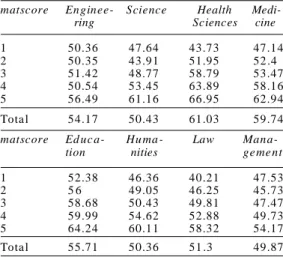
Table 4 shows the mean GPA according to matric scores for all eight faculties under study. Except for the faculty of engineering (where there is no difference between mean GPAs according to matric scores), the GPA trends according to matric scores are relatively similar (Table 4 and Fig. 1).
Thus, based on the overall analysis of mean GPA for matscore per faculty, these results are summarised as follows:
1 Engineering is the only faculty where there is no difference between GPAs for different matscore categories.The reason for this is that there is not sufficient evidence for an association between these factors. 2 The GPA patterns according to matscore are
fairly similar for the other seven faculties.
Table 3: Analysis of Variance (ANOVA) table of GPA for faculty, matric score and quintile
Source Type III sum df Mean F Sig.
of squares square Corrected model 555355 .717a 19 8 28 04 .8 27 1 6.13 0 .0 00 I nter cept 637 6296.726 1 637 6296.726 36 669 .6 51 .0 00 Faculty 39 965 .3 42 7 57 09 .3 35 3 2.83 4 .000*** Quintile 26 98 .0 98 4 67 4.52 4 3.879 .004*** Matscor e 27 761 .0 90 4 69 40 .2 72 3 9.91 3 .000*** faculty * quintile 36 34 .7 23 2 8 12 9.81 2 .7 47 .8 29 faculty * matscore 22 455 .3 40 2 8 80 1.97 6 4.612 .000*** quintile * matscore 44 95 .5 96 1 6 28 0.97 5 1.616 .056*
faculty * quintile * matscore1 21 265 .0 83 11 1 19 1.57 7 1.102 .2 19
Err or 309 3759.252 177 92 17 3.88 5
Tota l 525 96760.000 179 91
Corrected Total 364 9114.969 179 90
*** Significant at the 1% level of significance. P-value < 0.01. * Significant at the 10% level of significance.
P-value between 0.05 and 0.1, and p-value= 0.05 or less means significant at the 5% level.
Since the main effects can be explained fr om an ana lysis of the inter action effects ( faculty*matscor e a nd quintile*matscore) based on Table 3, only the interaction effects will be analysed in the sections that follo w.
Table 4: Mean GPA per faculty for each matscore c at e g or y
matscore Enginee- Science Health ring Sciences cine
1 50.36 47.64 43.73 47.14 2 50.35 43.91 51.95 52 .4 3 51.42 48.77 58.79 53.47 4 50.54 53.45 63.89 58.16 5 56.49 61.16 66.95 62.94 Tota l 54.17 50.43 61.03 59.74
matscore Ed uc a- Hu ma - Law
Mana-tion nities ge me nt 1 52.38 46.36 40.21 47.53 2 5 6 49.05 46.25 45.73 3 58.68 50.43 49.81 47.47 4 59.99 54.62 52.88 49.73 5 64.24 60.11 58.32 54.17 Tota l 55.71 50.36 51 .3 49.87
The highest mean GPA is for matscore 5, followed by matscore 4 (has the second highest mean GPA except for Law, where the means for matscores 3 and 4 are not significantly different).
3 Matscore 1 has the lowest mean GPA for five of the faculties (Health Sciences, Med-icine, Education, Humanities and Law). For Science and Management, matscore 2 has the lowest mean.
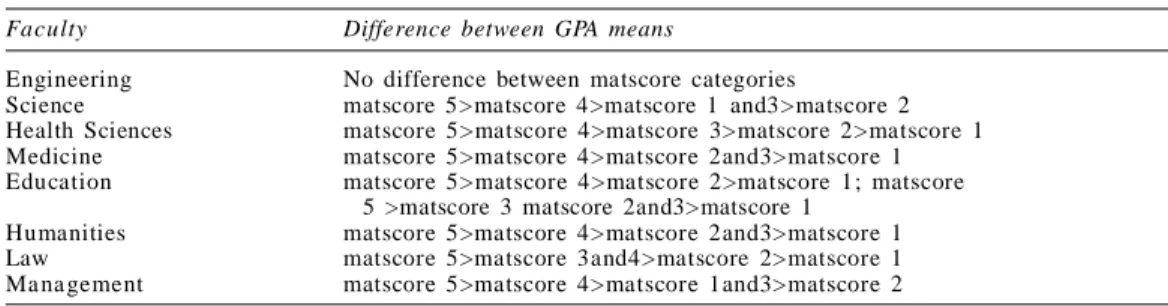
4 The mean GPA for matscore 3 varies from being near the lower end (Science, Medi-cine, Education, Humanities, and Manage-ment) to the middle (Health Sciences) and upper ends (Law). Table 4 and Figure 1 pro-vide an overview of these results (See Ta-ble 5 for an illustration of the patterns of these results).
From an SLA perspective, this illustrates that livelihood assets at university in the form of matric scoresplay a salient role in determining the pattern of GPA in different faculties. The ex-ception is the Faculty of Engineering.
Mean GPA per faculty
Table 6 shows the order of mean GPAs for the eight faculties analysed in this study. A clos-er look at the analysis exhibits two identifiable patterns as shown next:
1 Health Sciences>Medicine>Education> Engineering> Law, Science, Humanities, Management.
2 The only significant difference between the bottom four faculties is that Law> Man-agement (see Table 6).
The results show that GPA performance ac-cording to faculty varied to some extent. This variation could be due to a number of factors such as the admission criteria (matric scores) and remedial programmes in place,especially for underprepared students, as well asthe number of students enrolled. The difference between the faculties of Law and Management is based on the fact that the former admits students with the highest matric scores and had some ‘good’ ac-cess programmes for their new students. Liveli-hood assets (matric score and quintile) are the likely explanation for these variations in the GPA performance of faculties.
Matric Scores
For all the matscore categories except 1 and 2,the mean GPA for a higher matscore category is significantly greater than that for one matscore category lower. There is no significant differ-ence between the GPA for matscore 2 and matscore 1. The order of the GPAs according to matscore is:
Matscore 5 >matscore 4 >matscore 3 > matscore 2, matscore 1.
This suggests that an increase in matric score results in a concomitant increase in mean GPA and that, students in all eight faculties perform according to their high school achievements. Thus, contrary to the findings of other studies that did not find a link or relationship between matric score and academic performance at uni-versity (Department of Management Information 2010), matric score was a key predictor of aca-demic progress. Furthermore, matric score was at the centre of academic disadvantage at uni-versity among students from low quintile schools.Based on the matric codes in Table 2, a low matric score is a capability constraint to stu-dents’ academic progress; thissuggests a low asset base for low quintile students. This is not true for upper quintile students. This further suggests the inseparability of the matric*quintile
affinity, because if one talks aboutthe matric score, there is a high likelihood that one is also talking about the quintile system (the SES of the school and surrounding communities).
Quintiles
For all the quintiles except 1,2 and 3,the mean GPA for a higher quintile is significantly greater than that for one quintile lower. There is no sig-nificant difference between the mean GPAs for quintiles 1, 2 and 3 (low quintile schools). Based on this analysis, the order of the mean GPAs according to the quintiles is:
Quintile 5 > quintile 4 > quintile 1, quintile 2, quintile 3.
Students from low quintile schools (1, 2 and 3) performed marginally in terms of mean GPA compared with those from other quintiles (4 and 5). However, an important finding is that stu-dents performed according to their school
quin-Table 5: Analysis of mean GPA per matscore for each faculty
Faculty Difference between GPA means
Engineering No difference between matscore categories
Science matscore 5>matscore 4>matscore 1 and3>matscore 2 Health Sciences matscore 5>matscore 4>matscore 3>matscore 2>matscore 1 Medicine matscore 5>matscore 4>matscore 2and3>matscore 1 Education matscore 5>matscore 4>matscore 2>matscore 1; matscore
5 >matscore 3 matscore 2and3>matscore 1 Humanities matscore 5>matscore 4>matscore 2and3>matscore 1 Law matscore 5>matscore 3and4>matscore 2>matscore 1 Ma na gement matscore 5>matscore 4>matscore 1and3>matscore 2
Table 6: Ranks of mean GPAs per faculty
Faculty Mean GPA Rank
Health Sciences 61.03 1 Medicine 59.74 2 Education 55.71 3 Engineering 54.17 4 Law 51 .3 5 Science 50.43 6 Humanities 50.36 7 Ma na gement 49.87 8
tile; an indication that there is a correlation be-tween school SES and students’ academic progress at university. This finding resonates with the international literature (refer to the sec-tion on livelihood context, assets and academic progress) (Considine and Zappala 2002). It should be noted, however, that there is an anom-aly in the performance of quintile 1, which could be explained by the wrong classification of quin-tiles. On the other hand, it might be that the university is doing well in terms of addressing disadvantage in higher education by providing support programmes.
Analysis of Quintile*Matscore Effect
Table 7 shows the mean GPAs according to the quintile for each matric score category. The upper quintiles had a higher mean GPA than those on the lower rungs. Based on the analyt-ical approach used in this paper, livelihood as-setsas subsumed in the quintile system play an important role in students’ academic progress at university. Thus, students with a higher as-set base (students in quintile 5) performed bet-ter than those in the lower asset base (students in quintiles 1, 2 and 3) with quintiles 2 and 3 performing better at times. This discrepancy in quintile performance in terms of GPA is affected by imperfections in the quintile classification, where some schools are placed in wrong quin-tile categories due to spatial factors (Kanjee and
Chudgar 2009).This does not suggest that the quintile system is not useful.Nonetheless,most academic performance patterns were consistent. The analysis of the quintile*matric score
yielded the following results:
1 The higher the quintile, the better the sep-aration of the mean GPA according to matscores 1, 2 and 3. Only for quintile 5 is the order of the mean GPAs matscore 5>matscore 4>matscore 3.
2 There is no difference between the mean GPAs for matscores 1 and 2 for all quin-tiles.
3 The mean GPA for matscore 3 varies from being near the lower end (quintiles 1 and 3) to the middle (quintiles 4 and 5) and upper ends (quintile 2). These results are sum-marised in Table 8 and Figure 2.
Interestingly, further examination of the quintile*matric analysis showed that the GPA is
poorest for students from quintiles 1 and 3 schools with a matric score with code 3 (33-36).
For students from quintiles 4 and 5 schools with
this matric score, the GPA is in between and the GPA is best for students from quintile 2 schools with this matric score.
This study shows that the livelihood assets (quintile and matric scores) are both strong pdictors of GPA. For low quintile students, re-moving the capability constraintsrequires im-proving the school system (quintile) and matric scores simultaneously at the pre-university
Table 7 : Mean GPA per quintile for each matscore category
quintile quintile quintile quintile quintile
1 2 3 4 5
matscore Mean Mean Mean Mean Mean
1 48.11 48.18 49.64 48.47 47 .4 2 48.92 48 .6 48.25 49 .4 48 .1 3 50.12 52.14 50.66 51.14 50.35 4 52.67 53.43 52.47 52.61 53.75 5 56.73 53.05 54.96 56.61 58.98 Tota l 50.73 50.33 50.58 51.71 5 3
Table 8 : Analysis of mean GPA per matscore for each quintile
Quintile Difference between GPA means
1 matscore 5>matscore 4 >matscore 1,2and3
2 matscore 3, 4and5>matscore 1and2
3 matscore 5>matscore 4>matscore1,2and3; matscore 3>matscore2 4 matscore 5>matscore 3and4>matscore1and2
stage. The findings also emphasise the impor-tance of remedial processes at university level. The recent CHE report examines some of the remedial processes in place at university level (CHE 2013).
While theabove analysis provided a detailed account of the relationship between GPA and livelihood assets such as matric score and quin-tile, it did not present a full account of academic progress. The following sectionexaminesthe graduation and attrition rates of students from different quintiles.
Graduation and Attrition Rates of Students from Different Quintiles
The previous analyses showed that that fac-ulty, quintile and matric score, single or paired, havea significant influence on the GPA of stu-dents at university. This section analyses the number of students who either graduated or dropped out of university before completing
their studies, and the time taken to complete their studies. The academic records of 54 143 stu-dents whoregistered for three- or four-year de-grees, were analysed.
Time-to-Degree and Graduation Rates for Three-Year Degrees, 1990-2004
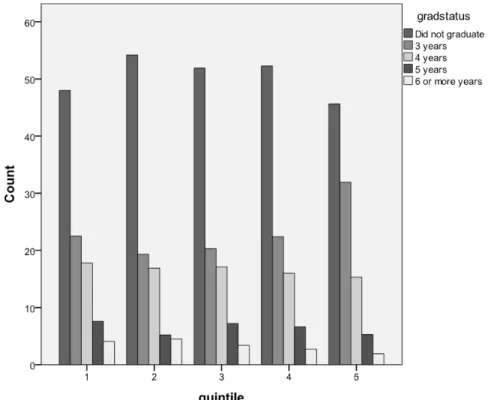
Figure 3 illustrates the distribution of the number of years a student was registered for a three-year degree before graduating per quin-tilefor the period understudy.
Four patterns are observable:
1 The percentage of students who graduated within three years increases from quintile 2 to quintile 5.
2 The percentage of students who graduated within four years decreases as the quintiles increase from 1 to 5.
3 The percentage of students who did not graduate is the lowest for quintile 5. 4 The percentage of students who took six
years or more to graduate decreases as the quintile increases (see Figure 3).
The odds that a student will graduate after three years of study at university increases as one moves up the quintile categories. Thus, this study demonstrates that there is a strong asso-ciation between the level of livelihood assets (quintile) and livelihood outcome (time-to-degree measures – graduation and attrition rates). Grad-uation statistics is a salient variable in higher education, because it tells us how students and higher education institutions are faring in terms of academic performance and this has implica-tions for both parental and institutional invest-ment in students.
The most interesting finding is that quintile has an impact on graduation rates (and also at-trition rates). Thus, quintile as a proxy for back-ground in terms of school SES, including com-munity background, is a salient explanatory vari-able for time-to-degree measures. This is con-firmed by the CHE (2013) that argues that,”access to and success in higher education is predomi-nantly (though not solely) affected by socio-eco-nomic background of individual students”.
Time-to-Degree and Graduation Rates for Four-Year Degrees, 1990-2004
Similar to the performance patterns in three-year degree programmes, the likelihood that a
student will graduate within four years of study is strongly hinged on the quintile category.
Four significant trends were observed, as demonstrated in Figure 4:
1 The percentage who did not graduate is lowest for quintile 2.
2 The percentage who graduated within four years is the highest for quintile 5.
3 The percentage who graduated within five years or more is lower for quintiles 3, 4 and 5 than for quintiles 1 and 2.
4 The percentage who took seven or more years to graduate decreases with an increase in quintiles from 2 to 5.
Thus, according to this analysis, a substan-tial number of students who graduated within regulation time came from quintile 5, while those who took longer to graduate came from low quin-tile schools (quinquin-tiles 1 and 2). Aninteresting findingis that students from low quintile schools who take longer to graduate in the four-year degree programmesare susceptible to dropping out of university before completing their stud-ies. However, there were anomalies in the per-formance patterns of some low quintiles. For in-stance, the performance of quintile 2 (item 1 above) is somewhat strange as it bifurcates from the norm (that students from low quintile
schools perform on a marginal band). Explana-tory variables lay in personality traits such as motivation and an improved university environ-ment, which could not be explored numerically in this paper.
Attrition Rates for Three-Year Degrees per Year per Quintile
From 1998 to 2004, the quintile 5 dropout rate appears to be the lowest and the quintile 2 drop-out rate is the highest.An overview of these re-sults isprovidedin Figure 5.
The empirical analysis of attrition rates dem-onstrates that the dropout rate is related to the level of the quintile (livelihood asset base or capability set). Thus, the higher the quintile cat-egory, the lower the attrition rates. An important finding is that upper quintile students are more likely to persist at university and eventually graduate,thanstudents from low quintile schools. This further suggests that quintile is a strong predictor of academic progress with regard to time-to-degree variables. From an SLA perspec-tive, students with a strong livelihood asset base were less predisposed to dropping out of uni-versity than students exhibiting a low livelihood
asset base (e.g. students from quintiles 1 and 2). A number of factors are cited as reasons for (high) dropout rates in higher education in South Africa and elsewhere. These include so-cial and academic integration, and individual characteristics (Astin 1984, 1993; Bean and Metzner 1985; Pascarella 1985; Moletsane 1995; Kuh and Hu 2001; Beggs and Smith 2003; Baileyand Alfonso 2005).
Attrition Rates for Four-Year Degrees per Year per Quintile
Figure 6 shows the dropout percentages for four-year degrees per year per quintile for the period 1990-2004.The dropout percentages for quintiles 1 and 2 vary considerably more than those for quintiles 3-5. The mean absolute devi-ation for the quintiles 1 and 2 percentages is more than twice that for quintiles 3-5 (Fig. 6).
This study revealed that the patterns exhib-ited for four-year degree programmes are simi-lar to those for three-year degrees. Thus, stu-dents from low quintile schools are more prone to dropout than those from upper quintile schools.
These results should be interpreted in the context of the significant increase inenrolments and participation rates in higher education since 1994. In 2010, total enrolments stood at 900 000, withblack students constituting 79 percent and women making up 57 percent of the total (CHE 2013). However,”an estimated 55 percent will
never graduate” (CHE 2013).There are a number of possible explanations for these performance patterns. Carnevale and Strohl (2013) observed that, in the US, the education system itself acts as a systemic impediment to college for many who complete high school, but are unready for college. They noted that,
whileunderprepared-Fig. 5
ness was responsible for low completion rates, financial constraints were the main reason for increasing attrition rates and increasing time-to-degree (Letseka and Breier 2008; Letseka and Maile 2008; Carnevale and Strohl 2013). This re-flects the South African experience. Thus, dif-ferences in levels of underpreparedness and in-come inequality (both subsumed in the quintile system) explain differences in livelihood out-comes (academic progress and life outout-comes)at universityand life opportunities after graduation. It could also be that the quintile system is good at ascertaining schools at the absolute extremes, that is, between quintile 1 and 5, and not in the middle, between 3 and 4 (Kanjee and Chudgar 2009).
DISCUSSION
This paper underscores the importance of profiling disadvantaged students’ academic progress in higher education institutions. The methodological approach used in this paper of-fers ways of understanding disadvantage in higher education in South Africa. In the sections that follow, the author expands on the contribu-tions of this approach and how the analysis unfolds to argue a case for the articulation of social justice in higher education in South Afri-ca.
Firstly,the quest has been to use an empiri-cally-supported definition of disadvantage as students coming from no-fee schools as classi-fied by the Department of Basic Education, based on the Household Expenditure Statistics of 2002. Thus, schools have been classified based on the levels of poverty of communities in the school’s catchment area. Community poverty is described by the indicators subsumed in the quintile system, namely, income, employment and literacy statistics, including poverty itself. While segmenting student data in terms of race is useful, race is not a sine qua non in the quest to define [higher education] disadvantage in South Africa. There are other units of analysis such as quintile that include the socio-econom-ic indsocio-econom-icators that have been utilised to explsocio-econom-icate and conceptualise disadvantage in higher edu-cation vis-à-vis students’ academic progress. The quintile factor also brings the notion of class to this analysis. Disadvantage in higher educa-tion in South Africa cannot be solely viewed from a racial point of view, but needs to include a classed-based perspective. For the purpose of this paper, students were stratified into
quin-tiles 1, 2, 3, 4 and 5, with quinquin-tiles 1, 2 and 3 forming the low quintile category and 4 and 5 the upper category. Students were also strati-fied into academic progress by matric scores, mean GPAs, quintiles, graduation and dropout. The rationale for this exercise was to examine the full cycle of students’ academic progress (from registration to graduation), given their dif-ferentiated livelihood assets, which are impor-tant for sustainable (student) livelihoods if the outcome is to be positive.
Secondly, the empirical analysis employed ANOVA to test the differences between the means of different variables. Duncan’s multiple range test (MRT) was used as a follow-up test to ascertain the extent or magnitude of the dif-ferences between the means. In this way, the analysis was able to rank the order of academic progress (mean GPAs) at university by linking it to matric scores and quintile per faculty. This gave rigour to the analysis because it did not end with testing differences between means, but went further to ascertain the extent of the differ-ences of different means.
Thirdly, in order to profile disadvantaged undergraduate students in higher education in-stitutions, a multiple entry (multi-perspective) approach was needed that would allow both numerical and theoretical (qualitative) analysis of the phenomenon understudy. The SLA was employed to achieve this purpose. Even though the qualitative aspect may not be conspicuous in these analyses, it is inferentially subsumed in the quintile factor (Table 1). From the capability approach, the performance trends exhibited in this paper showed that students from disadvan-taged schools lacked the basic capability (Sen 1981,1993; Robeyns 2005) to garner high mean GPAs compared with their counterparts in the upper echelons of the quintile ladder.
Fourthly, from the dataset, two sets of sam-ples were available for analysis. While the dataset provided interesting trends in terms of mean GPA patterns and graduation rates, prob-lems arose due to a number of missing values in the dataset. This was the reason for the perfor-mance effects for the faculties of engineering and law where it was concluded that lack of sig-nificance was due to lack of sufficient evidence (Table 4 and Fig. 1). This speaks to the quality of institutional datasets at universities in South Africa. To profile disadvantaged undergraduate students in higher education institutions in
South Africa, we need reliable data from reliable sources. To the author’s knowledge, no univer-sity collects data on quintiles in its Student Management System (SMS) which collects data on which school a student comes from. There-fore, the quality of data will be an important fac-tor in determining the kind of programmes that should be in place, and which needs of disad-vantaged students, they should address.In or-der to do this, we need student data to be col-lected in cohorts, that is, a group of 2009, 2010, etc. Only two influential cohort studies by Scott et al. (2007) and CHE (2013) have attempted to analyse academic progress patterns in South Africa since 1994.The dearth of cohort studies is a serious deficiency that hinders the holistic analysis of the academic progress patterns of students in higher education institutions in South Africa. This paper attempted to fill this gap, despite the challenges in the dataset analy-sed.
Fifthly, the quintile factor does not reveal complex forms of inequality and how to con-front these. Mean GPAs simply mean either en-rolment at university or achievement in parochi-ally constructed tests. The SLA together with the capability approach has enormous potential to address the problems of academic equality, quality and measurement. The SLA allows us to analyse students’ academic progress patterns beyond narrowly defined lines such as an as-sessment of education deemed valuable, which neglects an examination of resources and class issues. While the issues of class and education inequality are latently clear in terms of the quin-tile factor, the scope of this paper did not allow us to explore it overtly. A more nuanced approach that employs both quantitative and qualitative analyses, is required to analyse these issues.
This being the case, based on the quintile classification, a brief note on class issues is use-ful. Stratification by income (quintile) demon-strates underrepresentation by income (Carnev-ale and Strohl 2013). While income stratification is a telling variable, this does not nullify the sys-temic racial stratification in both American and South Afr ican high er education systems (Carnevale and Strohl 2013 on the American ex-perience, and CHE (2013) on the South African system. In the context of this study, class-based inequalities are subsumed in the quintile sys-tem. Low quintile students are susceptible to class-based economic disadvantage because
they are concentrated in the low livelihood as-set base (a capability constraint) due to spatial and social isolation from the general society (Carnevale and Strohl 2013). Salient to this pa-per, is the fact that this income stratification as subsumed in the quintile factor has an impact on the livelihood outcomes of university stu-dents as demonstrated by the empirical analysis in this study.
Sixthly, the approach utilised in this study has implications for social justice. The quintile effect on academic progress reveals that stu-dents from low quintile schools do not possess the basic capability to be educated (livelihood assets to succeed in terms of their mean GPAs). Thus, students from low quintile schools per-form marginally compared with their counterparts in the upper quintile category because of their low asset base (low matric scores). This status quo underscores that the capability to be edu-cated constitutes a basic entitlement and that its provision becomes a matter of [social] jus-tice because of the:
contribution that the capability to be edu-cated makes to the formation and expansion of human capabilities, and hence the contribution it makes to people’s opportunities for leading flourishing lives (Unterhalter and Brighouse 2007).
Students from low quintile schools suffer from a‘basic capability failure’ (Unterhalter and Brighouse 2007). They are caught in the trap and misery of low matric scores because of poor schooling (low quintile as low SES). This pre-vents this group of students from achieving im-portant milestones–high matric scores and even-tually mean GPAs – the livelihood outcomes at both pre-university and university levels (Ta-ble 1).
To advance and articulate the theme of so-cial justice, this author also borrowed from Sab-ina Alkire’s work, that notes that basic needs should be defined with reference to “absolute harm rather than wants, needs, desires or prefer-ences” (Alkire 2002). Thus, disadvantaged stu-dents’ capability to be educated is harmed by their poor schooling which is a status that they do not choose, but is ‘prescribed’ by the educa-tion system. This fails the litmus test of fair equal-ity of opportunequal-ity (FEO).
Therefore, at the pre-university stage, reme-dial processes are required to improve matric scores in disadvantaged schools and to address
the factors associated with the quintile system. At university level, support or bridging pro-grammes should address the skills levels of stu-dents from low quintile schools, facilitating both academic integration and intellectual develop-ment. The CHE (2013) has proposed a number of remedial programmes, including an extended curriculum for undergraduate students. If we are aware of or are able to ascertain livelihood as-sets or capability as-sets, we will be in a position to offer sustainable (student) remedial processes and render (students’) livelihoods sustainable in terms of coping, recovering from stress and shocks, and enhancing capabilities and assets (Chambers and Conway 1992).
The issues raised here prompt serious ques-tions about the role of higher education institu-tions in improving the school system which con-tributes to disadvantage in higher education in South Africa. Universities have a role to play at the school level beyond training teachers. While it may be claimed that this is outside their man-date, universities’ mission statements, particu-larly with regard to ‘community outreach’, belie such claims. Platforms for engagement and ac-tive interaction between the school system and higher education institutions need to be created in order to establish best practice and improve the school system.
CONCLUSION
The empirical analysis presented on mean GPAs demonstrates that faculty, matric scores, quintile, faculty*matric scores and quintile* matric scores effects, are significant. Thus, there is a significant relationship between faculty and matric score, quintile and matric, and the aca-demic progress (GPA) of students at university. The GPA patterns are fairly similar for all the faculties except engineering, with matric score 5 having the highest mean GPA, followed by matscore 4. In terms of the graduation measures, the analysis shows that the odds that a student will graduate within the set time for both three-and four-year degrees increased as one moves up the quintile category. This same principle applies to dropouts; students from low quintile schools were susceptible to dropout and took longer to graduate than those from the upper quintiles. However, there were anomalies in the performance patterns of quintile 2. The explana-tion is that, as shown earlier, the quintile
sys-tem’s strength lies in its ability to identify school quintiles at the absolute extremes.
RECOMMENDATIONS
This study has implications for further re-search. Based on the results of the empirical analysis in this paper, it is plausible to reduce the quintile system to three categories by com-bining schools in quintiles 1, 2 and 3 to form one group (low), while the two remaining quintiles are divided into middle and upper, depending on the poverty/wealth of the schools’ catchment areas. As it stands, the quintile classification is not a perfect measurement; however,it is a use-ful tool for classifying schools in South Africa in terms of resource allocation, social stratifica-tion and academic progress.
Further, this study revealed a strong rela-tionship between quintile, matric score and GPA. However, it did not illustrate which skills were acquired by low quintile students for both aca-demic progress and life opportunities beyond university. Further research could focus on the study skills acquired by tracking and analysing them. Is there a relationship between acquiring study skills and the academic progress of low quintile students compared with upper quintile students? This paper provides quintile compar-isons of outcomes (matric, GPA, graduation) of students from disadvantaged schools and those from higher SES schools. Research is also re-quired into the lived experiences of advantaged quintile 5 students to compare them with those of the lower quintile, disadvantaged students investigated in this study. A comparative study of these issues in two higher education institu-tions would also be useful.
REFERENCES
Alkire S 2002. Valuing Freedoms: Sen’s Capability Approach and Poverty Reduction. Oxford: Oxford University Press.
Astin AW 1984. Student involvement: A developmen-tal theory for Higher Education. Journal of College Student Personnel, 25: 297-308.
Astin AW 1993. What Matters in College: Four Criti-cal Years Revisited. San Francisco: Jossey-Bass. Bailey T R, Alfonso M 2005. Paths to Persistence: An
Analysis of Research on Programme Effectiveness at Community Colleges. Lumina Foundation for Ed-ucation New Agenda Series, 6 (1): 1-44.
Bean JP, Metzner B 1 985. A conceptua l model for non-traditional undergraduate student attrition. Re-view of Educational Research, 55: 485-540.
Beggs JB, Smith E M 2003.A New Paradigm for Maxi-mising Student Retention in
Higher Education. January. IEE Engineering Educa-tion Con ferenc e, Sou tha mpton. http://www. ulster.ac.uk/star/resources/paradigm.pdf. (Retrieved on 25 August 2015).
Branson N, Leibbrandt M, Zuze L 2009. The Demand for Tertiary Education in South Africa. Cape Town: Southern African Labour and Development Research. Cardak BA, Ryan C 2006. Why Are High Ability Indi-viduals From Poor Backgrounds Under-Represented At University? Discu ssio n Pape r N oA0 60 4. La Trobe University, Melbourne, June.
Carnevale AP, Strohl J 2013. Separate and Unequal: How Higher Education Reinforces the Intergenera-tional Reproduction of White Racial Privilege. Geor-getown University: Public Policy Institute, Centre on Education and the Workforce.
Chambers R 1988. Sustainable Rural Livelihoods: A Key Strategy for People, Environment and Develop-ment. Londres: Earthscan Publications.
Chambers R, Conway G 1992. Sustainable rural liveli-hoods: Practical concepts for the 21st century. IDS Discussion Paper, Institute of Development Stud-ies, Brighton.
Chambers R, Conway G 1992. Sustainable Rural Liveli-hoods: Practical Concepts for the 21st Century. IDS
Discussion Paper 296, IDS, Brighton.
CHE 2013. A Proposal for Undergraduate Curriculum Refor m In South Africa: The Case for a Flexible Curriculum Structure. Report of the Task Team on Undergraduate Curriculum Structure. Discussion Doc-ument. Pretoria.
CHE 2010. Access and Throughput in South African Higher Education: Three Case Studies.
CHE: Pretoria.
Clarke H 2009. Counselling Services in an Institution-al Context. AUCC (September), 3-6.
Considine G, Zappala G 2002. The influence of social and economic disadvantage in the academic perfor-mance of school students in Australia. Journal of Sociology, 38: 129-148.
De Wet P 2013. Crisis in South African Schools. Mail and Guardian Online, Weekly, September 27. Johan-nesburg. [http://mg.co.za/article/2013-09-27-00-cri-sis-in-sa-schools].
DMI 2010. Symposium on National Senior Certificate and First Year Student Performance: Implications for U niversity Admiss ion. D urban: University of KwaZulu-Natal.
DoE 2008. Report of the Ministerial Committee on Transformation and Social Cohesion and Elimina-tion of DiscriminaElimina-tion in Higher EducaElimina-tion Institu-tions. 30 November 2008.Pretoria.
Fisher G, Scott I 2011. The Role of Higher Education in Closing the Skills Gap in South Africa. Africa Region: The World Ba nk Human Development Group.
Gorard S, See BH, Smith E 2009. The impact of SES on participation and attainment in science. Studies in Science Education, 45: 93-129.
Gwala X 2007. Government Intervention Higher Edu-cation: Capping on Student Fees. Asikhulume-Let’s Talk. South African Broadcasting Corporation Chan-nel 1 - SABC 1, South Africa.
Ho SCE 2003. Family influences on Science learning among Hong Kong adolescents: What we learned from PISA. International Journal of Science and Mathematics Education, 3: 409 - 428.
John V 2013. Dropout Rate Points to Lack of Sup-port. Mail and Guardian Online. Weekly, May 17. Johannesburg. [http://mg.co.za/article/2013-05-17-dr opout-r ate-points-to-la ck-of-support].
Kanjee A, Chudgar A 2009. Accuracy of the Poverty Qu intile System for Identifying South African Schools. 2nd Monitoring and Evaluation Colloquium.
Gauteng Department of Higher Education, 20 No-vember. Sandton: Published by the Human Sciences Research Council.
Kuh GD, Hu SP 2001. The effects of student-faculty interaction in the 1990s. Review of Higher Educa-tion, 24: 309-332.
Letseka M, Maile S 2008. High University Drop-out Rates: A Threat to South Africa’s Future. HSRC Pol-icy Brief, Human Sciences Research Council. South Africa.
Letseka M, Breier M 2008. Student Poverty in Higher Education: The Impact of Higher Education Drop-out on Poverty.HSRC Press, SDrop-outh Africa. Moletsane R 1995. The Anomalous Success of Black
South African Students in Predominantly White Unit-ed States Universities. PhD Thesis, Unpublished. Bloomington: Indiana University.
Pascarella E, Terrenzini P 2005. How College Affects Students. San Francisco, CA: Jossey-Bass. Pascarella E1985. College environmental influences
on learning and cognitive development: A critical review and synthesis. In: J Smart (Ed.): Higher Ed-ucation: Handbook of Theory and Research. Aga-thon: New York¸ pp. 1-61.
Robeyns I 2005. The capability approach: A theoreti-cal survey. Journal of Human Development, 6(1), 93-117. From <www.hsrc.ac.za> (RETRIEVED ON)
Scott I, Yeld N, Hendry J 20 07. Higher Edu cation Monitor: A Case for Improving
Teaching and Learning in South African Higher Educa-tion. Higher Education Monitor No. 6. South Afri-ca: University of Cape Town.
Sen A 1981. Poverty and Famines: An Essay on Enti-tlement and Famines. Oxford: Clarendon Press. Sen A 1993. Capability and well-being. In: M
Nuss-baum, A Sen (Eds.): The Quality of Life. Oxford: Clarendon Press, pp. 30-53.
Smith D 2013. Post-apartheid Students Still Divided By Differing Graduation Rates. The Guardian. Jo-hannesburg.
Trends in International Mathematics and Science Study (T IMMS), TI MMS 20 03 Inter national Reports. From <http://timss.bc.edu/.> (Retrieved on 21 Feb-ruary 2011).
Tinto V 1975. Dropout from higher education: A the-oretical synthesis of recent research. Review of Ed-ucational Research, 45: 89-125.
Tinto V 1993. Leaving College: Rethinking the Caus-es and CurCaus-es of Student Attrition. Chicago: Univer-sity of Chicago Press.
Trends in International Mathematics and Science Study (TIMMS)2003. International Reports. From <http:/ /timss.bc.edu/.> (Retrieved on 21 February 2011).
Unterhalter E, Brighouse H 2007. Distribution of what for social justice in education?
The ca se for education for a ll by 201 5. I n: A Sen (Ed.): Capability Approach and Social Justice in Ed uc atio n. New York : Pa lgra ve Macmillan, pp. 6 7 -8 6 .
Wolfe JR 1982. The impact of family resources on child IQ. Journal of Human Resources, 17: 213-235. Yang Y 2003. Dimensions of socio-economic status and
their relationship to mathematics and science achieve-ment at individual and collective levels. Scandina-vian Journal of Educational Research, 47(1): 21-41.