DECENT AND AFFORDABLE HOUSING IN RWANDA: FINANCING OPTIONS FOR SUSTAINABLE DEVELOPMENT By Emmanuel MUNYEMANA ID: 201512006 A DISSERTATION Submitted to
KDI School of School of Public Policy and Management in partial fulfillment of the requirements
for the degree of
MASTER OF PUBLIC POLICY (MPP)
DECENT AND AFFORDABLE HOUSING IN RWANDA: FINANCING OPTIONS FOR SUSTAINABLE DEVELOPMENT By Emmanuel MUNYEMANA ID: 201512006 A DISSERTATION Submitted to
KDI School of School of Public Policy and Management in partial fulfillment of the requirements
for the degree of
MASTER OF PUBLIC POLICY (MPP)
2016
DECENT AND AFFORDABLE HOUSING IN RWANDA: FINANCING OPTIONS FOR SUSTAINABLE DEVELOPMENT By Emmanuel MUNYEMANA Submitted to
KDI School of School of Public Policy and Management in partial fulfillment of the requirements
for the degree of MASTER OF PUBLIC POLICY
Committee in Charge:
Professor Wonhyuk LIM Supervisor __________________________________
Professor SiwookLEE __________________________________
Professor ManCHO __________________________________
ABSTRACT
DECENT AND AFFORDABLE HOUSING IN RWANDA: FINANCING OPTIONS FOR SUSTAINABLE DEVELOPMENT
By
Emmanuel MUNYEMANA
Spread of informal settlements constitutes an indication that households are unable to afford a decent housing. For several years housing market in Rwanda was left free of government intervention which raised issue of inclusiveness. Using mixed research methods, this paper explored the underlying factors beyond income that affect households to access decent and affordable housing and also reviewed housing policies of successful countries in providing housing to low and middle income people. Key findings revealed that in urban areas of Rwanda, informal or squatter settlements represent 55.7% and unplanned setting, also, 49.9% of households in urban areas live in privately rented housing. Furthermore, 56.4% of housing in urban and 92.0% of housing in rural areas were not decent, while, 33.2% of households in urban area confront affordability challenges. Only 27.7% of households in urban and 6.2% of households in rural areas live in decent and affordable housing. Employment in skilled occupations, owning livestock(s), and, having non-farm enterprises strongly contribute to having decent and affordable housing. However, households owning money to others and married couples have high likelihood of living in non decent housing and confront housing hardships. Reviews of successful countries in housing for low income households indicated that government interventions based on income and other demographic differentials resulted into improvement in supply of housing and lessening affordability burden to households.
i
Dedication
This Thesis is dedicated to: Almighty God, for His grace My lovely Family and All Friends
ii
ACKNOWLEDGEMENT
I would like to express my tender thanks to the supervising committee of this thesis, namely, Professor Dr. Lim Wonhyook and Professor Dr. Lee Siwook. This research would not have been finalized without their thorough guidance and encouragement.
My gratitude is extended to academic staff of KDI School of Public Policy and Management for their tireless endeavor in training future global leaders. Similarly, I give a special thanks to KDI-School’s administration for fully supporting my stay in Korea. Covering school tuition fees and living expenses helped me to sharpen my future potential and I believe that, the skills gained in the whole intensive year courses will play a big role in building my country.
Finally, I thank my wife Mrs. TUYISENGE Agathe who on daily basis provided with me a moral support and encouragement despite the long distance.
iii
TABLE OF CONTENT
LIST OF TABLES ... v
LIST OF FIGURE... vi
LIST OF ABBREVIATIONS ... vii
CHAPTER ONE: INTRODUCTION ... 1
1.1. Introduction ... 1
1.2. Problem statement ... 3
CHAPTER TWO: LITERATURE REVIEW ... 7
2.1. Decent and Affordable Housing Defined ... 7
2.1.1. Decent house ... 7
2.1.2. Affordable housing ... 8
2.2. Decent and Affordable Housing in Comparative Perspective ... 12
2.3. Rwandan economy and housing market ... 16
2.4. Existing housing financing framework a comparative view ... 20
CHAPTER THREE: DATA AND METHODOLOGY ... 23
3.1. Overview ... 23
3.2. Desk research and qualitative analysis ... 23
3.3. Quantitative data analysis ... 24
3.3.1. More about the survey data ... 24
3.3.2. Quantitative Methods Analysis and variables ... 25
CHAPTER FOUR: ANALYSIS AND INTERPRETATION OF FINDINGS ... 28
4.1. Introduction ... 28
4.2. Housing occupation status in Rwanda ... 28
iv
4.4. Housing Tenure structures in Rwanda ... 30
4.5. Private housing physical conditions/characteristics ... 31
4.5.1. Private houses walls characteristics ... 31
4.5.2. Private house and roofing characteristics ... 32
4.5.3. Types of Floor in private households of Rwanda ... 33
4.6. Decent and affordability characteristics of housing ... 34
4.6.1. Decent house characteristics ... 34
4.6.2. Housing affordability in Rwandan households ... 35
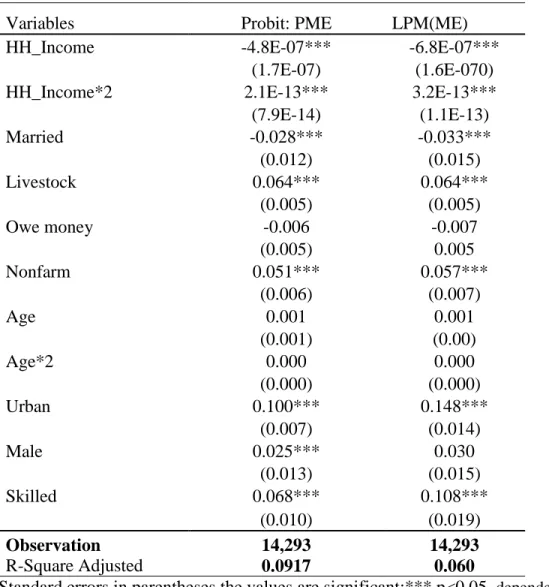
4.7. Decent and affordable housing: Regression results ... 37
4.7.1. Summary statistics of variables ... 37
4.7.2. Probit Regression results: Margins predicted probability effect and LPM results ... 38
CHAPTER 5: DISCUSSION, POLICY IMPLICATION AND CONCLUSION ... 41
5.1. Discussion ... 41
5.2. Conclusion ... 45
5.3. Policy Implications ... 46
5.3.1. Households level interventions ... 47
5.3.2. Housing supply side and policy interventions ... 47
5.3.3. Institutional Policy interventions in housing... 48
List of Appendices ... 50
Apendix I: Probit results (1) ... 50
Apendix II: Marginal effect (2) ... 51
Apendix III: Linear Probability model (3) ... 51
Apendix IV: Marginal effect, LPM (4) ... 52
v
LIST OF TABLES
Table 1: The conventional determinants of housing market ... 11
Table 2: Mortgage industry in "000" Rwandan Francs ... 19
Table 3: Hosing financing framework in Korea, Singapore and Rwanda ... 21
Table 4: Material of walls of private housing ... 31
Table 5: Roof characteristics ... 32
Table 6: Floor characteristics ... 33
vi
LIST OF FIGURE
Figure 1: Housing financing model in Korea ... 14
Figure 2: Rwanda nominal and real GDP per capita (2001-20014) ... 16
Figure 3: Status of Settlement in Rwanda ... 29
Figure 4: Housing structure ... 31
Figure 5: Affordability distribution: Rural and Urban analysis ... 35
vii
LIST OF ABBREVIATIONS
EICV Integrated Household Living Conditions Survey
FDI Foreign Direct Investment
GDP Gross Domestic Product
GNI Gross National income
GoR Government of Rwanda
HABITAT United Nations Human Settlements Programme
HCB Housing and Commercial Banks
IGC International Growth Center
LPM Linear Probability Model
IMF International Monetary Fund
MDGs Millennium Development Goals
MINECOFIN Ministry of Finance and Economic Planning
MININFRA Ministry of Infrastructure
NHF National Housing Fund
NISR National Institute of Statistics of Rwanda
RHA Rwanda Housing Authority
RSSB Rwanda Social Security Fund
UK United Kingdom
UN United Nations
USA United States of America
1
CHAPTER ONE: INTRODUCTION
1.1. Introduction
What socio-economic factors constraining households’ to access decent and affordable housing in Rwanda? Housing comprises an individuals’ most important investment in the course of life and the McKinsey Global Institute (2014)1 acknowledged that decent and affordable housing is fundamental to the health and well-being of people and to the smooth functioning of economies. However, across the globe less developed and advanced industrialized economies are confronted with the challenge of meeting the demand of housing at an affordable cost. For example, Cities like Kigali in Rwanda and New York City in the United States of America are struggling to meet this need.
It was argued by McKinsey and Company (2014) that if current global urbanization and income growth keep on a constant trend, the number of urban households which live in substandard housing or who are so financially constrained by housing costs that they give up by not accessing other essentials such as healthcare and basic food is likely to grow by 33% by 2025. This explains why the number of the population needing standard housing will rise from 330 million in 2014 to 440 million in 2025 worldwide. Consequently, the McKinsey and Company report on global housing affordability challenges of 2014 predicted, that, affordable housing challenges will directly and indirectly affect one in three urban dwellers worldwide. Explicitly, about 1.6 billion people in 2025 are likely to face issues linked with the lack of affordable and decent housing. Hulchanski (1995) confirmed that there is significant sign that issues of lack of affordable and decent housing will have scale up effects on a large number of the population globally.
2
There is a continuous debate and mixed views between scholars about the definition of affordable housing see for example (Frontier economics, 2014; Newman & Holupka, 2014; Schwartz and Wilson, 2006). However, this research followed the mostly used approach of affordability definition which involves three major variables of defining affordable housing. Those are (i) income per households, (ii) affordability measured in the proportion of households’ income allotted to the payment of housing cost and (iii) standards of occupied house: a house that meets minimum acceptable standards of inhabitability. This method of affordable measurement is commonly known and used in United States of America (USA) and Europe. Furthermore, the emphasis in measuring the affordable house is put on the income share that a household allocates to cost of residential housing. The estimates indicate that, to be qualified “affordable” housing cost should be less or equal to 30% of household income (the commonly known measure of affordability). This definition was criticized of being ambiguous and rule of
thumb2 (Frontier economics, 2014; Newman and Holupka, 2014; Schwartz and Wilson, 2006).
Analysis on decent and affordable housing conducted in USA correlates with housing costs and poverty for the well-being of American citizens (Edward, Glaeser & Gyourko, 2002). It is then argued that countries should pursue sensible anti-poverty policies, but if housing cost is high and volatile, these policies should not be put forward as a response to housing crisis.
Finally, this thesis is organized in five main chapters
Chapter one refers to the general introduction, tackling an overview of the research, and
statement of the problem. The latter included the research questions, and objectives of the study. Finally, the chapter illuminates the gap in affordable housing studies particularly in developing countries.
2 See also http://www.bloomberg.com/bw/articles/2014-07-17/housings-30-percent-of-income-rule-is-near-useless
3
In Chapter two, is mainly characterized by the thorough review of literature related to housing affordability. And the emphasis was put on definitions of key concepts namely decent and affordable housing. Selectively countries like Korea, Singapore, were emphasized in the literature, but also the policies and program on decent housing implemented by United Kingdom were reviewed as well;
Chapter three deals with the methodology and techniques used in the entire process of the
research, that include data type, documentation, research design, statistical design of the research, analysis and interpretation of findings techniques;
Chapter four illustrates the research findings and interpretations. In this section
descriptive and regression analysis were presented in varying forms which include chart and tables;
Chapter five embarks on discussion of findings, conclusion and policy implications based
on research findings.
1.2. Problem statement
The Rwandan government recognizes that “housing is a basic right for its citizens as stated in international declarations such as the Istanbul Declaration of June, 1996, the Millennium Development Goals (February, 2002), and the World Summit on Sustainable Development (July-August, 2002)” (Rwanda Ministry of Infrastructure, 2008 p.3). However, the employment and earning structures in Rwanda indicate that average annual household income is
4
approximated to two hundred and eight nine thousand Rwandan francs (289,000 Frw3). Based on
individual earnings, it would be impossible to low and median income earners who are far below the median income to own their homes or rent affordable housing without making painful sacrifice of relinquishing other necessary goods or services. Consequently, a big percentage of housing structures in all cities of Rwanda were developed without prior master plans which ultimately created high informal settlement and slums. Tsinda et Al. (2013) found that about 62% of the urban populations in Sub-Saharan Africa live in informal settlements and 62.6% of residents in Kigali city reside in unplanned and informal settlements. These statistics provide a signal that there is a high rate of duelers who live in non decent and unaffordable houses. By using households’ survey data, this paper pointed out the magnitude of issue of decent and affordable housing.
Rwanda is among the least urbanized countries in Africa, but share of urban residents is expending and there is high expectation of substantial increase in the share of urban population from current 17% to 35% by 2020. This translates into nine percent (9%) annual increase in the urbanization as indicated by official statistics. The increase in urbanization is also in line with the national target of reducing the share of agriculture to national output (GDP) toward service based economy (MINECOFIN, 2000). This economic structure shift will increase a need to affordable houses in urban areas and emerging cities country wide. A big number of populations are expected to continually move from rural areas (agriculture dominant) to urban areas (industry and service dominant) and thus impinge pressure on demand of housing of low cost by new migrants whose income is in low and/or in middle category.
3 1Frw is equal to 0.0014 USD or 1USD is equivalent to 724.6241 based on July, 10 2015 exchange rate. Retrieved on http://www.currency.me.uk/convert/rwf/usd
5
The government of Rwanda adopted national urban housing policy for Rwanda in 2008 and also put in place national human settlement policy in 2009. These policy documents have commonalities ranging from political will and national guiding principles of supply of affordable houses. Those are (i) recognition of limited supply of decent and affordable housing in Rwanda, (ii) the need for a combined effort in the supply of the houses and (iii) relevance of the affordable housed in the development of Rwanda. However both policies lack the financing mechanisms, which should be put in place in order to optimally cater for the shortage of decent and affordable dueling in Rwanda. The implementation of policies and programs constitute cornerstone component of those policies to address housing market issue in Rwanda because not only to its essential role in social economic welfare but also the complexity of housing market in economic development and growth sustainability in Rwandan economy. However, despite the existence of these polices low cost housing meeting minimum acceptable standards continued to be scanty or nonexistent at all.
Another important point to mention is that, the above mentioned policies do not illustrate the probable financing mechanisms or possibilities in order to stimulate supply and to unable supply of affordable houses in Rwandan housing market. By financing mechanism, this study refers to conventional models of housing financing which include: (i) Cooperative renting, (ii) rent to own, (iii) construction of own home, (iv) individual/group or collective mortgage (v) micro-finance; (vi) government subsidy to the housing suppliers or subsidy to the tenants low income.
Then, what socioeconomic factors constraining individuals to access decent and affordable housing in Rwanda? Which policy options should be put in place by government of Rwanda (GoR) to facilitate sustained financing of supply of decent and affordable houses in
6
Rwanda? Both questions should be addressed by integrating the environmental concern and land depletion issues. In this respect it is worth noting that Rwanda is a small country, where land constitutes primary source subsistence and second highly densely populated in Africa. Therefore a continued demand of land for housing development also embodies another danger of increased inequality as well land depletion for standalone houses in slums areas.
Research on affordable housing attracted researchers in industrialized and advanced economies see for example (Kearns, 1992, Powell, Stringham & Moore, 2004; Tilly, 2005; Grimes & Aitken, 2006; The Australian Council for Trade Union, 2007; Malloy, 2010; Newman &Holupka, 2014), they mostly researched on supply of affordable housing and the government intervention in market economy and elaborated the policy framework that should be adopted in reference to the urban development. However, there is significant gap of research tackling on the determinants of house affordability based on individual characteristics namely demographic factors, and households’ accumulated wealth, job occupation among others. Particularly, studies on affordable housing in Rwanda as well as in other less developed countries are still inadequate. Therefore, this research shed more light on the determinants of the affordable houses on demand side by assessing the individual characteristics of households and also taking a closer look to the mechanisms or policy options that should be put forward by government of Rwanda to ensure sustainable supply of decent and affordable housing urban areas of Rwanda.
With the aim of narrowing the scope of this study, researcher bounded the analysis on the individual characteristics based on survey data, collected in 2011/2012; the data used for analysis cover both urban and rural households of Rwanda. The cross comparison by residence setting
7
CHAPTER TWO: LITERATURE REVIEW
2.1. Decent and Affordable Housing Defined
In a market economy, distribution of income is the key determinant of the quantity and quality of housing supplied. Housing is often biggest expenditure of low and middle income families (Tilly, 2005). Also, housing choice is a response to an extremely complex set of economic, social, and psychological wishes for any nation across the globe. The Australian Council for Trade Union (2007) reiterated that affordable housing is crucial to a country and its people. Lack of affordable housing, households and individuals fall under persistent poverty, inequality is exacerbated, jobs are lost, the overall economy is weakened, and the environment is damaged. Similarly, due to the limited supply of houses and increasing demand, the prices of houses in most countries have continuously skyrocketed and resulted into a situation where low and middle income people are unable to own decent housing.
2.1.1. Decent house
The concept of a decent house is linked with the minimum standard required that a habitable house should meet. The concept of decent4 housing was largely used in the United
Kingdom (UK) during the 2000s to improve the living conditions of public areas. There was selection criteria considered in order for a given house to qualify as a standard house. Namely: (i) having a reasonable state of repair, (ii) having a reasonably modern facilities and services, and (iii) that house must also possess a reasonable degree of thermal comfort. The definition offered by the United Kingdom does not differ from that given by the United Nations agencies
8
HABITAT5 and the United Nations Human Rights Council to describe adequate housing. These
UN institutions defined adequate housing as fundamental rights of human beings. And this right represents three main aspects: (i) freedoms; (ii) entitlements and (iii) provide more than four walls and a roof. The latter aspect represents the economic characteristics of decent housing. Also the UN offered minimum criteria that should be met in order for a house to be adequate. Those are security of tenure, availability of services, materials, facilities and infrastructure, habitability, physical safety, accessibility, and cultural adequacy. In reference to the above mentioned criteria, it is then important to point out that access to a decent home is positively linked with improved living conditions of the owner or occupier. In this paper, we limited our definition to decent housing to physical conditions namely exterior wall, floor, and ceiling characterised by hard materials.
2.1.2. Affordable housing
Studies on house affordability have attracted social researchers from the 1990s to the present, and due to the continuous increase in the price of houses, both academicians and policy makers are strongly motivated to understand the dynamics of affordable housing. This paper referred to the definitions provided by different economists of housing markets. Beginning with Maclennan and Williams (1990) and Bramley (1990), housing affordability was described as a situation in which an individual or household is able to secure some given standard(s) of housing at a price or a rent which does not impose an unbearable burden on the household. This definition also emphasizes that affordable housing should be considered as cases in which
5 UN-Habitat is the United Nations programme working towards a better urban future. Its mission is to promote socially and environmentally sustainable human settlements development and the achievement of adequate shelter for all.
9
housing price or rental cost leaves the occupier enough income to live on without falling below some poverty standard. The cost must not prevent the renter or occupiers from accessing other basic and necessary needs.
Bodie, Treussard and Willen, (2007) argued that owning a housing should not be considered as a consumption because if a household takes the decision to finance its own house with a mortgage, it is a way of transferring income from the future to the present time. This leads to the conclusion that when a borrower makes a mortgage payment, some portion of the payment goes to reduce the balance of the loan, thus increasing the net worth of the household. Therefore, based on the above assumption, lack of access to decent and affordable housing contributes to the exacerbation of lifetime poverty, as homeless households will be spending their current and future incomes as consumption in rent.
The second consideration of affordability in the literature on owner-occupation is discussed in terms of the ratio of housing costs to incomes or sizes of loans in relation to incomes. For example the conventional public policy indicator of housing affordability in the United States (USA) is the percentage of income spent on housing. Under the income ratio approach, housing expenditures that exceed 30 percent of household income have historically been viewed as an indicator of a housing affordability problem. However, Hancock (1993) criticized the definition of affordability based on the income as not being satisfactory as it leaves fundamental
questions unanswered. He noted “It is my contention that rent-to-income ratios provide, in fact,
very misleading information for economic policy” (p.129). Rather, the author argued, it is important to assess the burden associated with unaffordable housing in a broader context. Because the two variables (income and rent or mortgage) model of analysis is much narrowed and has been met with mixed views depending on the consumer’s preference and income size.
10
Despite the controversy in the definition of affordability, it is still rational to take into consideration income as a prime determinant of access to adequate housing. Newman and Newman and Holupka (2014) highlighted that in a situation in which housing is affordable, families theoretically have extra “give” in their budget to spend on other important products such as child enrichment activities, and health care, among others. In the US definition of affordability, there are two important determinants that are assessed for a house to qualify as affordable: median income earned by a household and the interest rate.
The comparison of the first and the second definition of affordable houses offer two main portraits as discussed by Gan and Hill (2008), affordability in terms of the ratio of income to house prices and the amount of income compared to mortgage repayments or rent. Gan and Hill’s (2008) model of home affordability does not significantly differ from the Hancock’s (1993) view, rather the former developed an explicit model for measuring housing affordability which is articulated in three main strands: (i) Purchase affordability which refers to the likelihood that a household is able to borrow the required money to purchase a house; (ii) Repayment affordability which consists of the burden imposed on a household while repaying the mortgage loan acquired and (iii) Income affordability which measures the ratio of house prices to households’ incomes.
The reviewed definitions of affordability follow the economic principles of demand and supply analysis. But they do not include the causal relationship with other variables that hinder a given family from falling under the housing unaffordability zone like socioeconomic conditions, employment status, and endowment of resources among others.
Also, scholars in housing and real estate market have illustrated the conventional determinants of housing supply and demand (See for example Phang et al. 1995; Ong & Sing
11
2002); Grimes & Aitken, 2006; Huang & Zhang, 2012). The common and agreed upon factors
are presented in the table 1 as presented below:
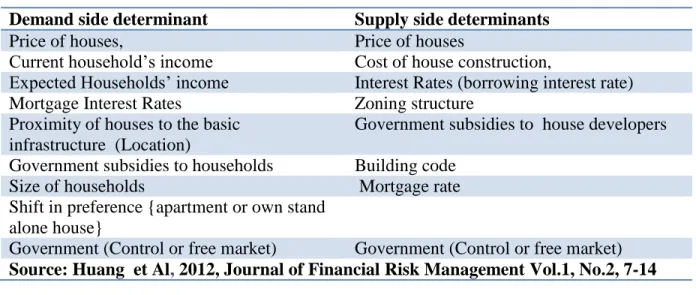
Table 1: The conventional determinants of housing market
Demand side determinant Supply side determinants
Price of houses, Price of houses
Current household’s income Cost of house construction,
Expected Households’ income Interest Rates (borrowing interest rate)
Mortgage Interest Rates Zoning structure
Proximity of houses to the basic infrastructure (Location)
Government subsidies to house developers
Government subsidies to households Building code
Size of households Mortgage rate
Shift in preference {apartment or own stand alone house}
Government (Control or free market) Government (Control or free market)
Source: Huang et Al, 2012, Journal of Financial Risk Management Vol.1, No.2, 7-14
Given that the conventional determinants focuses on prices, among other economic variables as mentioned in the table 1, important individual characteristics at household level, were not given too much attention in housing related studies. Therefore this study intended to partly fill that gap. Similarly, few studies merely focused on housing affordability, for example Bujang, Zarin and Jumadi (2010), and Center for Affordable Housing Finance in Africa (2014).
Note that the effect of lack of decent and affordable housing go beyond the income inequality, but tenants occupy houses that do not meet minimum standards of habitability and could endanger their life through increased violence, reduced self-esteem, exacerbated slum rising and informal settlement, reduced households savings and worsened income inequality (Hancock, 1991; Berry, 2006; UN Office of the High Commissioner for Human Rights (OHCHR), 2009; Wardrip, Williams& Hague, 2011).
12
Therefore, the analysis of socioeconomic factors affecting the households to access decent and affordable housing offers a wide view and apprehends the housing problem in detailed manner. Additionally, a review of housing policy and housing supply in Rwanda offers more comprehensive insight in improving living conditions of Rwanda and spur sustainable development. To conduct such task, researcher combined quantitative and qualitative analysis comprising major survey of data collected in 2011 in Rwanda covering most urban and rural areas, and assessment of housing policies in Singapore, Korea and Rwanda. The housing in Korea and Singapore offer a benchmark of successful cases of which Rwanda housing system should base on to fostering the development of housing sector for low and middle income people.
2.2. Decent and Affordable Housing in Comparative Perspective
Iacoviello (2009), and (2011) noted that “housing” was not part of mainstream economic research, and was confined to a subfield of economics named “real estate economics”. After the global financial crisis of 2008 which was mainly attributed to the real estate market failure, the attention being paid to the housing market drastically changed. Nowadays, spending on housing has attracted the attention to both public policy analysts and academic researchers. To deal with housing unaffordability challenges faced by different countries, governments adopted macroeconomic policies and financing mechanisms aimed at increasing the supply of houses at affordable prices with public funds.
Bertaud (2007), discussing affordable housing in China, noted that decent and affordable housing supply and demand should be handled as city specific issues, and further concluded that it was not possible to solve housing affordability issues at the national level, despite the national interventions on regulations and practices which may further have an impact on local markets.
13
This policy orientation in China leaves the critical question of whether cities are financially capable of financing the demand of decent and affordable housing in the highly volatile market and income per household is relatively stagnant.
Since 1953, Korea government is sternly committed to providing affordable and decent house and diverse long term efforts to establish a sustainable housing supply system were put in place with the aim to resolving the continued housing shortage issue among middle and low income citizens (Chungyu, 2012). Also policies aimed at supply of affordable houses successfully contributed to reduction of housing polarization among rich and low income people (Chungyu, 2012b).
Assessing Korean housing finance and development Mina et Al. (2013) categorized into three major periods, which, are organized in line with macroeconomic conditions that Korean economy experienced. (i) Before mid-1990s; (ii) after mid-1990s; (iii) After 1997 Asian Financial Crisis commonly known in Korea as IMF crisis. Before, mid 1990s, housing market was under ownership of and control by government through National Housing Fund (NHF) and Commercial Banks (HCB) or KOOKMIN. These institutions were government run banks and government of had full control of the housing market supply and funding. During 1994 onward, liberalization of interest rate spurred competitiveness for housing finance, and in 1996, the housing installment finance system was introduced and fund-raising and fund management through competition introduced housing finance through the private finance sector scheme. Furthermore the competition led to privation of the HCB. However, the monopolistic power of HCB was still present particularly in fund-raising in the form of housing subscription deposits. Due to Asian Financial Crisis of 1997/98, among other intervention measure took by the government of Korean to deal with the crisis, the role of the NHF was strengthened and
14 Housing
Loan
National Housing Fund Farm Housing
Improvement Fund Housing Loan Standard Loan Corporate Capital Loan Project Finance, Trust Fund, REITs
Jeonse Finance Finance from
Pre-construction Housing Sale
Public Fund Private Fund HF Guarant ee Securitization Institutional Financing Non-institutional Financing Housing Lease Protection System Housing Sale Guarantee
System H ousi ng fina nci ng
government intervention expanded to overcome the crisis in the housing sector. Also, the secularization mechanism was strengthened as it aimed at avoiding housing market speculation and real estate bubbles. Year 2005 on ward, real estate stabilization measures were introduced and strengthened because of continued speculation and skyrocketing of housing in Korean economy. Because of high price of housing, stricter conditions for mortgage loans imposed by government, the government of Korean introduced special rate for mid and low income households to afford cost of housing. Also, along the evolution of housing finance in Korean economy the following mechanism were used to finance housing: (i) national housing bonds, (ii) the housing lottery, (iii) housing subscription savings, (iv) collection of loan principals, (iv) interest income, and (v) the issuance of mortgage-backed securities.
15
Source: Mina et Al. A Primer on Korean Planning and Policy, Housing Finance, figure 1, p. 10.
Extending our review of housing supply to Singapore which is acknowledged to be among the top global successful case in affordable housing supply, it was observed that Singapore continually experienced shortage of housing since its independence in 1960s. The shortage was partly due to insufficient private sector resources, lack of capacity to provide adequate solutions resulting from large number of immigrants and as well as its growing population (Kyunghwan and Phang, 2013). However, due to aggressive intervention in housing market and continued effort by government in mobilizing finances, coupled with strong commitment of the Prime Minister Lee Kuan Yew (1959 to 1990) and his successors, the shortage of housing was drastically alleviated, currently (2015) Singapore has the highest homeownership rates (95% of households own heir flat house) (Wong, 2008). It was ascertained by different authors that this tremendous success was achieved because of significant role played by the government in housing supply and housing finance, and by the wealth that has been
created and distributed almost equally (Kyunghwan & Phang, 2013; Sock-Yong et Al, 2013). It
is important also to emphasize that, the tremendous achievement in housing supply is a result of program called “home ownership to people”. The program aimed at strengthening home ownership scheme for low income households’ and provided decent houses to individuals on 99 years lease basis. And individuals with specified income threshold could pay mortgage which was low to the amount they could have paid on rent at market price (Kyunghwan and Phang, 2013b). The “house ownership scheme” was under Housing and Development Board (HDB) and the latter was the only supplier of affordable housing in the country and under full ownership and control by the government of Singapore.
16
On the other hand, Rwandan economy is in rapid growth with 7.5% GDP growth in 2014 and 8.0% average GDP growth for ten (10) years, there is high likelihood that the experiences realized by china, Korea and Singapore in supply of decency and affordable housing are likely to occur as well. In that respect there is a need for preparedness by both government and housing supply agents. The next section snapshots the macroeconomic framework of Rwandan economy.
2.3. Rwandan economy and housing market
Rwanda is economically in developing economies with low income and the nominal per capita GDP was $652 or $418 real GDP per capita (World Bank, 2015). Over the past ten (10) years (2005– 2015) the economic data indicate that average economic growth was 7.7%, implying that the total GNI of Rwanda in 2005 has increased more than two times as per 2014. The available economic data by World Bank and National Institute of Statistics of Rwanda (NISR) indicated that in 2004, GDP Per capita (Current Price) was $ 225 while in 2014 GDP per capita was $630.
17
Source: World Bank micro-data 2014 analyzed by researcher
This threefold increase in income is attributed to the sound growth strategies being implemented by the GoR, which include economic liberalization measures, attraction of foreign direct investment (FDIs); effective use of development aid and accountable governance. With regard to the demography characteristics, Rwandan population increased from 8,128,553 in 2002, to 10,515,973 in 2012. The latter translates into 2.6% annual population growth rate over 10
years period, and, the population is expected to double in 2041. Currently (2015) Rwanda is 2nd
(second) most densely populated in Africa and 28th mostly densely populated globally with 415
persons per sq.km (NISR, 2014). The increase in population put pressures on arable lands as they are used for settlement and housing development at expense of farming activities.
18
The residential housing is already a pressing issue in urban areas of Rwanda. According
to official Statistics published by Rwanda Housing Authority (RHA)6 and International Growth
Center (IGC) showed that 78% of the new housing demand is among households with income which is less than 300,000 Frw/month (about $440), while the cost of standard - deemed to be affordable- house in Rwanda ranges between 30,000,000 Frw and 40,000,000 Frw (around $60,000 to $80,000) with average lending interest rate of 17.50% see table 2. And also rental cost of standard houses in Kigali is far beyond the median revenues, namely 300,000 Frw to
400,000 Frw; this adds to the fact that poverty headcounts ratio7 at $1.9 stood at 60.25% (World
Bank, 2012). Putting all together economic situational information on Rwanda, we can hypothesize that supply of affordable and decent housing is public apprehension that needs government intervention. The intervention should cater for both supply side and demand side and also provide ways for which middle and low income people can access decent housing. Also policy interventions should also look for both short run and in long run solutions with the aim of avoiding housing market price volatility effects. The following table illustrates the amount of loans and other macroeconomic variable (in thousands Frw) that financial institutions disbursed in housing compared to the other sector for a period of fourteen (14) years.
6 RHA is a public institutions primarily in charge of advising government on construction project, specifically its responsibilities include but not limited to [….] (i)to serve as overall project manager on behalf of the State for all projects related to housing and construction to advise the Government on the formulation of the policy on housing, urban development and construction; (ii) to conduct regular and thorough assessment of the status of urban areas and construction in Rwanda and survey requirements for additional housing; (iii) to promote the program for the provision of housing to individuals or assist them in building their own homes;
7 Poverty headcount ratio at $1.90 a day is the percentage of the population living on less than $1.90 a day at 2011 international prices. (http://www.worldbank.org/en/publication/global-monitoring-report) for a detailed
19
Table 2: Mortgage industry in "000" Rwandan Francs
Year Outstandin g Mortgage % change Newly allowed Mortgage loans % chang e Total Outstandin g loan Sh a re o f M o rt g a g e lo a n to o th er l o a n s Lendi ng rate GNI at constant Price G FC F A nn ual growth (%) 2001 15,106,600 - 6,307,600 - 81,424,000 18.55 17.29 1,793,453,291 1.93 2002 18,175,900 20.3 10,371,100 64.42 89,344,100 20.34 16.37 2,040,843,711 7.31 2003 20,751,000 14.2 10,696,000 3.13 101,901,900 20.36 16.45 2,060,868,175 10.24 2004 27,275,900 31.4 15,796,700 47.69 110,494,310 24.69 16.48 2,204,463,985 14.31 2005 33,731,500 23.7 21,447,900 35.77 136,370,200 24.74 16.08 2,369,126,967 15.16 2006 43,070,880 27.7 29,623,600 38.12 170,835,150 25.21 16.07 2,590,149,436 17.76 2007 57,039,600 32.4 45,391,500 53.23 219,377,020 26.00 16.11 2,800,615,743 27.84 2008 69,280,378 21.5 77,659,581 71.09 249,012,309 27.82 17.6 3,105,055,674 32.67 2009 41,559,937 -40.0 37,747,516 -51.39 316,764,418 13.12 16.3 3,300,573,152 2.87 2010 81,458,082 96.0 60,253,778 59.62 356,673,524 22.84 16.94 3,539,467,532 6.91 2011 131,441,295 61.4 91,792,152 52.34 432,743,314 30.37 16.73 3,812,000,000 9.33 2012 152,296,951 15.9 60,131,153 -34.49 495,889,539 30.71 16.82 4,128,523,062 21.84 2013 187,041,412 22.8 91,726,197 52.54 690,163,647 27.10 17.7 4,299,815,583 7.19 2014 269,889,282 44.3 118,407,537 29.09 900,730,567 29.96 17.52 4,601,467,095 9.41 Source: National Bank of Rwanda Annual Reports (2003-2014) 1USD = 721.8 Frw
The table 2 indicates that the mortgage loans have been increasing over past 14 years. But the increase of newly offered mortgage was characterized by sharp fluctuation of sharp rises and falls. The housing supply market in Rwanda is characterised by few number of housing suppliers led by Rwanda Social Security Fund (RSSB), - a public institution mainly responsible for pension funds collection and distribution- It focuses mainly on supply of high skyscrapers for business and government offices. There are also, few commercial banks which provide long term mortgage loans for 10 to 15 years. Due to time constraint, researcher could not gather micro data on amount of loans offered by commercials banks - this gap will be filled in by furthers studies
20
on this topic-. The mortgage loans are mainly used for building the new houses or for upgrading the existing residential settings. Also, Rwanda housing market is characterized by high interest rate varying between 17.5 to19.75 percent; increasing cost of land, and zoning which project the required housing standards are beyond the reach of the ordinary citizens who earn average or below national average income per household. As a result, middle and low income earners Rwandans residing in urban areas and suburbs occupying substandard housing and informal settlements continue to rise. Here, I can recall that the median income earners ($300 current market price) fail to afford rent cost and they similarly don’t fulfill eligibility conditions to be granted mortgage loan to set up quality housing without compromising other necessary (basic) expenditure. Furthermore, due to data unavailability on affordable house needs country wide with time series, it was not possible to quantify the needs of housing using exact figures; rather, we referred to survey data by assessing the existing housing stock and classified them taking reference to the housing characteristics.
2.4. Existing housing financing framework a comparative view
The concept of decent housing was not dominant in housing studies of recently successful countries in particular Korea and Singapore. At least in the reviewed papers it was almost unfeasible to scam information about decent housing in empirical literature. In this section we explore housing financing mechanisms used in Korea, Singapore and Rwanda.
21
Table 3: Housing financing frameworks in Korea, Singapore and Rwanda
Country Demand side Supply side Impact
Korea 1. Designing housing policy
which is tailored to income group
2. Application of differentiated
housing finance
2.1. Providing mortgage at low
interest to middle income group 3. Provision of long term rent to
low income people
4. Established Housing Finance
Credit Guarantee Fund
5. Established bonds and lottery
6. Price control of housing.
1. Government financed construction cost 2. Established national housing fund to finance major project of housing 3. Established housing
bond and lottery
4. Price control of
housing.
The ratio between housing units and the number of households have increased
nationwide from 72
percent in 1990 to 109.9 percent in 2008 (Igan & Kang, 2011).
Singapore 1. Government assisted housing
1.1. Public Rental Scheme: Providing minimum standard (decent) housing for low income people or households 1.2. Assisted home ownership
scheme: through Housing Development Board, offering flat house for sales at below market price,
1.3. Studio Apartment Scheme: Special scheme for old people (55 years and above).
1.4. Executive Condominiums: Private housing developer in cooperation with HDB for upper middle income group
2. Government assisted housing
financing:
2.1. Central Provident Fund for
home purchase by giving either loans or grants. 1. Housing and development Board (HDB): A sole institution responsible for housing supply and monitoring to low and middle income people
2. Design, Build and Sell Scheme: Private developers in housing supply.
More than 90% of
households in Singapore own their flats housing or stand-alone houses and only 3% of households unable to buy their flat housing receive housing subsidy for rent (Phang, 2007).
Rwanda 1. Housing market liberalized and
non-government intervention in housing market,
2. Individuals set up housing
structure according to their
1. Dominance of Rwanda pension fund9 to supply housing as relatively cost, More than 62% of
urban residents live in informal settlement,
Considering Kigali
22
Country Demand side Supply side Impact
financial capacity,
3. Settlement bank8 (state owned
bank used to offer long term mortgage loan at market rate).
2. Commercial banks
provide long term (10 to15
years)mortgage loans,
3. Commercial bank
offer long term real estate finances to residential housing developers.
supply gap of 89.1%. This include housing needing upgrade, those in poor conditions that needing demolition and need for new dueling units (City of Kigali, 2012),
Decent and affordable
housing are beyond the reach of many households. Source: City of Kigali, 2013; Sock-Yong Phang, in The Singapore Model of Housing and the Welfare State http://www.legco.gov.hk/yr12-13/english/sec/library/1213in15-e.pdf; Deniz Igan & Heedon Kang in Do loan to Value and Debt to income limit work? Evidence from Korea, 2011
9 Rwanda Social Security Board
8 In 2011, the government of Rwanda decided to liquidate the housing bank and its assets and liabilities were transferred to Rwanda Development Bank (BRD)
23
CHAPTER THREE: DATA AND METHODOLOGY
3.1. Overview
The section of data and methodology deals mainly with the methods and techniques used in the entire process of the research. It defines the types of data used in the analysis and statistical models performed in order to come up with reliable results. Referring to it as a study design, Grinnell and Williams (1990) and Kumar (2011) define a study design as the entire plan used by researchers to get answers of research question and reaching the study objectives. This research employed a mixed method of analysis, combining desk research and quantitative micro data analysis. By defining mixed research method, Stange et Al (2006) indicated that, it involves the concise integration of both quantitative and qualitative approaches to generating new knowledge. It is also emphasized that, using mixed research provides a better understanding of a research problem than using single research method.
3.2. Desk research and qualitative analysis
The desk review constituted the analysis of successful countries in the area of housing. The study used publicly available research report on the internet, KDI School library, and reviewed housing policies and performance of housing market in Singapore, South Korea among and UK. Also the housing policies and settlement in Rwanda were deeply investigated. The review of housing performance in successful countries was aimed at offering strong benchmark for policy measures to be adopted in Rwanda. It also offered an insight about the issues in housing market, which should be taken into consideration while designing, implementing and monitoring policies for decent and affordable housing in Rwanda.
24
3.3. Quantitative data analysis
The quantitative analysis of this study was characterized by empirical analysis of survey data collected at household level by the National Institute of Statistics of Rwanda (NISR) in 2011/12 and the survey comprises socio-economic variables which played major in understanding the factors constraining households to access decent housing in Rwanda. Since the survey data covered entire country, it was opportunity to apprehend the housing issue at national level and further more disaggregated by rural and urban residence settings. After data cleaning and responding eligibility check, the analysis covered 14,293 respondents or households. Among of them 2,147 (15%) respondents were residing in urban areas while 12,146 (85%) were residing in rural areas.
3.3.1. More about the survey data
The survey data used in this study is administered by the National Institute of Statistics of
Rwanda (NISR) under the name of Integrated Household Living Conditions Survey(IHLCS) or
Enquête Intégrale sur les Conditions de Vie des ménages in its commonly known name (EICV), is conducted every five years, as national survey, it provides information on changes in the well-being of the population such as poverty, inequality, employment, living conditions, education, health and housing conditions, household consumption, enterprises, wealth accumulation, among other social life aspect of households in Rwanda. Due to the fact, that the survey data address different individuals every, the study followed cross data analysis. The micro data are available for public access http://statistics.gov.rw/survey/integrated-household-living-conditions-survey-eicv.
25
3.3.2. Quantitative Methods Analysis and variables
The quantitative part played big role in the analysis of demand side. To assess the individuals factors affecting individuals to have a decent and affordable housing, discrete choice model or nonlinear regression was used. The following probit10 (Wooldridge, 2002; Williams, 2015) model was used to perform the analysis.
Yi= X’1+ ε (1)
Where is Yi is a dependent variable and X’B is the index function which include all independent
variables with coefficients 1 and ε is the error term. The estimation techniques following link function as presented in equation (2)
(2)
Where Pr denotes probability and Φ is the Cumulative Distribution Function (CDF) of the
standard normal distribution evaluated at . The parameters β are typically estimated by
maximum likelihood.
Different from Ordinary least squares, we reported the marginal probability effect and were estimated using the following formula
a) With continuous independent variable
When Xj is a continuous variable, the marginal effect probability will be
10 probit model is a type of regression where the dependent variable can only take two values (yi=1 for positive outcome or y=0 if otherwise
26
After differentiation, the marginal effect of Xj on Yi will be
b) For the case where Xj is a binary or dummy(ies) variable
Marginal probability effects are expressed in the following form:
Where,
is any vector regressor with Xij =1 and is any vector regressor with Xij =0
Therefore, including our variables of interest the model we get the following:
DECENT&AFFORDABLEi = β0 + β1GENDER + β2MARITAL_STATUS + β3AGE+
β4EMPLOYMENT + β5HHINCOME + β6HHINCOME*2+ β7 L IVESTOCK +
β8OWE-MONEY+ β9OWNING_NONFARM_ENTREPRISE + β10AGE^2 + β11 URBANI + ε (2).
Where, DECENT is an indicator variable created based on housing physical
characteristics. Any residential housing with the following characteristics was classified as decent: Exterior wall characteristics: i) mud brick covered with cement, ii) oven fired brick iii) cement brick; Main roofing characteristics: i) metal sheet, clay tile, and concrete; Main floor
material: i) wood floor; ii) clay tile; iii) cement and iv) brick. The AFFORDABLE is a dummy
variable with 1 value if, a household spends less or equal 30% its monthly household income on rent or mortgage. This respect DECENT&AFFORDABLE dependent variable is an outcome of
DECENT and AFFORDABLE variables. GENDER, it includes whether the respondent is female
or male. Marital status: It includes the responses on whether a respondent is married and live (4)
27
together with his/her partner or if his single or not living with his partner; AGE: refers to age of the respondents, the minimum age eligible for this study was 18 years; EMPLOYMENT: the analysis looked at whether a respondent is employed in skilled work or non skilled work. Mostly agriculture related work was named as not skilled. HHINCOME: Stands for households’
monthly income, LIVESTOCK: it includes the information whether a household own any type of
livestock. The latter constitute important wealth in rural areas. OWE-MONEY: This includes information on debt or credit owing household to others (financial institutions or non financial
institutions/ agents). NON-FARM_ENTREPRISES: This includes information on owning
nonfarm business by a household and AGE*2 imply how long individual stayed in a households squared and age squared respectively. These aimed at addressing nonlinear relationship effect of duration and ages of households’ respondents. URBANI: Whether a household is located in rural or in urban areas. The latter was considered constitutes an important differential in household welfare.
28
CHAPTER FOUR: ANALYSIS AND INTERPRETATION OF FINDINGS
4.1. Introduction
This chapter highlights key findings from the analyzed data. It comprises two main complementary sections which present a comprehensive picture of housing in Rwanda. The section one indicates the information about housing status in Rwanda. This section was dominated by descriptive statistical analysis. The table and bar chats were presented to enable the visualization. The section two presents the information on factors affecting constraining households in accessing decent and affordable housing using regression models.
4.2. Housing occupation status in Rwanda
Based on the definition and metadata handbook of National Institute of Statistics of Rwanda (2014), housing status is defined through four main categories:
2. Clustered rural settlements or grouped rural settlements, also referred to as Umudugudu in the national language;
3. Dispersed/isolated housing, also referred to as scattered settlements;
4. Planned urban housing and;
5. Spontaneous/squatter housing or informal settlements also referred to as Akajagari in the
national language.
The figure 3, illustrates the structures of Rwanda households status as per 2012, nationally, urban and rural area.
29
Figure 3: Status of Settlement in Rwanda
Source: NISR, household Census, analysed by researcher
Figure 3 indicates that nationally, 49.9% of houses are agglomerated housings, 34.3% are dispersed housing (unplanned), 13% are squatter housing or informal while planned housing accounts only 2.3%, while only 0.6% was reported to be other form of housing. Disaggregated analysis by rural-urban settings indicates that, in urban areas big percentage of households are staying in informal or squatter settlement with 55.7%, and 11.2% of housing are in unplanned settings while in total 32.4% housing are in agglomerated and planned areas. In rural areas, 55.7% of urban areas residents are in agglomerated or grouped housing, and 43% of housing are unplanned or squatter housing.
4.3. Houses and Living arrangement
By taking into account the living arrangements in Rwanda also there are four classifications: i) House occupied by one household; (ii) House occupied by several households;
30
(iii) Storey building occupied by one or more households; and (iv) Several buildings in a compound occupied by several households.
According to the above mentioned settlement classifications, the general population and census 2012 indicated that 90% of the 2.42 million private households in Rwanda are each occupied by one household while about 9% are occupied by several households, and households in the category ‘Several buildings in a compound occupied by several households are rare in the country, and they were representing only one percent’ (NISR, 2014).
The percentage of houses with one household occupier reduces in urban compared to the urban area. The census data revealed that 63% of the households in urban areas are occupied by one household while this percentage is about 96% in rural areas. And in Urban areas, 31% of houses were occupied by multiple households. By 2012, storey buildings occupied by one or more households represent 0.3% in urban areas and none observed in rural areas.
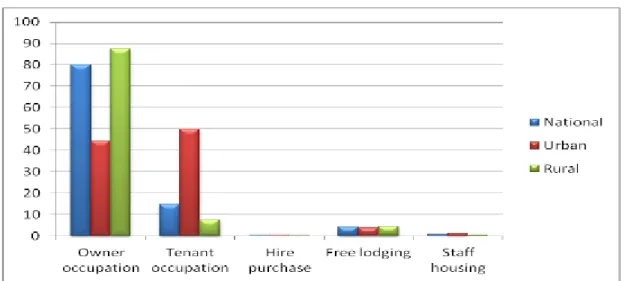
4.4. Housing Tenure status in Rwanda
In Rwanda, there are six types of legal tenures under which a household can occupy a house: i) Owner occupation; (ii) Tenant occupation; (iii) Hire purchase; (iv) Free lodging; (v) Staff housing; and (vi) Refuge/temporary camp settlement.
The General population and housing census of 2014 revealed that 80% of Rwandan households are under owner occupation category, at national level 15% households are tenants and four percent (4%) are free lodging. The tenure structures differ largely in urban and rural areas because 44.6% of urban against 87.4% of rural areas are owner occupier; tenants or rental housing comprises 49.9% in urban areas against only 7.5% in rural areas.
31
Figure 4: Housing tenure status
Source: 4th General Population and Housing Census data analyzed
4.5. Private housing physical conditions/characteristics 4.5.1. Private houses walls characteristics
Table 4: Material of walls of private housing
Material of exterior wall
Urban (%) N= 2,147) Rural (%) N= 12,146 National (N=14,293) Mud bricks 18.8 39.5 36.4
Mud bricks covered with
cement 42.06 13.9 18.1
Oven fired bricks 8.01 1.6 2.6
Cement bricks 1.63 0.0 0.3
Wooden planks 0.19 0.7 0.6
Stones 0.05 0.2 0.2
Tree trunks with mud 17.93 38.8 35.7
Tree trunks with cement 11.18 4.6 5.6
Plastic sheeting 0 0.1 0.1
Other 0.2 0.6 0.6
Total 100.0 100.0 100.0
Source: EICV 2011/12 Data analyzed by researcher
As presented in table 4, a big percentage (36.4%) of Rwandan private housing is
32
representing 35.7%. However this pattern largely differs when compared rural and urban exterior wall housing characteristics. The dominant characteristics in urban area is mud bricks covered with cement which represent 42.06%, followed by Mud bricks with 18.8% and Tree trunks with mud with 17.93%. The rural housing is mainly characterized by mud bricks 39.5% followed by tree trunks with mud with 38.8% respectively. In this respect, more housing fall under category of decent house in rural areas compared to urban areas. The distribution of decent and non-decent housing by residence settings shall be presented in figure 5.
4.5.2. Private house and roofing characteristics Table 5: Roof characteristics
Material for roofing Urban (N=2,147) Rural (N=12,146) National (N=14,293) Thatch or leaves 0.61 2.4 2.13 Metal sheets 78.71 48.13 52.73 Clay tiles 20.26 48.48 44.24 Concrete 0.23 0.03 0.06 Bamboo 0 0.04 0.03 Plastic or plywood 0.09 0.86 0.74 Other 0.09 0.07 0.07 Total 100 100 100
Source: EICV 2011/12 Data analyzed by researcher
The leading main material of private housing on roofing of residential in Rwanda is metal sheet, with 52.7% nationally followed by clay tile with 44.2%. In urban area setting, metal sheet is cover 78.7% of all roofing, while clay tiles cover 20.2%. And in rural area both clay tile and metal sheet have almost similar percentage 49.1% and 48.4% respectively. Other roofing characteristics have small percentage either in rural or in urban settings.
33
4.5.3. Types of Floor in private households of Rwanda Table 6: Floor characteristics
Main floor materials
Urban (N=2147) Rural (N=12146) Total (N=14293) Beaten earth 42.24 84.72 78.34 Hardened dung 1.07 2.52 2.3 Wooden floor 0 0.06 0.05 Clay tiles 2.93 0.04 0.48 Cement 51.33 10.86 16.94 Bricks 2.19 1.54 1.64 Other 0.23 0.26 0.26 Total 100 100 100
Source: EICV 2011/12 Data analyzed by researcher
The main characteristic of floor of private housing in Rwanda is beaten earth representing 78.3% nationally, the disaggregated analysis indicates that beaten earth represent, 84.7% in rural areas, while in urban areas it represent 42.2% of all floor characteristics. Also it is important to note that the dominant characteristic of floor in urban areas is cement with 51.3% while in rural areas the housing with cemented floor is only 10.8%.
Combining the above highlighted characteristics (exterior wall, roofing and floor) of housing in Rwandan, it is important to underline the following: (i) in overall the existing housing markets in Rwanda needs extended reforms which should put in place residential houses fulfilling the minimum acceptable standards. (ii)There apparent and significant difference in urban and rural settlement (iii), based on the definition of decent housing, a big number of households suffer lack of decent housing in Rwanda. Recall than a minimum standard for habitable housing should be covered on floor, walls and roofing with durable and health friendly materials.
34
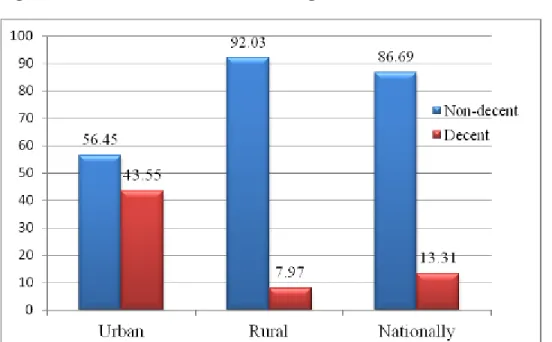
4.6. Decent and affordability characteristics of housing 4.6.1. Decent house characteristics
As it was indicated in the methodology section, this study considered a house to be decent if the following physical characteristics were met:
Exterior wall characteristics: i) mud brick covered with cement, ii) oven fired brick iii) cement brick; Main roofing characteristics: i) metal sheet, clay tile, and concrete; Main floor material: i) wood floor; ii) clay tile; iii) cement and iv) brick. Part of the house of the condition is required for a housing to qualify being named decent.
Figure 5: Decent and Non decent housing in Rwanda
Source: EICV 2011/12 Data analyzed by researcher
Comparing urban and rural housing, the figure 5 indicates that 56.4% of housing in urban areas presents certain characteristics of being named as no decent, while in rural areas almost 92.0% of housing has some of characteristics making them not decent. Based on our model of categorization of decency and non-decency of housing, only 7.97% of housing in rural areas is
35
decent. While in urban areas, the percentage is significantly big (43.5%). Extending the analysis at national level, the data indicates 86.6% of houses do not meeting the requirement for being decent and only 13% of housing can be called decent.
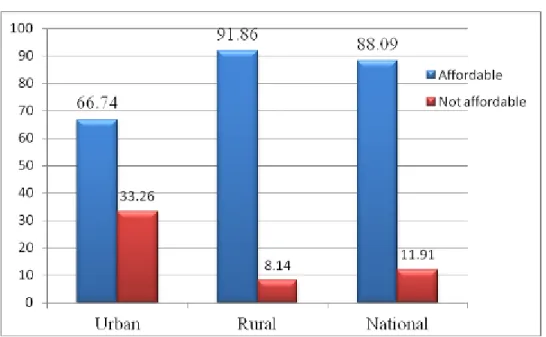
4.6.2. Housing affordability in Rwandan households
As discussed in section 2.2 and taking into consideration of the housing affordability concept as defined by Hancock (1993) among other scholars, any household spending more than 30% of its monthly income, was named as having housing affordability issue. In the figure 5, we present the distribution of affordability issues by households.
Figure 6: Affordability distribution: Rural and Urban analysis
Source: EICV 2011/12 Data analyzed by researcher
Households residing in rural are less affected by affordability issue. In urban areas 33.2% of households fall under the unaffordability condition, while in rural only 8.1% of households was belonging in that category. At national level, 11.9% of household confronted with the issue of affordability. This behavior is explained by the fact households rationalize their expenditure
36
by choosing non-decent house instead of renting non-affordable and decent housing. A combined
analysis of both decent and affordable housing provided the following results. See figure 6
Figure 7: Decent and affordable housing
Source: EICV 2011/12 Data analyzed by researcher
The figure 7 indicates, a composite variable indicator of decent and affordable housing in Rwanda, indicates that 24.7% of households are in decent and affordable housing in urban areas, while in the rural areas the rate drastically goes down to 6.2%. Nationally, 9% of housing is meet both decent and affordability characteristics. This variable is considered as dependent variable and regressed to other socioeconomic factors in order to assess which factors affecting households in access both decent and affordable housing. In the next section we present the regression results.
37
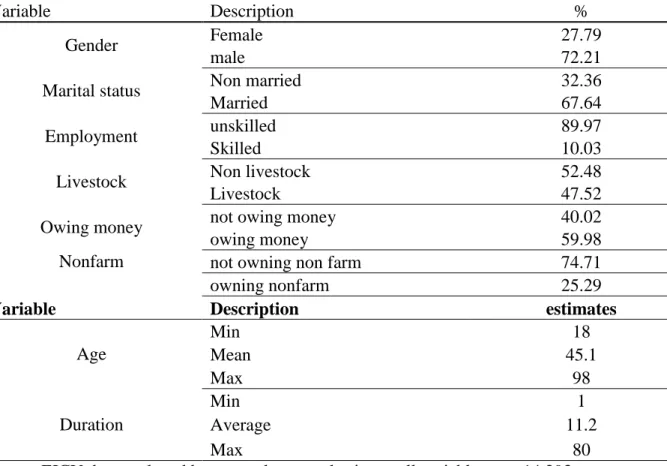
4.7. Decent and affordable housing: Regression results 4.7.1. Summary statistics of variables
Table 7: Summary statistics on key variables
Variable Description %
Gender Female 27.79
male 72.21
Marital status Non married 32.36
Married 67.64
Employment unskilled 89.97
Skilled 10.03
Livestock Non livestock 52.48
Livestock 47.52
Owing money not owing money 40.02
owing money 59.98
Nonfarm not owning non farm 74.71
owning nonfarm 25.29
Variable Description estimates
Age Min 18 Mean 45.1 Max 98 Duration Min 1 Average 11.2 Max 80