Supporting Information
Multi-Response Shape Memory Nanocomposite with Reversible Cycle for Powerful Artificial Muscles
Chi Chena, Yangyuanchen Liub, Ximin Hec, Hua Lia, Yujie Chen*a, Ying Weid, Yusen Zhaoc, Yanfei Mac, Zhen Chena, Xu Zhenga, and Hezhou Liu*a
a State Key Laboratory of Metal Matrix Composites, School of Materials Science and Engineering, Shanghai Jiao Tong University, Shanghai 200240, China.
b University of Michigan-Shanghai Jiao Tong University Joint Institute, Shanghai Jiao Tong University, Shanghai 200240, China
c Department of Materials Science and Engineering, University of California, Los Angeles, Los Angeles 90095, USA
d College of Engineering and Applied Sciences, Nanjing University, Nanjing 210046, China * Corresponding author
Supplementary 1: Shape memory behavior and artificial muscle performance test 2 1 1 = 1 100% f L L R L − − × (S1) 3 0 r 0 = 1 L L 100% R L − − × (S2)
Where L0represents the initial length, L1 represents the deformation length at the room temperature, L2 represents the fixation length after partial elastic contraction, and L3 represents the final length after the recovery process (Figure S24).
load ( - )2 3 M g L L W M × × = (S3) load ( - )2 3 M g L L P M t × × = × (S4)
Where Mloadand M represent the mass of the load and deformation section of the sample, respectively. Meanwhile, g represents the acceleration of gravity, and its value is 9.8 N kg-1, while t represents the response time, which is obtained by a high-speed camera.
Supplementary 2: Finite element analysis
𝐼𝐼(𝑥𝑥) =𝐼𝐼0𝑒𝑒−𝑥𝑥𝑥𝑥𝑑𝑑 (S5)
Based on Beer-Lambert’s law, the resulting deformation was governed by incident light intensity 𝐼𝐼0, molecular alignment coefficient (𝜃𝜃: the angle between liquid crystal orientation and the incident light), and absorption length 𝑑𝑑 (𝑑𝑑 = 1.6 μm). The photo-compliance (𝑃𝑃∥= 1.7 cm2 W-1 and 𝑃𝑃
⊥= −0.7 cm2 W-1) correlated the absorbed light 𝐼𝐼(𝑥𝑥) (𝑥𝑥 is the position vector) and the induced strain 𝜀𝜀𝑙𝑙𝑙𝑙𝑙𝑙ℎ𝑡𝑡:
Where 𝜑𝜑 is the weight fraction of azobenzene (𝜑𝜑= 0.5). This yielded the resulting stress 𝜎𝜎𝑙𝑙𝑙𝑙𝑙𝑙ℎ𝑡𝑡:
𝜎𝜎𝑙𝑙𝑙𝑙𝑙𝑙ℎ𝑡𝑡,𝑦𝑦 =𝐶𝐶11𝜀𝜀𝑏𝑏𝑏𝑏𝑏𝑏𝑑𝑑𝑏𝑏𝑏𝑏𝑏𝑏𝑠𝑠𝑙𝑙𝑠𝑠2𝜃𝜃+𝐶𝐶−𝜀𝜀22𝑙𝑙𝑏𝑏𝑏𝑏ℎ𝑡𝑡𝑐𝑐𝑐𝑐𝑠𝑠,𝑦𝑦2𝜃𝜃, (S7)
Where 𝐶𝐶11 and 𝐶𝐶22 are elasticity moduli, respectively. In our case, 𝐶𝐶11=𝐸𝐸⊥= 187.55 MPa, 𝐶𝐶22 =𝐸𝐸∥=86.56 Mpa. And the light-induced bending radius 𝑟𝑟 became:
𝑟𝑟= 𝜑𝜑𝑥𝑥3
6𝐼𝐼0𝑃𝑃𝑃𝑃�−2𝑃𝑃+2𝑃𝑃𝑒𝑒−𝑥𝑥𝑥𝑥𝑑𝑑+𝜑𝜑𝑥𝑥+𝜑𝜑𝑥𝑥𝑒𝑒−𝑥𝑥𝑥𝑥𝑑𝑑�
, (S8)
For heat transient problem inside the sample, the variation of temperature could be described by
𝐶𝐶𝑣𝑣𝜕𝜕𝜕𝜕𝜕𝜕𝑡𝑡− 𝑘𝑘𝑓𝑓∇2𝑇𝑇= 𝐻𝐻(𝑥𝑥,𝑦𝑦), (S9) Where 𝐶𝐶𝑣𝑣 is the specific heat capacity per unit volume, 𝑘𝑘𝑓𝑓 is the thermal conductivity of the sample. 𝐶𝐶𝑣𝑣 = 229 J mol-1 K-1 and 𝑘𝑘𝑓𝑓 = 0.35 W mol-1 K-1
Moreover, the temperature-induced strain became:
𝜀𝜀𝜕𝜕 =𝐿𝐿(𝑇𝑇)/𝐿𝐿0−1 (S10) Where 𝐿𝐿 is the length of the sample along the 𝑥𝑥-direction, 𝐿𝐿0 is the length of the sample in the initial state (𝐿𝐿0 = 20 mm in the simulaiton).
The total strain yielded:
𝜀𝜀𝑡𝑡𝑐𝑐𝑡𝑡𝑡𝑡𝑙𝑙 = 𝜀𝜀𝑒𝑒𝑙𝑙𝑡𝑡𝑠𝑠𝑡𝑡𝑙𝑙𝑐𝑐+𝜀𝜀𝜕𝜕 (S11)
Scheme S1 Synthetic routes of (a) AZO-diOH, (b) AZO11, and (c) PU.
Scheme S2 Preparation of (a) water-soluble nanorods and (b) oil-soluble Au-nanorods.
Figure S1 FTIR spectra of 4-ethoxyanilin, AZO-OH, and AZO-11
Figure S2 FTIR spectra of p-ABA and AZO-diOH.
Figure S41H NMR spectrum of AZO-OH.
Figure S51H NMR spectrum of AZO11.
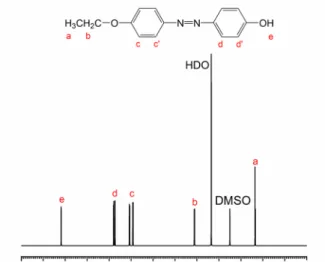
Figure S71H NMR spectrum of PU.
Figure S9 LC-MS results of AZO11.
Figure S10 LC-MS results of AZO-diOH.
Figure S11 DLS curve of the gold nanorods solution.
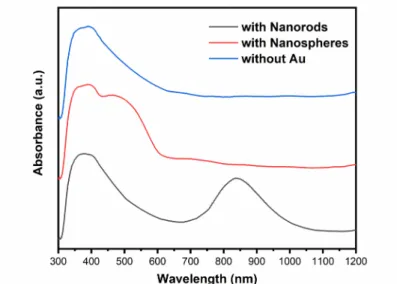
Figure S13 UV-vis absorption spectra of gold nanoparticles.
Figure S14 TEM images of the gold nanorods in (a-c) water-based solution and (d-f) DMF.
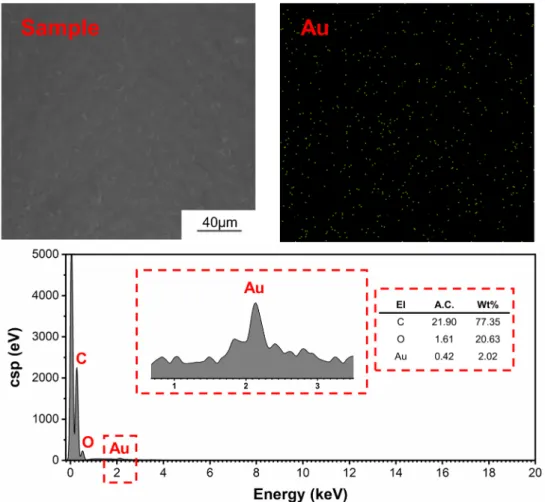
Figure S15 SEM image of the surface and EDS analysis of the component of PCL-AZO11/Au (El for element, A.C. for apparent concentration).
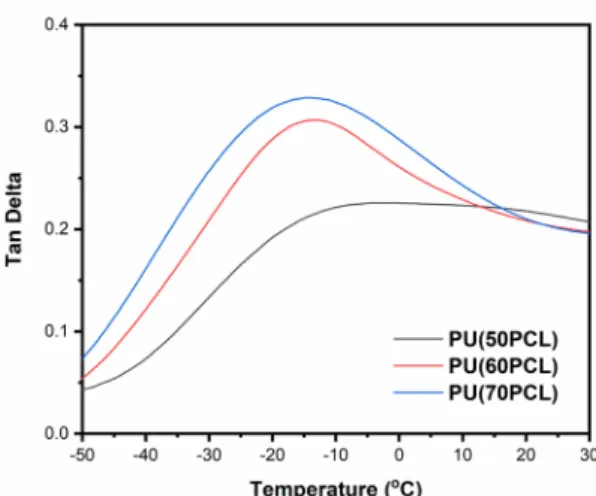
Figure S17 Tan Delta in DMA of samples PU-5AZO11 with different PCL content.
Figure S18 DSC diagram of AZO11 in a heating-releasing cycle.
Figure S19 DSC curves of PCL-diOH, PU(50PCL), and PU-5AZO11(50PCL) in a
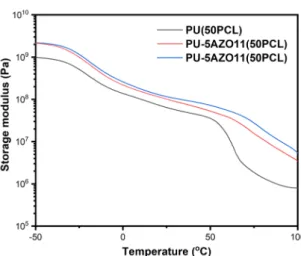
Figure S20 DMA diagrams of composites with different AZO11 and Au content.
Figure S21 Tan Delta in DMA of samples with different AZO11 content.
Figure S22 POM images of liquid crystal enhanced composite
Figure S23 (a) XRD patterns and (b) POM images of the composite PU/Au(50PCL) with different content of AZO11.
Figure S24 Schematic diagram of the responsive performance test.
Figure S25 Optical images and SEM images of re-writing performance of
PU/Au(50PCL) with (a) 10.0wt%, (b) 7.5wt%, (c) 5.0wt% and (d) 2.5wt% AZO11.
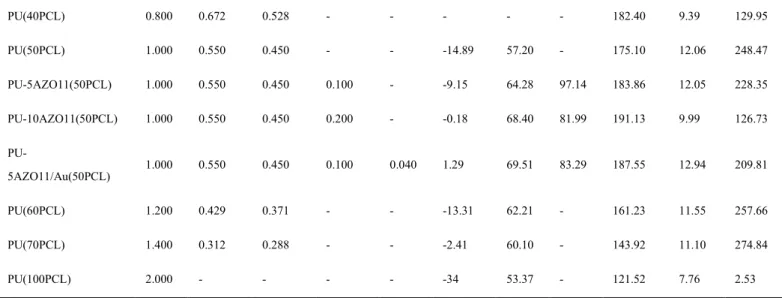
Table S1 Sample numbers with various proportions and properties of composites.
Sample No. PCL [g] AZO-diOH [g] HDI [g] AZO11 [g] Au [g] Tg [oC] Tm [oC] Tcp [oC] E [MPa] σB [MPa] εB [%] PU(30PCL) 0.600 0.792 0.607 - - - 205.34 9.43 13.92
PU(40PCL) 0.800 0.672 0.528 - - - 182.40 9.39 129.95 PU(50PCL) 1.000 0.550 0.450 - - -14.89 57.20 - 175.10 12.06 248.47 PU-5AZO11(50PCL) 1.000 0.550 0.450 0.100 - -9.15 64.28 97.14 183.86 12.05 228.35 PU-10AZO11(50PCL) 1.000 0.550 0.450 0.200 - -0.18 68.40 81.99 191.13 9.99 126.73 PU-5AZO11/Au(50PCL) 1.000 0.550 0.450 0.100 0.040 1.29 69.51 83.29 187.55 12.94 209.81 PU(60PCL) 1.200 0.429 0.371 - - -13.31 62.21 - 161.23 11.55 257.66 PU(70PCL) 1.400 0.312 0.288 - - -2.41 60.10 - 143.92 11.10 274.84 PU(100PCL) 2.000 - - - - -34 53.37 - 121.52 7.76 2.53
Table S2 Artificial muscle application test with varied load (the weight of clip is 2.9525 g and the effect of buoyancy has been taken into account in the calculation of work density). No. L0[mm] L2[mm] L3[mm] Mload[g] ∆h[mm] T[oC] M[g] Rr[%] W [kJ kg-1] t[s] P [W kg-1] 1 22.98 65.80 65.80 27.9528 0 25 0.0235 -86.34 0 - - 2 18.64 51.10 18.68 27.9528 32.42 60 0.0183 99.79 0.4211 - - 3 17.46 56.90 17.55 52.9528 39.35 60 0.0124 99.48 1. 5332 - - 4 19.32 48.98 21.90 77.9528 20.18 60 0.0188 86.65 0.7811 - - 5 20.32 61.36 57.26 102.9528 4.10 60 0.0138 -81.79 0.2890 - - 6 21.34 63.66 21.40 52.9528 42.26 >60 0.0251 99.72 0.8737 0.6567 1330.53 7 21.34 63.66 22.40 52.9528 42.02 >60 0.0251 95.03 0.8688 0.6667 1303.13
Movie S1 Shape recovery behavior induced by heat at 60 oC. The movie is shown with 1.0 × speed.
Movie S2 Shape memory performance at different temperatures. The movie is shown with 0.1 × speed.
Movie S3 Artificial muscle performance at room temperature and over critical point. The movie is shown with 1.0 × speed.
Movie S4 Artificial muscle performance over critical temperature with the varied load. The movie is shown with 1.0 × speed.
Movie S5 Artificial muscle performance through ten cycles. The movie is shown with 0.1 × speed.
Movie S6 Re-writing performance induced by heat at 100 oC. The movie is shown with 2.0 × speed.
Movie S7 Photo response performance induced by UV at 365 nm with one end fixed. The movie is shown with 1.0 × speed.
Movie S8 Photo response performance induced by NIR at 800~900 nm with one end
fixed. The movie is shown with 1.0 × speed.
Movie S9 Photo response performance fixed induced by UV at 365 nm with both ends fixed. The movie is shown with 1.0 × speed.
Movie S10 Photo response performance fixed induced by NIR at 800~900 nm with