Selecting Test Signals for Successful Impairment Classification
in VoIP Systems
Doris Bao
1,2, Luca De Vito
1, Sergio Rapuano
11
Dept. of Engineering, University of Sannio, Corso Garibaldi, 107, 82100 Benevento, Italy Ph.: +39 0824 305817, Fax: +39 0824 305840, E-mail: {doris.bao, devito, rapuano}@unisannio.it,
http://lesiml.ing.unisannio.it
2
Telsey Telecommunications SpA, Research and Development Laboratory, via dei Sanniti, 1, 82018 San Giorgio del Sannio (BN), Italy. Ph.: +39 0824 330145, Fax: +39 0824 330145, http://www.telsey.com
Abstract –The paper proposes a metrological analysis for selecting the test signals to be used with a
method for the automatic classification of impairments in VoIP telecommunication systems. The method is able to identify the VoIP network impairments which decrease voice quality, by analyzing the power of a test signal during the call. Test signals, considered in this work, comprise speech-like signals, non- speech-like deterministic signals and non- speech-like stochastic signals, taken either from standard specifications or from literature papers on voice quality assessment. In order to evaluate the optimal test signals, two network emulators have been used to add the impairments in a controlled test network. The selected test signals improve significantly the method performance in terms of classification success rate and test duration.
I. Introduction
In the last years, the telecommunication market is evolving from traditional telephone networks to the Voice over IP (VoIP) technology. VoIP systems are very attractive to broadband communication service providers. The use of the same network for voice and data services allows providers to save on equipment, operation and maintenance costs. Moreover, VoIP offers important opportunities for the telecommunications market to deploy more advanced services. The creation of new services like voicemail, conference, instant messaging, presence indication, and so on, is made easy by migrating to IP-based converged networks.
On the other hand, IP networks are not designed to carry voice traffic. The main concern of VoIP networks is in achieving a voice quality which is comparable with the traditional telephone service, even if the network does not guarantee a real-time behavior. In order to have an acceptable voice quality, transmission of voice traffic demands strict requirements on packet loss, delay, and jitter, which are even more challenging in presence of other multiple data streams in the network [1]. Service providers need to constantly monitor their networks to detect service quality degradation and take corrective actions to ensure an acceptable quality. Hence, it becomes essential to understand the contribution of IP network impairments on the voice quality [2].
Evaluating the QoS of a VoIP system means to estimate the end user call quality perception. Algorithms such as MOS (Mean Opinion Score) [3], based on sensorial classification and conversation opinion scale of the voice quality, and objective algorithms, such as PSQM (Perceptual Speech Quality Measurement) [4], PESQ (Perceptual Evaluation of Speech Quality) [5], and PAMS (Perceptual Analysis Measurement System) [6], estimate the voice quality but do not give any information about the related network impairments that cause the voice quality degradation.
On the other side, some objective techniques [7], based on the state analysis of the IP network, rely on models to map the network performance parameters to the user perception of voice quality. By means of such techniques, for example, router statistics on queuing delay for the voice packets are used to obtain a voice quality evaluation. However, these approaches strongly depend on the accuracy of complex cognitive models, as they do not perform an analysis directly on the voice signal at the receiver side.
In [8] and [9], a novel impairment classification method has been suggested. It allows retrieving the causes of the voice degradation in an IP network, by performing measurements on the power loss of the voice test signal at the receiver side. The method identifies the causes of voice quality degradation in an objective way without relying on complex models, directly from the received signal waveform. Therefore it takes in account all the possible impairments between the end sides of a VoIP communication channel instead of analyzing only the data traffic statistics.
The method has been implemented in a VoIP gateway, in order to allow the service provider to execute tests directly from the central office.
The paper presents an experimental research of the most suitable test signals to be used with the method reported in [8]. Some test signals have been analyzed in order to select those which guarantee the best classification rate of the impairments. The impairments have been added in a controlled test environment by means of two network emulators, in order to value the correctness of the estimates. The paper is organized as follows: Section II recalls the VoIP impairment classification method, Section III deals with the selection of the test signals considered for the impairment classification method. Finally, in Section IV, the results about the use of the different signals are reported.
II. Impairment classification method
The voice quality perceived by a user of a VoIP connection may suffer from three main types of time-varying degradation: (i) random packet loss, (ii) high-value jitter, and (iii) network congestion [10]. Random packet loss determines a signal degradation due to temporary network conditions, when the packet is not received or it is discarded by the VoIP device. Jitter, which is defined as the standard deviation of the delay, is caused primarily by queuing and processing delays of IP packets, along a transmission path. Usually, a VoIP gateway has a buffer to smooth out the jitter. However, when severe jitter happens, which causes an accumulation of packets in the buffer, a number of packets will be dropped to re-synchronize the transmission. Network congestion leads to periodic packet losses, due to the continuous filling and emptying of the network device tails.
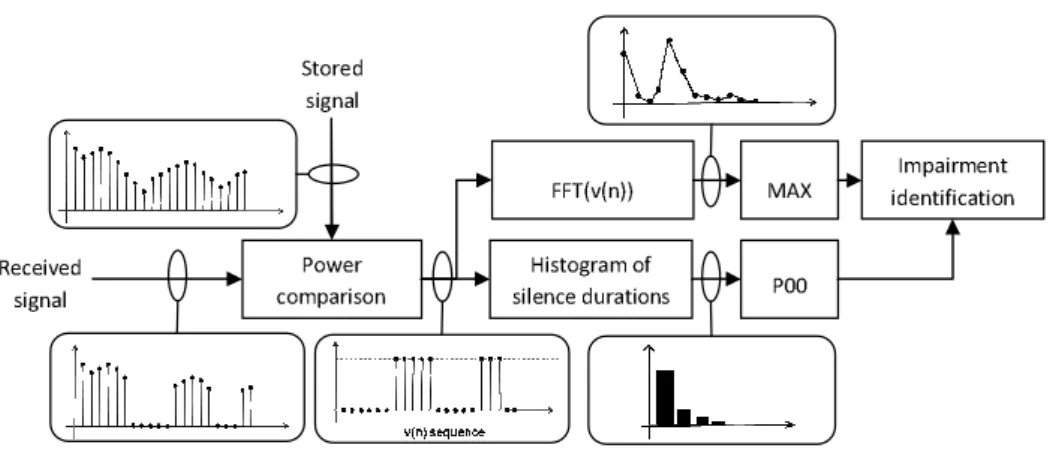
In [8] and [9], it has been shown that the presence of these impairments can be detected by analyzing the power loss distribution of a test signal on the receiver side. In fact, the power loss is correlated to the specific network impairment, which affects the transmission path. The classification instrument consists of an analyzer unit, at the receiver side, which compares the received test signal with its original copy, which has been previously stored in the memory (Fig.1). A comparison between the power levels of the two signals discriminates the natural voice silence from the silences due to packets loss. Then, a matching pattern v[n] is determined: for each sample n of the received signal, v[n] is 0 if
the sample n belongs to a power loss interval, and 1, otherwise. A histogram hi of the power loss
interval durations is calculated from v[n]. Then, the joint probability P(00), which expresses the dependence between the power losses in consecutive time intervals, is estimated by the equation (1):
( )
∑
( )
= − ⋅ = N i i i h P 1 1 00 (1)Finally, the maximum value M of the fast Fourier transform of the sequence v[n] is calculated. The network impairment is finally classified by comparing the obtained values of M and P(00) with two thresholds, determined from an experimental calibration phase, which allows the system to mark (i) random packet loss, (ii) high-value jitter, and (iii) network congestion, as shown in Fig. 2.
III. Test signals
The choice of a suitable test signal could be central for the
0 500 1000 1500 2000 2500 3000 0 0,1 0,2 0,3 0,4 0,5 0,6 M P00 Packet loss Jitter
Fig. 2. The obtained values of P(00) and M are compared with detection thresholds determined experimentally. Fig.1. Steps of the impairment classification method.
Power comparison
Histogram of silence durations
FFT(v(n)) MAX identification Impairment
P00 Stored
signal
Received signal
correct use of the VoIP impairment classification method [8]. A proper test signal could enhance the impairment classification method, allowing to obtain a more accurate determination of robust classification thresholds and, therefore, to increase the classification success rate while minimizing the duration of the measurements.
An optimal test signal will provide quality testing without depending on the characteristics of actual speech. The candidate test signals have to be repeatable and should not influence the network under test in order to generate reliable and comparable results. Test signals, already used for detailed evaluations in the field of Voice Quality Measurement (VQM) [3-5] in telecommunication networks, have been analyzed, in order to select the optimal test signals for the impairment classification method.
Traditional test signals are classified into speech-like (voice) signals and non-speech-like (fully artificial) signals. Moreover, the artificial ones are divided into deterministic and random signals [11]. Deterministic signals can be defined by a formula which fully describes the signal in time or frequency domain, while random or stochastic test signals have to be defined by a probability density function (pdf) or a Power Spectral Density (PSD).
In order to select the test optimal signals the paper proposes a comparative analysis using: (i) two non-speech-like stochastic signals, such as white random noise, pink random noise, suggested by ITU-T P.501 [11], (ii) two non-speech-like deterministic signals: the optimized multi-sine and the chirp signal, (iii) a natural voice signal suggested by the ITU-T P.862 [5], and (iv) a composite source signal, suggested by ITU-T P.501 [11], for the speech-like category.
A. Non-speech-like stochastic signals
Random or stochastic signals are typically used [11] for linear time invariant systems to determine broadband levels or levels in fractal octave bands. In addition, these signals may be used to determine the transfer characteristics in the frequency domain such as frequency response or loudness ratings. This paper investigates the use of white and pink noise as test signals to classify the VoIP network impairments. White noise is a signal with a flat power spectral density; instead, the pink noise has a frequency spectrum such that the power spectral density is proportional to the reciprocal of the frequency.
B. Non-speech-like deterministic signals
Two signals belonging to this class have been considered in the performed analysis. They are the optimized multi-sine and the chirp signal.
In [12] it has been demonstrated the effectiveness of the multi-sine signal in the case of VQM. Multi-sine signal [12] is easy to generate. It is the sum of Multi-sine waves characterized by (i) assigned amplitude, (ii) assigned spaced frequencies, and (iii) different phases at each frequency to avoid peaks in the time domain causing the saturation of the electronic devices. The mathematic function describing the multi-sine waveform is:
( )
∑
= Φ + = N i i i i ft A t x 1 ) 2 cos( π , (2)where fi =li ⋅f0, with l positive integer and i fmin≤ fi≤ fmax. In order to reduce the crest factor, the
phase can be determined according to the Schroeder expression:
π N i i i ) 1 ( − − = Φ . (3)
The resulting signal defined by (2) and (3) is denoted as optimized multi-sine signal.
The optimized multi-sine signal has properties related to the voice signal (i) in the time domain, owing to the presence of discrete amplitude variation, and (ii) in the frequency domain, owing to the presence of discrete components. Other advantages of the optimized multi-sine signal are that (i) a mathematical function can be used for the generation of a series of sine waves at different frequencies with specified phases, (ii) the frequency spectrum has constant amplitude, and (iii) the frequency steps can be set according to a specified frequency resolution.
The chirp is a signal, in which the frequency increases linearly with time:
( )
)) 2 ( 2 sin( f0 kt t t x = π + . (4)As other deterministic signals, the chirp can be used to determine the transfer characteristics of linear time invariant systems mainly in the frequency domain. Typically deterministic signals are used to valuate harmonic distortion and intermodulation distortion. The advantage of chirp signal is easy handling determination of system parameters simply by level measurements [11].
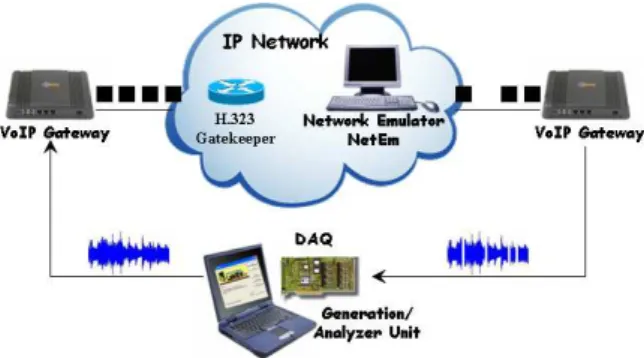
Fig. 3. Test Setup.
C. Speech-like signals
Natural voice is used as test signal when the device under test shows a strong non-linear and/or time varying behavior, so that the concepts of frequency response, distortion and signal-to-noise ratio are no longer directly applicable or even relevant. Usually, natural voice fragments are used to evaluate the overall quality by a model of the human auditory perception. With such a model, a "perceptual frequency response function" or special measures, e.g. based on psychoacoustic parameters (perceptual distortion measures) can be defined [11].
The speech-like composite source signal used along with the natural voice has three components: (i) simulated voice signal, (ii) a pseudo noise signal that has certain noise-like features (constant power density spectrum in the region of interest), for measuring the transfer functions without statistical errors, and (iii) a pause "signal" providing amplitude modulation. Composite source signals are usually applied to systems, which behave non-linearly and are time variant, but which can be considered for the short period of measurement to be in quasi stationary conditions [11].
IV. Experimental comparison of the test signals
At the Laboratory of Signal Processing and Measurement Information (LESIM) of the University of Sannio, several tests have been carried out to choose the most suitable test signals for the impairment classification method. The test setup (Fig.3) is composed of two PCs and to VoIP gateways. A PC is equipped with a DAQ board, used (i) to inject the test signal into the VoIP gateway at the source side, and (ii) to acquire and analyze the signal, at the receiver gateway. The other PC works as a VoIP gatekeeper and as a
network emulator by means of specific emulation software enabling the injection of known quantities of the three impairments under analysis. Both the generation and the analyzer unit have been implemented in LabVIEW and run on the same PC controlling the whole experiment. The call set-up is performed using H.323 VoIP signaling protocol.
In order to evaluate the test signals, it is essential to verify the behavior of the method, when the type and the amount of the impairments present in the network are both well known. This condition is hardly to obtain in a production network, because they depend on the network conditions, which cannot be controlled. Instead, it is possible to use a laboratory network with the aid of a network emulator. A network emulator is a device capable of inserting, in the network, impairments of known type and amount, thus emulating the behavior of a Wide Area Network. It acts by creating a specific path between the input and output interfaces for each impairment which has been set by the user and adding the corresponding impairment through the path. In particular, the network emulating PC is equipped with two network interfaces and configured as a router, under a Linux operating system. Each VoIP gateways is connected to a different Ethernet interface of the network emulating PC. Two software network emulators, NetEm [13] and NistNET [14], running on this Linux PC, have been used to inject network impairments like packet loss and jitter. Network congestion has been emulated by limiting the capacity of the network link to values lower than that required for the communication. Random packet loss (5%, 10% and 20%), high-value jitter (100, 150 and 200 ms), and network congestion (bandwidth limitation to 64, 32 and 16 kbit/s) were generated to evaluate the test signals. The amounts of the three impairments have been established by following the considerations reported below.
Packet loss causes degradation on the voice quality for percentages equal or higher than 5%. On the other hand, packet loss values higher than 20% can be reasonably considered as bandwidth limitations. The random jitter has been emulated imposing a normal distribution with mean and standard deviation of 100, 150 and 200 ms for the transmission delay. Jitter between the starting and the final point of the communication more than 200 ms reflects unacceptable network conditions to support voice communications.
Network congestion has been emulated by limiting the available bandwidth to 64, 32 and 16 kbit/s. 64 kbit/s represents quite null bandwidth limitation at least for data. Limiting the available bandwidth to 16 kbit/s means to set up the path capacity to quite a quarter of the available bandwidth in ideal conditions.
A. Calibration phase
In order to correctly use each signal in the impairment classification, the calibration phase is essential. Obviously, all the test signals are frequency-limited in the telephone bandwidth, 300-3400Hz. Some preliminary tests have been carried out in order to mark the thresholds among the three categories of network impairments relating to the considered signals and fitting the network environments emulated by NistNET and NetEm. The calibration phase has been repeated for each considered signal and each network emulator.
Fig.4 shows the results of this step in the case of two non-speech-like stochastic signals: white noise (Fig.4a) and pink noise (Fig.4b), and one non-speech-like deterministic signal: the optimized multi-sine (Fig.4c). The packet loss impairment is reported with blue dots in the P(0,0), M plane. The Jitter and the bandwidth congestion are reported with orange and green dots, respectively.
As it can be seen from the figures, the three signals allow an easy determination of robust thresholds and are suitable for a deeper investigation in the impairment classification.
Fig.5 reports the calibration results for the natural voice and the composite source signal, belonging to the speech-like category, showing the difficulty of finding reliable thresholds for these signals. Therefore, they have been excluded from the evaluation of the test signals.
0 500 1000 1500 2000 2500 3000 0 0,1 0,2 0,3 0,4 0,5 0,6 Joint Probability (P00) M a x ( F F T (v [n ]) ) Packet loss Jitter Network Congestion 0 500 1000 1500 2000 2500 3000 0 0,1 0,2 0,3 0,4 0,5 0,6 Joint Probability P(00) M a x (F F T (v [n ]) ) Packet Loss Jitter Network Congestion (a) (b) (c) 0 500 1000 1500 2000 2500 3000 0 0,1 0,2 0,3 0,4 0,5 0,6 0,7 Joint Probability P(00) M A X (F F T (v [n ]) ) Packet Loss Jitter Network Congestion 0 500 1000 1500 2000 2500 3000 0 0,1 0,2 0,3 0,4 0,5 0,6 Joint Probability (P00) M a x ( F F T (v [n ]) ) Packet loss Jitter Network Congestion 0 500 1000 1500 2000 2500 3000 0 0,1 0,2 0,3 0,4 0,5 0,6 Joint Probability P(00) M a x (F F T (v [n ]) ) Packet Loss Jitter Network Congestion (a) (b) (c) 0 500 1000 1500 2000 2500 3000 0 0,1 0,2 0,3 0,4 0,5 0,6 0,7 Joint Probability P(00) M A X (F F T (v [n ]) ) Packet Loss Jitter Network Congestion
B. Evaluation of test signals
The calibration phase showed that the use of natural voice and composite source signal is not suitable for a correct and reproducible estimate in the impairment classification.
White noise, pink noise, multi-sine, and chirp are the signals suitable for a deeper characterization analysis of the impairment classification method. The comparison in the use of these different test sequences has been taken using the same test duration. In particular, 20 trials have been performed, for each considered signal. Signals have been generated with a duration of 10.5 s. These signals lead to an effective percentage of classification successes even for a short measurement time. The percentage of correct classification is always 100% in the case of NetEm, while, for some signals, it is lower using NistNET. Table 1 reports the average ratio of correct classifications, for the three network impairments using NistNET. Obviously, the success classification rate increases with the test duration, when the method acquires more samples and the acquisition time is longer.
While NetEm shows a deterministic behavior in the impairments injection, it has been observed that NistNET exhibits a more realistic behavior, presenting a time variation of the impairments, during the test, even if the amount of the impairment has been set to a fixed value. This behavior leads to lower classification percentages especially for high values of packet loss and low levels of jitter. The percentages of correct classification drops to 35% for high values of packet loss (20%) for multi-sine signal and goes to 0% for low levels of jitter (100 ms) for chirp signal in the case of impairment emulation with NistNET.
(a) (b) (c) 0 500 1000 1500 2000 2500 3000 0 0,1 0,2 0,3 0,4 0,5 0,6 Joint Probability (P00) M a x ( F F T (v [n ]) ) Packet loss Jitter Network Congestion 0 500 1000 1500 2000 2500 3000 0 0,1 0,2 0,3 0, 4 0, 5 0, 6 0, 7
Joint Proba bility P(00)
M A X (F F T (v [n ]) ) Packet Loss Jitter Network Congestion 0 500 1000 1500 2000 2500 3000 0 0,1 0,2 0,3 0,4 0,5 0,6 0,7 Joint Probability P(00) M A X (F F T (v [n ]) ) Packet Loss Jitter Network Congestion (a) (b) (c) 0 500 1000 1500 2000 2500 3000 0 0,1 0,2 0,3 0,4 0,5 0,6 Joint Probability (P00) M a x ( F F T (v [n ]) ) Packet loss Jitter Network Congestion 0 500 1000 1500 2000 2500 3000 0 0,1 0,2 0,3 0,4 0,5 0,6 0,7
Joint Proba bility P(00)
M A X (F F T (v [n ]) ) Packet Loss Jitter Network Congestion 0 500 1000 1500 2000 2500 3000 0 0,1 0,2 0,3 0,4 0,5 0,6 0,7 Joint Probability P(00) M A X (F F T (v [n ]) ) Packet Loss Jitter Network Congestion
Fig.4. Calibration phase with non- speech-like signals: (a) white noise, (b) pink noise, (c) optimized multi-sine.
Fig.5. Calibration phase with speech-like signals: (a) male natural voice, (b) female natural voice and (c) composite source signal.
Looking at the results obtained in the experimental phase, non- speech-like stochastic signals result to be the more suitable signals to be used with the impairments classification method. As a matter of fact, with both the emulators, non- speech-like stochastic signals showed the best classification rates.
V. Conclusions
The paper presents the selection of the test signals suitable for classifing VoIP network impairments using a method based on the analysis of the power loss of the test signals. In order to select the test signals, which should permit more reliable measurements, (i) non- speech-like stochastic signals, (ii) non- speech-like deterministic signals and (iii) speech-like signals have been evaluated with the impairment classification method. Both deterministic signals, such as multi-sine and chirp signal and stochastic signals, such as white and pink noise, lead to an effective percentage of classification successes, even if stochastic signals show a higher robustness, because they obtain high classification percentages with both the considered network emulators.
Further work is directed to the extension of the impairment classification method to the case when several impairments are present in the network, in the same time. This analysis will be preliminary to the use of the impairment classification method in the production network.
References
[1]T.Uhl, “Quality of service in VoIP communication”, AEÜ – Int. Journal of Electr. and Commun.,
vol.58, No.3, May 2004, pp.178-182.
[2]L.Roychoudhuri, E.Al-Shaera, G.B.Brewstera, “On the impact of loss and delay variation on
Internet packet audio transmission”, Computer Commun., vol.29, No.10, June 2006, pp.1578-1589.
[3]ITU-T Recommendation P.800, “Method for subjective determination of transmission quality”, 1996.
[4]ITU-T Recommendation P.861, Objective quality measurement of telephone band (300 - 3400 Hz)
speech codecs, 1996.
[5]ITU-T Recommendation P.862, “Perceptual evaluation of speech quality (PESQ): an objective
method for end-to-end speech quality assessment of narrow-band telephone network and speech codes”, 2001.
[6]A.W.Rix, R.Reynolds, M.P.Hollier, “Perceptual measurement of end-to-end speech quality over audio
and packet-based networks”, Audio Engineering Society Convention, preprint no. 4873, May 1999.
[7]J.M.Matta, A.Takeshita, “End-to-end voice over IP quality of service estimation through router
queuing delay monitoring”, Proc. of Global Telecomm. Conf., GLOBECOM '02, Nov. 2002, vol.3, pp.2458-2462.
[8]D.Bao, L.DeVito, L.Tomaciello, “A method for classifying VoIP system impairments”, Proc. of
XV IMEKO TC4 Int. Symp., Iasi, Romania, Sept. 2007, pp.537-542.
[9]L.DeVito, S.Rapuano, L.Tomaciello, “An instrument for the detection of VoIP network
impairments embedded in a VoIP gateway”, Proc. of I²MTC 2008, Victoria, Canada, May 12–15, 2008, pp. 503-508.
[10]P.Markopoulou, F.A.Tobagi, M.J.Karam, “Assessing the quality of voice communications over
Internet backbones”, IEEE/ACM Trans. on Networking, vol.11, No.5, Oct. 2003, pp.747-760.
[11]ITU-T Recommendation P.501, “Test signals for use in telephonometry”, 2000.
[12]D.L.Carnì, D.Grimaldi, “Voice quality measurement in telecommunication networks by optimized
multi-sine signals”, Proc. of XIV IMEKO TC4 Int. Symposium, Gdynia, Poland, 2005, pp.206-209.
[13]S.Hemminger, “Network emulation with NetEm”, Proc. of Linux Conference, Canberra, Australia,
Apr. 2005, http://devresources.linux-foundation.org/shemminger/netem/LCA2005_paper.pdf.
[14]M.Carson, D.Santay, "NistNET - A Linux-based Network Emulation Tool”, Computer Commun.
Review, vol.6, 2003.
[15]H-W.Jin, S.Narravula, K.Vaidyanathan, D.K. Panda, “NemC: a network emulator for
cluster-of-clusters”, Proc. of 15th ICCCN, Oct. 2006, pp.177-182.
Table 1. Percentage of correct classification in the case of impairments injected using NistNET and test duration of 10.5 s.
NistNET
Packet Loss Jitter Network Congestion
5% 10% 20% 100 ms 150 ms 200ms 64 kbps 32 kbps 16 kbps
White noise 100% 100% 100% 100% 100% 100% 100% 100% 100%
Pink noise 100% 100% 100% 90% 100% 100% 100% 100% 100%
Multi-sine 100% 100% 35% 66% 100% 100% 100% 100% 100%