Review Copy
Experimental evaluation of fatigue crack initiation from corroded hemispherical notches in aerospace structural
materials
Journal: Fatigue and Fracture of Engineering Materials and Structures Manuscript ID: Draft
Manuscript Category: Original Contribution Date Submitted by the
Author: n/a
Complete List of Authors: Garcia, Daniel; SAIC
Forman, Royce; NASA, Material & Processes Shindo, David; NASA, Material & Processes
Keywords:
Aluminum 7075-T7351, 4340 Steel, D6AC Steel, Fatigue crack initiation, Fatigue crack propagation, Hemispherical Notch, Corrosion Pit, Laser Peen, Shot Peen, Residual stress
Review Copy
Experimental evaluation of fatigue crack initiation from corroded hemispherical notches in aerospace structural materials
D. B. Garcia1, R. Forman2, D. Shindo2
1
Science Applications International Corporation (SAIC) 2450 NASA Parkway, Houston, TX 77058
2
National Aeronautics and Space Administration (NASA) Johnson Space Center (JSC), Houston, TX 77058
Correspondence: D. Garcia. E-mail: [email protected] ABSTRACT
A test program was developed and executed to evaluate the influence of corroded hemispherical notches on the fatigue crack initiation and propagation in aluminum 7075-T7351, 4340 steel, and D6AC steel. Surface enhancements such as shot peening and laser shock peening were also incorporated as part of the test effort with the intent of improving fatigue performance. In addition to the testing, fracture mechanics and endurance limit based analysis methods were evaluated to characterize the results with the objective of challenging typical assumptions used in modeling fatigue cracks from corrosion pits. The results specifically demonstrate that the aluminum and steel alloys behave differently with respect to fatigue crack initiation from hemispherical corrosion pits. The aluminum test results were bounded by the fracture mechanics and endurance limit models while exhibiting a general insensitivity to the residual stress field generated by shot peening. The steel specimens were better characterized by the endurance limit fatigue properties and did exhibit sensitivities to residual stresses from the shot peening and laser shock peening.
Keywords Aluminum 7075-T7351, 4340 Steel, D6AC Steel, fatigue, corrosion pit, initiation, nucleation,
propagation, laser peen, shot peen, residual stress, threshold
NOMENCLATURE
R = load ratio (minimum load/maximum load) Sy = yield stress
Sult = ultimate stress
Kf = fatigue notch factor
Kt = stress concentration factor
A = crack depth
C = half surface crack length
σth = threshold stress
∆Kth = threshold stress intensity factor range
β = geometric correction factor used in stress intensity factor calculation P = applied load
T-S = Transverse Short material orientation ai = initial pit depth
2ci = initial pit surface diameter
af = crack depth after crack initiation
2cf = surface crack length after crack initiation
w = specimen width t = specimen thickness
S-N = Stress versus life fatigue relationship 3 4 5 6 7 8 9 10 11 12 13 14 15 16 17 18 19 20 21 22 23 24 25 26 27 28 29 30 31 32 33 34 35 36 37 38 39 40 41 42 43 44 45 46 47 48 49 50 51 52 53 54 55 56 57 58
Review Copy
INTRODUCTION
Aerospace structural materials such as aluminum 7075-T7351, 4340 steel, and D6AC steel are susceptible to pitting when operated in a corrosive environment. Corrosion pits can readily act as crack initiation regions due to the metallurgical damage in addition to the stress concentration influences. The phrase crack initiation refers to the process by which a fatigue crack is formed and reaches a sufficient size to which it can then be characterized by fracture mechanics methods. Fatigue cracks emanating from naturally occurring corrosion pits are frequently modeled as surface cracks or a combination of other standard fracture models [1-7]. This project challenged that assumption and approach by utilizing idealized corrosion pits (corroded hemispherical notches) that are subsequently tested to observe the stress concentration and corrosion effects on the fatigue crack initiation and propagation behavior. Current fracture mechanics tools like NASGRO [8] and AFGROW [9] do not currently have the capability to capture the geometry of cracks emanating from hemispherical notches. The desire to enhance the fracture mechanics understanding of crack initiation and propagation from an idealized corrosion pit motivated this project. The overall objective was to advance the fundamental understanding of the mechanics of fatigue crack initiation and propagation processes from idealized corrosion pits in Al 7075-T7351, 4340 steel, and D6AC steel with a variety of surface enhancements that include shot peening or laser shock peening. The approach consisted of performing fatigue crack initiation and propagation testing that encompassed the three alloys, surface treatment conditions, multiple corrosion pit sizes, and two applied load ratios. The results were then studied to evaluate the applicability of using surface crack approximations or endurance limit approximations to characterize the initiation of fatigue cracks from idealized corrosion pits.
MATERIALS AND PROPERTIES
Three aerospace materials were chosen for the testing program including aluminum 7075-T7351, 4340 steel, and D6AC steel. All three materials were procured as plate (Al 7075) or forging (Steels) and the specimens were tested in the transverse-short (T-S) orientation with the various surface treatment conditions. The yield stress, σy, ultimate stress, σult, and specific surface enhancements are listed in
Table 1 for reference.
Surface Enhancements
Previous efforts have examined the effects of surface enhancements on the fatigue performance of aluminum and steel alloys and revealed noticeable improvements in the resistance to fatigue crack initiation [10-12]. For this reason, shot peening and laser shock peening surface enhancements were used in this program so that their effects on the corroded notches could be evaluated. The specific surface enhancement parameters for each surface condition are provided in Table 1. From each set of specimens selected for fatigue testing, one was chosen specifically for residual stress measurements by using the slitting method [13,14]. This technique is destructive, so the selected specimens could not be used for further fatigue testing. For reference, none of the bare specimens from any of the three materials were selected for residual stress measurements.
Surface treatments on the aluminum 7075-T7351 consisted of a nominal shot peen and a heavy shot peen (or heavy peen), and the results from these residual stress measurements are shown in Fig. 1a along with 3 4 5 6 7 8 9 10 11 12 13 14 15 16 17 18 19 20 21 22 23 24 25 26 27 28 29 30 31 32 33 34 35 36 37 38 39 40 41 42 43 44 45 46 47 48 49 50 51 52 53 54 55 56 57 58
Review Copy
the respective notch depths identified for reference. A graphical schematic of the sectioned corrosion pit geometry with respect to the residual stress field is also shown in Fig. 1a. It is apparent that the heavy peen specimen has a larger magnitude peak compressive stress but a steeper stress gradient compared to the nominal shot peen condition. For both cases, the residual stress field becomes tensile at
approximately 1.27 mm into the depth of the specimen. With respect to the corrosion pit dimensions, the smaller pits in the nominal shot peened specimens were completely encompassed by the compressive residual stress field, but the root depths of the larger pits crossed into the tensile region. The root depth for all of the pits in the heavy peened specimens crossed into the tensile region. This implies that the effect of the residual stress was more pronounced at the surfaces of the corrosion pits rather than the root of the pits.
The 4340 steel specimens had either the laser shock peening (or laser peening) surface enhancement method or the shot peening, and the residual stress measurements for both cases are shown in Fig. 1b. An inset is shown within Fig. 1b to examine the compressive region in greater detail and identify the depth of the corrosion pits. Although the surface residual stress for the two methods was approximately the same (~ -800MPA), the laser peened residual stress remained compressive up to a depth of approximately 2.03 mm while the shot peening residual stress became positive at approximately 0.51 mm. These results demonstrate that the laser peening residual stress remained compressive over a distance of four times that of the shot peening surface. It should also be noted that the laser peen resultant peak tensile stress is also approximately four times greater than the peak shot peened resultant peak tensile stress. The depth of the notch root for the smallest pit tested in the shot peened condition corresponds with zero residual stress, but the larger pit sizes had depths that spanned into the residual tensile stress field. All of the laser peened specimens had corrosion pits that were encompassed by the compressive residual stress.
The D6AC steel specimens were only tested in the bare or shot peened conditions, and the results of the shot peening residual stress measurements are shown in Fig. 1c with the pit depth ranges identified. It is apparent that root of the smallest pit depth crosses into the tensile residual stress region. All shot peened D6AC steel specimens had corrosion pits in which some region of the pit crossed into the tensile residual stress field.
Notch Fatigue Properties
The fatigue and fracture characteristics of cracks emanating from idealized corrosion pits was the primary motivation of this project, so in order to fully explore these aspects, the influence of the hemispherical notches needs to be discussed. A hemispherical notch should not be confused with a semi-circular notch because the boundary conditions are different. A hemispherical notch is a 3-dimensional feature and cannot be generalized in 2-dimensions like a hole in a plate because the added dimensional constraint in three dimensions essentially lowers the stress concentration. The analytical stress concentration factor for a hole in an infinite plate is Kt=3.0, whereas, the stress concentration factor, Kt, for a hemispherical notch
is reported as Kt=2.15 in [15] and Kt=2.23 in [16]. For the remainder of this document, the stress
concentrator at a hemispherical notch is assumed to be Kt =2.23.
In the mechanics of fatigue, materials are sensitive to the stress concentrator in a variety of ways. The fatigue notch factor, Kf, represents the reduction in remotely applied stress required to initiate a crack
from a notch. The notch sensitivity, q is shown in equation 1 to be a function of the stress concentrator, Kt and the fatigue notch factor Kf [17,18]. The value for q can also be determined empirically, where α is
3 4 5 6 7 8 9 10 11 12 13 14 15 16 17 18 19 20 21 22 23 24 25 26 27 28 29 30 31 32 33 34 35 36 37 38 39 40 41 42 43 44 45 46 47 48 49 50 51 52 53 54 55 56 57 58
Review Copy
the notch sensitivity parameter for a given material and ρ is the radius of the notch. For the materials used in this study, α is 0.51 mm for aluminum, 0.06 mm for 4340 steel and 0.08 mm for D6AC steel[17]. These values are assumed to be valid for hemispherical notches although they were developed from planar stress concentrators.
ρ
α
+
=
−
−
=
1
1
1
K
1
K
q
t f (1)It can be seen in equation 1 that as the notch sensitivity, q, increases and approaches unity (1.0), the notch fatigue factor, Kf, approaches the value of the stress concentration factor, Kt. This means that larger pit
sizes have greater influence on the fatigue life. As the notch sensitivity, q, approaches zero, the notch fatigue factor, Kf, approaches unity. This means that the effect of the pit on fatigue life becomes
negligible for small pit sizes irrespective of material.
For reference, the fatigue notch factor, Kf, is shown as a function of pit depth in Fig. 2 and demonstrates
that the aluminum alloys are much less sensitive to notches than the steel alloys for a variety of pit depths. For example, a hemispherical notch between 0.51mm and 1.52 mm in aluminum will have a fatigue notch factor between 40-85% of the stress concentration factor, but the same pit size in steels will have a notch fatigue factor that is over 90% of the stress concentrator.
EXPERIMENTAL METHODS AND PROCEDURES Specimen Design and Preparation
The general approach for developing the fatigue test was to incorporate a dogbone shaped specimen design where the grip section is wide and tapered to the gage section so that the highest stresses are in the gage section. Within this specimen, the hemispherical notch was centrally located. For each material used, the nominal gage thickness varied between 10.2-12.7mm and the width was approximately 22.9mm. A schematic of a representative dog-bone specimen is provided in Fig. 3. Once the machining process was complete, a set of specimens from each material were then either shot peened or laser shock peened. After the surface treatments were conducted, the specimens were then prepared for the notching and corrosion pit processes.
The notching and pitting processes for the specimens included the following steps with the specific nuances for each material highlighted. All specimens were polished, primed, and then coated with an acrylic paint to protect the material not intended for corrosion. A small hemispherical notch was then centrally located and drilled into the specimen as shown in Fig. 3. For the aluminum specimens, a corrosion cell was created by filling a polyvinyl chloride tube attached to the specimen with a mixture of 240 mL de-ionized water, 1.6 mL HNO3 (nitric acid), and 0.8 g NaCl. The corrosion process was allowed
to react from 10 - 60 minutes depending on the resulting pit size. The steel specimens were corroded in the hemispherical notches by applying four drops of 60% de-ionized water and 40% concentrated nitric acid and maintaining the reaction for approximately 45 minutes. After the pitting process, the corrosion cell was removed (for the aluminum specimens) and the specimens were rinsed with water. The coating used to protect the base material was then removed with a solvent.
3 4 5 6 7 8 9 10 11 12 13 14 15 16 17 18 19 20 21 22 23 24 25 26 27 28 29 30 31 32 33 34 35 36 37 38 39 40 41 42 43 44 45 46 47 48 49 50 51 52 53 54 55 56 57 58
Review Copy
At this stage, the specimens were measured and instrumented for direct current potential drop for the Fracture Technology Associates (FTA) data acquisition system. The potential drop method could detect the crack propagation from the notch through the change in electric potential due to the change in cross sectional area. After the specimens were prepared for data acquisition, they were then tested.
Fatigue Test Methods
The process for performing the corrosion pit initiation and propagation tests is depicted in Fig. 4 and discussed here. All testing was performed in servo-hydraulic test machines. During the beginning of the test phase, the specimens were cycled at a given starter load and load ratio, R=0.1 or R=0.7, until a crack was detected or 3 million cycles was reached. Each test machine was operated at the maximum capable frequency to ensure that the loads were reached and that the system avoided natural frequencies. If the FTA system detected a crack of approximately 0.254mm, the crack was visually confirmed and the test halted or the test was continued until a visual crack was detected and confirmed. If 3E6 cycles was reached prior to detecting a crack, the load was then increased approximately 10% and the test was started again until a crack was detected or 3E6 cycles was reached. This process is known as step testing and is used to determine a threshold load or endurance limit depending on the critical parameter. The process was repeated until a crack was detected in the pit or anywhere else on the specimen.
The initial growth is referred to as the initiation phase for this study. Because the cracks did not grow uniformly out of the idealized corrosion pits, the initial growth was measured and photo-documented after the test. In order to measure the initial growth, the fracture surface was marked after the initiation phase of the test by either changing the load ratio from R=0.7 to R=0.1 or increasing the load if the load ratio during the initial test was R=0.1. Once the crack marking occurred, the FTA was programmed to then stop the test after the crack reached 3.81mm in depth. At this point, the specimen was fractured to expose the crack face and subsequently, the pit dimensions, initial growth, and final growth measurements were documented. A total of 139 specimens were tested during this project and the general test matrix, provided in Table 1, includes the material, surface condition tested, load ratio, and number of tests.
FATIGUE TEST RESULTS
The results from the fatigue step testing provided information regarding the threshold or initiation properties of crack emanating from idealized corrosion pits. The terms threshold and initiation are used in this context because it is not clear if the initial crack process is dominated by fracture mechanics (threshold) or fatigue (initiation). One advantage of this test approach is that the threshold behavior can be determined rather rapidly if the initial loads are appropriately chosen. The disadvantage is that the initial predictions may be too high resulting in a first step initiation, or too low resulting in several steps and cycles required to reach threshold. The test results for all three materials are provided in Table 2 through Table 9 and shown in Fig 12 through Fig 14. Within these tables are measurements, all load steps, cycles, and crack length measurements. The initial crack measurement, ai and 2ci, indicate the pit
depth and surface width respectively. The crack measurements after the initiation process are represented by af and 2cf. For simplicity, the test results are organized in bins that correspond to a range of small,
medium, and large pit depths. For example, a bin of 0.254mm indicates all pit depths tested between 0.254 mm and the next bin size (i.e. 0.762 mm).
Aluminum 7075-T7351 Initiation Test Results
3 4 5 6 7 8 9 10 11 12 13 14 15 16 17 18 19 20 21 22 23 24 25 26 27 28 29 30 31 32 33 34 35 36 37 38 39 40 41 42 43 44 45 46 47 48 49 50 51 52 53 54 55 56 57 58
Review Copy
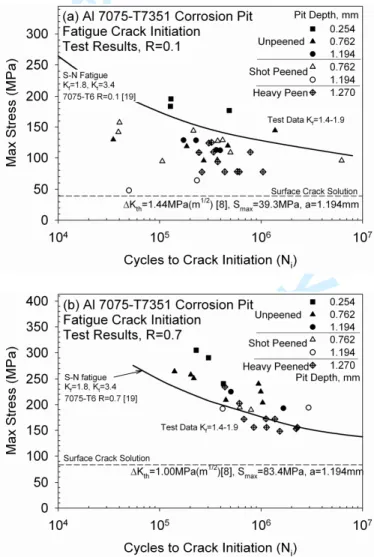
The test results for each of the different surface conditions and load ratios are included in Table 2 through Table 4 for the aluminum specimens. Several of the initial tests were used to understand the process, so these tests failed in the spot weld or exhibited some other problem during testing. In general, the primary nuances experienced during these tests included first step failures and a few spot weld crack initiations. The results from the aluminum tests are shown in Fig. 5 as maximum stress as a function of cycles to crack initiation. The runout data are not included in the plots, but the data are provided in the tables. The data are also shown with the S-N curve fit of a similar alloy, Al 7075-T6, with fatigue notch factor, of Kf=1.8 which is in the same range as the test data (Kf=1.4-1.9) [19]. In addition to the fatigue curve, the
threshold stress corresponding to a semicircular surface crack based on an initial flaw size and threshold stress intensity factor range is also shown for reference. The threshold stress, σth is determined by using
equation 2 where ∆Kth is the threshold stress intensity factor range, R is the load ratio, β is the
dimensionless shape factor obtained from NASGRO [8], and a is the semi-circular crack radius.
a
R
1
K
th thπ
β
σ
)
(
−
∆
=
(2)Upon initial observation, all of the R=0.1 nominal shot peen and heavy peen test results are conservative compared to the S-N fatigue curve. This includes both the shot peen and heavy peen test results. In addition, the threshold stress based on a surface crack fracture model is a conservative estimate compared to all test results. These results imply that the R=0.1 test results are essentially bounded by the threshold stress and fatigue curve. It is difficult to discern the effect of shot peening on these test results, but this issue will be discussed further in the threshold assessment section.
The R=0.7 shot peen test results appear to be well characterized by the fatigue curve for both shot peening cases. This initial result suggests that shot peening does not influence the initiation life of corrosion pits for 7075-T7351 and that the propagation life is negligible compared to the initiation life. The fatigue curve appears to be conservative compared to all of the R=0.7 data in the bare condition, but there are a few shot peened and heavy peened tests in which the fatigue curve is non-conservative. Again, the threshold stress for a surface flaw is very conservative compared to the R=0.7 test results, but does provide a lower bound estimate of the results.
4340 Steel Initiation Test Results
The 4340 steel test results for each of the bare, shot peened, and laser peened specimens are included in Table 5 through Table 7 and shown in Fig. 6. Several of the laser peened tests proved difficult to nucleate a crack within the pit. This result alone should be noted because the pit in steel had a notch fatigue factor of Kf=2.1-2.18 that is very similar to the stress concentration factor of Kt=2.2. This implies that the
stress concentration effect is not drastically reduced in the steel alloys under cyclic loading, but there were still problems nucleating a crack in the pit.
All test nuances are documented but the most common problems included first step cracking, spot weld cracking, and cracking away from the pit. A total of seven specimens initiated cracks either at the tack weld or away from the corrosion pit and five of these specimens had pit sizes that were smaller than 0.76 3 4 5 6 7 8 9 10 11 12 13 14 15 16 17 18 19 20 21 22 23 24 25 26 27 28 29 30 31 32 33 34 35 36 37 38 39 40 41 42 43 44 45 46 47 48 49 50 51 52 53 54 55 56 57 58
Review Copy
mm. Only two specimens out of five with laser peening and a load ratio of R=0.1 initiated cracks in the pits.
For comparison, the fatigue curve from the 4340 steel with a fatigue notch factor of Kf=2.9 is shown in
Fig. 6 [19]. This notch fatigue factor is more conservative than the test data which had fatigue notch factors in the range of Kf=2.1-2.8. Observation of the test results demonstrate that the fatigue curve was
conservative compared to all the test data for both load ratios. This result is expected because of the higher fatigue notch factor in the fatigue curve compared to the corrosion pit specimens. The figures also demonstrate the threshold stress corresponding to a semicircular surface crack based on an initial flaw size and threshold stress intensity factor range calculated from equation 2. Again, the surface crack based threshold appears to be conservative compared to the test results.
Upon initial observation, it is apparent that the shot peened and laser peened specimens provide benefit toward the fatigue initiation stress. This is very evident with the R=0.1 test results. The laser peen specimens exhibit the most improvement followed by the shot peened specimens. None of these results have been post processed to account for residual stresses, but it is believed that the benefit is due to the residual stress effects from the surface enhancements.
D6AC Steel Initiation Test Results
The test results for the bare and shot peened D6AC with corresponding load ratios are included in Table 8 and Table 9 and shown in Fig. 7. Within Fig. 7, the S-N data of D6AC steel with a fatigue notch factor of Kf=2.0 is also shown for reference. This curve is non-conservative compared to the test data which has a
fatigue notch factor of Kf=2.09-2.16[20]. Two caveats regarding the S-N data that should be discussed
include the strength of the S-N material is not the same as the corrosion pit material and the load ratios are similar but not the same (R=0.0 vs. R=0.1 and R=0.5 vs. R=0.7) [20]. The tensile strength of the material associated with the S-N data is 1861MPa whereas the corrosion pit material strength is 1103MPa. It is not clear how the strength influences the fatigue data for this material, but the most dramatic effects would occur at stresses near or above 551MPa, which is the yield stress for the D6AC tested in this program. The figures also show the threshold stress corresponding to a semicircular surface crack based on an initial flaw size and threshold stress intensity factor range. Again, the surface crack based threshold appears to be overly conservative compared to the test results.
Upon initial observation, it is apparent that the shot peening provides some fatigue benefit for the R=0.1 tests with the larger pit diameters. The initiation stresses of the smaller pit diameter specimens do not exhibit the same improvement and correspond with the bare test results. It is difficult to discern any benefit in the R=0.7 test results for all pit sizes.
FATIGUE THRESHOLD ASSESSMENT
The results shown in the previous section provide a method of assessing the applied stress as a function of cycles to determine the threshold. One of the disadvantages associated with this method of displaying the results is that the initiation cycles from a previous step are not included. A different approach to
displaying these results includes plotting the applied stress versus the pit depth, but this approach does not account for the load associated with the previous runout step. This section discusses an approach to utilize the test results to establish the threshold stress.
3 4 5 6 7 8 9 10 11 12 13 14 15 16 17 18 19 20 21 22 23 24 25 26 27 28 29 30 31 32 33 34 35 36 37 38 39 40 41 42 43 44 45 46 47 48 49 50 51 52 53 54 55 56 57 58
Review Copy
The step test approach used to determine threshold implies that the true initiation and/or propagation threshold occurs somewhere between the previous load step and the current load step. In order to account for this, an equation can be used that interpolates the threshold load based on the applied loads and applied cycles [21]. The interpolation equation is given below in equation 3 where Pth is the threshold
load, Pps is the previous load from the previous step, Pf is the current load step, Nf is the number of cycles
in the current step, and Nstep is the number of cycles per step. The threshold load can then easily be
converted to stress and then threshold stress can be shown as a function of pit depth. All of these parameters are available in Table 2 through Table 9 for the test results.
step f ps f ps th
N
N
P
P
P
P
=
+
(
−
)
(3)Another advantage of the described approach is that these results can be compared to an analytic threshold prediction based on either the endurance limit or fracture mechanics. The fracture mechanics approach uses equation 2 previously discussed where the crack length is set equal to the notch radius and the threshold SIF corresponds to the specific material properties. For a variety of notch depths, the trend can be established and compared to the test data. The other method used in assessing the threshold stress was to use the S-N endurance limit and adjust it to account for the notch. For most cases, the fatigue curve from literature was used to estimate the endurance limit associated with 2E6 cycles using the appropriate load ratio of either R=0.1 or R=0.7 [19,20]. This endurance stress was then reduced to account for the fatigue notch factor, Kf, and respective pit diameter from equation 1. This is not the same
as using notched fatigue properties. It is a method of adjusting the unnotched parameters to assess the effect of a notch.
Aluminum 7075-T7351 Threshold Assessment
The test results showing threshold stress as a function of pit depth are displayed in Fig. 8. In addition to the test results, the surface crack threshold and endurance limit predictions are also shown. The results demonstrate that an endurance limit prediction is non-conservative for the aluminum and the fracture mechanics approach is overly conservative. Closer observation of the test results from both load ratios reveals that the aluminum pit initiation appears to be insensitive to the residual stress. This means that the test results do not appear to be influenced by the surface treatments for the range of pit depths from 0.3mm – 2.0 mm. This is demonstrated by the fact that there does not appear to be an increase in initiation stress for the shot peened specimens. This observation is only valid for the pit sizes tested and may show greater influence at smaller pit sizes.
4340 Steel Threshold Assessment
The 4340 steel test results are shown in Fig. 9 as threshold stress as a function of pit depth. In addition to the test results, the surface crack threshold predictions are shown with the endurance limit prediction. Initial observations reveal that the surface crack approximation is overly conservative. Closer
examination reveals that the unpeened threshold stress response for R=0.1 appears to be constant with respect to the pit diameter and this implies that the initiation process may be controlled by fatigue (i.e. endurance limit) rather than fracture mechanics. This observation is also supported by the fact that the notch fatigue factor, Kf, for steel alloys does not vary much for pit sizes above 0.51mm The shot-peened
3 4 5 6 7 8 9 10 11 12 13 14 15 16 17 18 19 20 21 22 23 24 25 26 27 28 29 30 31 32 33 34 35 36 37 38 39 40 41 42 43 44 45 46 47 48 49 50 51 52 53 54 55 56 57 58
Review Copy
and laser peened specimens do not follow the fracture mechanics predictions either, but the curve does not account for residual stress. The effect of residual stress is apparent for the R=0.1 threshold results with laser peening resulting in the most increase in threshold stress.
The R=0.7 shot peening and laser peened specimens still show some benefit, but it is not as pronounced as in the R=0.1 test results. This may be explained by the fact that the localized stresses are above yield, so the influence of shot peening or laser shock peening may not be as apparent as they are in the R=0.1 results. Although the endurance limit prediction for the R=0.7 case is conservative, the surface crack prediction is overly conservative.
D6AC Steel Threshold Assessment
The threshold stress predictions for the D6AC specimens are shown in Fig. 10 as threshold stress as a function of pit depth. It is immediately apparent that the surface crack predictions are overly conservative compared to the test data for both load ratios. The endurance limit predictions for R=0.1 characterize the larger pits (>1.02mm) better than the smaller pits. It should be noted that the R=0 endurance limit for 1861MPa D6AC steel was used for the prediction[20]. The R=0.1 endurance data would most likely fit better, but it is difficult to discern what the effect of reduced strength would have on the endurance limit. For the R=0.1 test results, the residual stress from the shot peening did appear to have the effect of increasing the threshold stress at the larger pit diameters.
The R=0.7 endurance limit predictions are very conservative compared to the test results. These results are for an R=0.5 load ratio instead of R=0.7, so the actual discrepancy may not be as significant if the predictions were based on R=0.7 data. The tests do appear to show an insensitivity to pit diameter at the higher load ratio. This would imply that the D6AC steel can be better characterized with the endurance limit rather than the fracture mechanics threshold approach. It is also interesting to note that the high load ratio test data was performed well above the yield stress. Again, the residual stress effects for the R=0.7 test results were not obvious, so the effect of localized yielding may have had an effect on these
specimens.
CONCLUSIONS
In summary, a test program was developed and executed to evaluate the influence of hemispherical corrosion pits on the initiation and propagation in aluminum and steel alloys. In addition to the general corrosion pit influences, the effects of surface enhancements such as shot peening and laser shock peening were also evaluated. The specific conclusions for the test program and analysis are provided below: 1. Aluminum 7075-T7351 fatigue initiation from a hemispherical corrosion pit appears to be
insensitive with respect to nominal and/or heavy shot peen surface enhancements. This
observation is independent of corrosion pit size (pit depth=0.25mm to 2.03mm) and applied load ratio (R=0.1 or R=0.7).
2. The fatigue initiation from a hemispherical corrosion pit in 4340 steel is sensitive to both shot peeing and laser shock peening surface enhancements. The shot peening provides benefit over the bare condition and the laser peening provides benefit over both the bare and shot peening conditions. This observation is more pronounced at a load ratio of R=0.1 with pit depths ranging from 0.51mm-1.02 mm. 3 4 5 6 7 8 9 10 11 12 13 14 15 16 17 18 19 20 21 22 23 24 25 26 27 28 29 30 31 32 33 34 35 36 37 38 39 40 41 42 43 44 45 46 47 48 49 50 51 52 53 54 55 56 57 58
Review Copy
3. D6AC steel fatigue initiation from a hemispherical corrosion pit appears to be sensitive to shot peening at a load ratio of R=0.1, but insensitive to shot peening at R=0.7. This observation includes all pit depths tested from 0.51-1.52 mm.
4. A threshold stress prediction was implemented using typical fracture mechanics assumptions to capture the step test approach and predict the applied stresses at which surface cracks will initiate from corrosion pits. This prediction method is much too conservative for the three materials tested to capture the real behavior of a crack initiating and propagating out of a corroded hemispherical notch.
5. An endurance limit based prediction was also implemented that accounts for the fatigue notch factor. This approach was overly conservative for the aluminum tests, but provided a reasonably conservative estimate for the steels. This was particularly true for the 4340 steel.
ACKNOWLEDGEMENTS
The authors would like to acknowledge the support of Traci Stadtmueller, John Bakuckas, Ph.D, and Cu Nguyen from the FAA William J. Hughes Technical Center. This work was sponsored under the Interagency Agreement, DTFACT-08-X-00004, between the Department of Transportation/Federal Aviation Administration and the National Aeronautics and Space Administration.
REFERENCES
1. Rokhlin S.I., Kim J.Y., Nagy H., Zoofan B. (1999) Effect of pitting corrosion on fatigue crack initiation and fatigue life, Engineering Fracture Mechanics 62, 425-444.
2. Gabetta G., Torri L., (1992) Crack nucleation and propagation in blade steel material, Fatigue Fract. Engng Mater. Struct. Vol 15 No11, 1101-1111.
3. Medved J.J., Breton M., Irving P.E., (2004) Corrosion pit size distributions and fatigue lives – a study of the EIFS technique for fatigue design in the presence of corrosion, Int. J. Fatigue 26, 71-80.
4. DuQuesnay D.L., Underhill P.R., Britt H.J., (2003) Fatigue crack growth from corrosion damage in 7075-T6511 aluminum alloy under aircraft loading, Int. J. Fatigue, 25, 371-377.
5. Ishihara S., Saka S., Nan Z.Y., Goshima T., Sunada S., (2005) Prediction of corrosion fatigue lives of aluminium alloy on the basis of corrosion pit growth law, Fatigue Fract Engng Mater Struct 29, 472-480.
6. Sriraman M.R., Pidaparti R.M., (2010) Crack initiation life of materials under combined pitting corrosion and cyclic loading, J. Materials Engineering and Performance, 8-Vol 19(1), 7-12. 7. Dolley E.J., Lee B., Wei R.P., (2000) The effect of pitting corrosion on fatigue life, Fatigue Fract
Engng Mater Struct, 23, 555-560.
8. NASGRO® 6.0, NASA Johnson Space Center and Southwest Research Institute ®, March 2006,
www.nasgro.swri.org.
9. AFGROW (release 4.0012.05), Air Force Research Laboratory, VASM, October 2008,
www.afgrow.net
10. Gregory J.K., Rack H.J., Eylon D., (1996) Surface Performance of Titanium, TMS, Warrandale, Pa, 217-230.
11. Torres M.A.S., Voorwald H.J.C., (2002) An evaluation of shot peening, residual stress and stress relaxation on the fatigue life of AISI 4340 steel, Int. J. Fatigue, 24, 877-886.
12. Benedetti M., Fontanari V., Scardi P., Ricardo C.L.A., Bandini M., (2009) Reverse bending fatigue of shot peened 7075-T651 aluminum alloy: The role of residual stress relaxation, Int. J. Fatigue, 31, 1225-1236.
13. Rankin, J E, Hill M R, Hackel L A, (2003), The effects of process variations on the residual stress in laser peened 7049-T73 aluminum alloy,” Materials Science and Engineering A 349 279-291. 3 4 5 6 7 8 9 10 11 12 13 14 15 16 17 18 19 20 21 22 23 24 25 26 27 28 29 30 31 32 33 34 35 36 37 38 39 40 41 42 43 44 45 46 47 48 49 50 51 52 53 54 55 56 57 58
Review Copy
14. Prime, M B., (1999) Residual Stress Measurement by Successive Extension of a Slot: The Crack Compliance Method, Applied Mechanics Review, Vol 52, No. 2 pp. 75-96.
15. Cerit M., Genel K., Eksi S., (2009) Numerical investigation on stress concentration of corrosion pit, Engineering Failure Analysis, 16 2476-2472.
16. Eubanks, R A, (1953) Stress Concentration Due to a Hemispherical Pit at a Free Surface, Department of Mechanics, Illinois Institute of Technology, Chicago, Illinois, January 1, Submitted to Office of Naval Research, Contract N7onr-32906, Project No. NR 035-302. 17. Dowling, N E, (1999) Mechanical Behavior of Materials, 2nd ed. Prentice Hall, Inc. 18. Schijve, J, (1999) Fatigue of Structures and Materials, Kluwer Academic Publishers,. 19. Metallic Materials Properties Development and Standardization, MMPDS-04, April 2008,
Federal Aviation Administration.
20. Davis, S O, (1963) Elevated Temperature Fatigue Properties of D6AC High Strength Steel, ASD-TDR-63-645, Project no. 7381, Task No. 738103, AF Materials Laboratory, Wright Patterson Air Force Base, OH, October.
21. Bellows R.S., Muju S., Nicholas T., (1999) Validation of the step test method for generating Haigh diagrams for Ti-6Al-4V, Int. J. Fatigue 21, 687-697.
Table 1 Material properties and surface enhancement method.
Table 2 Test results for bare aluminum 7075-T7351 corrosion pit specimens. Table 3 Test results for shot peened aluminum 7075-T7351 corrosion pit specimens. Table 4 Test results for heavy shot peened aluminum 7075-T7351 corrosion pit specimens. Table 5 Test results for bare 4340 steel corrosion pit specimens.
Table 6 Test results for shot peened 4340 steel corrosion pit specimens. Table 7 Test results for laser peened 4340 steel corrosion pit specimens. Table 8 Test results for bare D6AC steel corrosion pit specimens. Table 9 Test results for shot peened D6AC steel corrosion pit specimens.
Fig. 1 Residual stress measurements for the aluminum 7075-T7351 (a), 4340 steel (b), and D6AC steel (c).
Fig. 2 Fatigue notch factors as a function of pit radius for aluminum and steel alloys. Fig. 3 Specimen schematic and reference corrosion pit location.
Fig. 4 Fatigue crack initiation and propagation step test process.
Fig. 5 Al 7075-T7351 test results for bare and nominal shot peened specimens, R=0.1. Fig. 6 4340 steel fatigue test results for all surface conditions, R=0.1.
Fig. 7 D6AC steel bare and shot peened test results for R=0.1.
Fig. 8 Threshold stress as a function of pit depth for aluminum 7075-T7351. Fig. 9 Threshold stress for the 4340 steel as a function of pit depth.
3 4 5 6 7 8 9 10 11 12 13 14 15 16 17 18 19 20 21 22 23 24 25 26 27 28 29 30 31 32 33 34 35 36 37 38 39 40 41 42 43 44 45 46 47 48 49 50 51 52 53 54 55 56 57 58
Review Copy
Fig. 10 Threshold stress for the D6AC steel as a function of pit depth. 3 4 5 6 7 8 9 10 11 12 13 14 15 16 17 18 19 20 21 22 23 24 25 26 27 28 29 30 31 32 33 34 35 36 37 38 39 40 41 42 43 44 45 46 47 48 49 50 51 52 53 54 55 56 57 58Review Copy
Table 1 Material properties and surface enhancement method.
# of Specimens Material/ Orientation σy MPa σult MPa Surface Condition Tested
Surface Enhancement Parameters
R=0.1 R=0.7
Bare NA 14 12
Nominal
Shot Peen 8-12 Almen, 100% coverage, 2 times 11 4 Aluminum
7075-T7351 (T-S)
248 503
Heavy
Peen 5-7 Y2 Almen, 100% coverage, 5 times 12 10
Bare NA 9 8
Shot Peen 8-12Almen 100% coverage 9 5 4340 Steel
(T-S) 1206 1310 Laser Peen
power density 8GW/cm2, 18ns pulse, 16J laser
energy, 3 layers, 3.33mm x 3.33mm spot size 5 6
Bare NA 8 8
D6AC Steel
(T-S) 551 1103 Shot Peen 8-12 Almen, 100% coverage 9 9
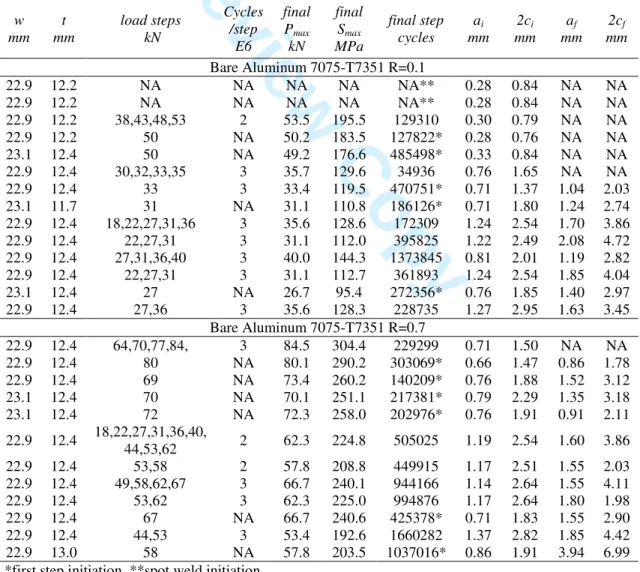
Table 2 Test results for bare aluminum 7075-T7351 corrosion pit specimens.
w mm t mm load steps kN Cycles /step E6 final Pmax kN final Smax MPa final step cycles ai mm 2ci mm af mm 2cf mm Bare Aluminum 7075-T7351 R=0.1 22.9 12.2 NA NA NA NA NA** 0.28 0.84 NA NA 22.9 12.2 NA NA NA NA NA** 0.28 0.84 NA NA 22.9 12.2 38,43,48,53 2 53.5 195.5 129310 0.30 0.79 NA NA 22.9 12.2 50 NA 50.2 183.5 127822* 0.28 0.76 NA NA 23.1 12.4 50 NA 49.2 176.6 485498* 0.33 0.84 NA NA 22.9 12.4 30,32,33,35 3 35.7 129.6 34936 0.76 1.65 NA NA 22.9 12.4 33 3 33.4 119.5 470751* 0.71 1.37 1.04 2.03 23.1 11.7 31 NA 31.1 110.8 186126* 0.71 1.80 1.24 2.74 22.9 12.4 18,22,27,31,36 3 35.6 128.6 172309 1.24 2.54 1.70 3.86 22.9 12.4 22,27,31 3 31.1 112.0 395825 1.22 2.49 2.08 4.72 22.9 12.4 27,31,36,40 3 40.0 144.3 1373845 0.81 2.01 1.19 2.82 22.9 12.4 22,27,31 3 31.1 112.7 361893 1.24 2.54 1.85 4.04 23.1 12.4 27 NA 26.7 95.4 272356* 0.76 1.85 1.40 2.97 22.9 12.4 27,36 3 35.6 128.3 228735 1.27 2.95 1.63 3.45 Bare Aluminum 7075-T7351 R=0.7 22.9 12.4 64,70,77,84, 3 84.5 304.4 229299 0.71 1.50 NA NA 22.9 12.4 80 NA 80.1 290.2 303069* 0.66 1.47 0.86 1.78 22.9 12.4 69 NA 73.4 260.2 140209* 0.76 1.88 1.52 3.12 23.1 12.4 70 NA 70.1 251.1 217381* 0.79 2.29 1.35 3.18 23.1 12.4 72 NA 72.3 258.0 202976* 0.76 1.91 0.91 2.11 22.9 12.4 18,22,27,31,36,40, 44,53,62 2 62.3 224.8 505025 1.19 2.54 1.60 3.86 22.9 12.4 53,58 2 57.8 208.8 449915 1.17 2.51 1.55 2.03 22.9 12.4 49,58,62,67 3 66.7 240.1 944166 1.14 2.64 1.55 4.11 22.9 12.4 53,62 3 62.3 225.0 994876 1.17 2.64 1.80 1.98 22.9 12.4 67 NA 66.7 240.6 425378* 0.71 1.83 1.55 2.90 22.9 12.4 44,53 3 53.4 192.6 1660282 1.37 2.82 1.85 4.42 22.9 13.0 58 NA 57.8 203.5 1037016* 0.86 1.91 3.94 6.99 *first step initiation, **spot weld initiation
3 4 5 6 7 8 9 10 11 12 13 14 15 16 17 18 19 20 21 22 23 24 25 26 27 28 29 30 31 32 33 34 35 36 37 38 39 40 41 42 43 44 45 46 47 48 49 50 51 52 53 54 55 56 57 58
Review Copy
Table 3 Test results for shot peened aluminum 7075-T7351 corrosion pit specimens.
w mm t mm load steps kN Cycles /step E6 final Pmax kN final Smax MPa final step cycles ai mm 2ci mm af mm 2cf mm
Nominal Shot Peen Aluminum 7075-T7351 R=0.1
23.4 12.4 40 NA 40.0 141.7 89045* 0.84 1.85 1.98 4.19 23.4 12.4 44 NA 44.5 157.2 77107* 0.74 1.98 1.85 4.27 23.4 12.4 27 NA 26.7 94.4 251863* 0.94 2.11 1.60 3.15 22.9 12.4 18,22,27 3 26.7 95.5 6377641 0.86 1.78 1.50 3.02 22.9 12.4 18 NA 17.8 64.1 276391* 1.27 2.90 1.55 3.66 22.9 12.4 13 NA 13.3 48.1 49893* 1.19 2.92 2.01 3.89 22.9 12.4 22,27,31,36,40 3 40.0 143.9 262497 0.74 1.68 1.68 3.02 22.9 12.4 18,22,27,31,36 3 35.6 127.7 392494 0.71 1.70 1.07 2.46 22.9 12.4 27,31 3 31.1 108.6 498885 0.66 1.40 0.84 1.78 22.9 12.4 27,31,36 3 35.6 128.7 523297 0.69 1.88 2.41 5.79 22.9 12.4 18,22,27 3 26.7 96.2 573200 1.24 3.23 3.00 4.88
Nominal Shot Peen Aluminum 7075-T7351 R=0.7 23.4 12.4 22,27,31,36, 40,44,49,53 2 53.4 192.6 796450 0.86 1.55 1.17 2.24 22.9 12.4 36,40,44, 49,53 2 53.4 194.2 616643 0.89 2.11 1.60 3.38 22.9 12.4 36,44,53 3 53.4 193.9 3000000 1.24 3.07 2.64 4.52 22.9 12.4 36,44,53 3 53.4 191.7 418230 1.35 3.07 2.11 4.34 *first Step initiation
3 4 5 6 7 8 9 10 11 12 13 14 15 16 17 18 19 20 21 22 23 24 25 26 27 28 29 30 31 32 33 34 35 36 37 38 39 40 41 42 43 44 45 46 47 48 49 50 51 52 53 54 55 56 57 58
Review Copy
Table 4 Test results for heavy shot peened aluminum 7075-T7351 corrosion pit specimens.
w mm t mm load steps kN Cycles/ step E6 final Pmax kN final Smax MPa final step cycles ai mm 2ci mm af mm 2cf mm
Heavy Shot Peen Aluminum 7075-T7351 R=0.1
22.9 12.7 22 3 22.2 77.8 582909* 1.73 3.07 3.86 3.99 22.9 12.7 13,18,22,27 3 26.7 93.5 373952 1.70 3.51 3.99 4.32 23.1 12.7 18,22 3 22.2 77.4 1044904 1.73 3.28 4.88 5.51 23.1 12.7 18,22 3 22.2 77.4 439232 1.80 3.58 4.67 5.11 23.1 12.7 18,22 3 22.2 77.4 611853 1.75 3.73 4.19 4.06 23.1 12.7 9,13,18,22, 27,31 3 31.1 108.4 244487 1.75 3.76 3.45 3.30 23.1 12.7 18,22,27, 31,36 3 35.6 123.9 305803 1.30 3.07 3.23 3.76 22.9 13.0 18 3 31.1 108.6 244192* 1.32 3.12 2.95 3.86 23.1 13.0 24,31,36 3 22.2 77.2 261658 1.40 2.90 4.34 6.02 22.9 12.7 27,31 3 31.1 109.1 784017 1.35 3.15 3.61 3.30 22.9 12.7 27,31 3 31.1 109.3 340689 1.42 2.82 3.96 4.01 22.9 12.7 27,31,36 3 35.6 125.0 325466 1.30 2.54 3.84 3.91
Heavy Shot Peen Aluminum 7075-T7351 R=0.7 22.9 12.7 31,36,40,44, 49,58 3 57.8 202.2 612040 2.03 3.33 2.29 0.00 22.9 12.7 40,44, 3 44.5 155.6 2280781 1.78 3.30 3.23 4.29 22.9 12.7 40,44,49, 3 44.5 155.6 848822 1.83 3.23 3.43 4.90 22.9 12.7 40,44, 3 44.5 155.6 1133015 1.80 3.45 2.95 4.75 22.9 13.0 40,44,49 3 48.9 172.2 1119531 1.70 3.30 2.87 4.60 22.9 12.7 38,42 3 42.3 148.1 1530802 1.40 2.79 3.51 3.43 22.9 12.7 44,49 3 48.9 171.5 679779 NA 2.90 2.64 2.57 22.9 12.7 44,49 2 48.9 171.8 1369454 1.42 2.84 2.41 2.24 22.9 12.7 44,49,53,58 5 66.7 234.3 440039 1.35 2.67 3.48 4.04 25.7 12.9 49 3 48.9 152.8 2219412 1.40 3.25 3.00 3.53 *first step initiation
3 4 5 6 7 8 9 10 11 12 13 14 15 16 17 18 19 20 21 22 23 24 25 26 27 28 29 30 31 32 33 34 35 36 37 38 39 40 41 42 43 44 45 46 47 48 49 50 51 52 53 54 55 56 57 58
Review Copy
Table 5 Test results for bare 4340 steel corrosion pit specimens.
w mm t mm load steps kN Cycles /step E6 final Pmax kN final Smax MPa final step cycles ai mm 2ci mm af mm 2cf mm 4340 Steel Bare R=0.1 22.9 11.4 111 NA 111.2 437.5 491560* 0.99 2.16 1.27 3.48 22.9 11.4 100 NA 100.1 396.9 237177* 0.94 1.93 1.60 3.18 22.9 11.4 80,89,98,107 2 106.8 422.3 405660 0.91 1.19 1.07 1.52 22.9 11.4 89,102,116,129 2 129.0 510.3 88400 1.55 2.54 1.80 3.89 23.1 11.4 102,116,129 2 129.0 517.2 76264 1.35 2.44 1.91 4.22 23.1 11.4 89,102,116 2 115.6 463.7 155389 1.57 2.57 1.60 3.91 22.9 11.2 89,98,111 3 111.2 450.5 935503** 0.64 1.83 NA NA 22.9 11.2 89,98,111 3 111.2 446.9 1464655 0.58 1.78 1.37 3.25 23.1 11.2 89,98,111,124 2 124.5 498.2 285149 0.58 2.06 1.17 3.25 4340 Steel Bare R=0.7 22.9 11.4 124,142,156,169 3 169.0 674.0 285076 0.97 2.39 1.42 3.58 22.9 11.2 142,156,169,187, 205,222,242 2 242.4 972.0 1747582 1.47 2.49 2.51 3.25 22.9 11.2 147,164,182, 200,218,240 2 240.2 965.3 207141** 0.69 1.32 NA NA 22.9 11.2 142,156,169, 187,200,214 3 213.5 860.0 1014403 + 0.66 1.83 NA NA 22.9 11.2 156,169,182,200 2 200.2 803.5 427981++ 0.99 1.93 NA NA 22.9 11.4 178,196,214,236, 2 235.7 928.4 219982 0.58 1.17 1.42 1.73 22.9 11.4 178,196,214,231 3 231.3 926.4 198006 0.69 1.93 1.09 2.24 22.9 11.4 160,178,205,222 2 222.4 877.0 429015 0.69 2.13 1.65 3.40 *first step initiation, **spot weld initiation, +specimen propagated to fracture, ++hydraulic overload
Table 6 Test results for shot peened 4340 steel corrosion pit specimens.
w mm t mm load steps kN Cycles /step E6 final Pmax kN final Smax MPa final step cycles ai mm 2ci mm af mm 2cf mm
4340 Steel Shot Peen R=0.1
22.9 11.4 107,120,133,147 2 146.8 581.4 109104 1.27 2.54 2.01 4.09 22.9 11.4 133 NA 133.4 528.5 115860* 1.27 2.54 1.93 3.84 22.9 11.4 133 NA 133.4 528.5 98776* 1.22 2.46 1.93 1.14 22.9 11.4 98,107,116, 124,138 2 137.9 546.1 435489 1.17 2.39 2.01 3.66 22.9 11.4 147 NA 146.8 576.8 104055* 1.24 2.46 1.70 3.51 22.9 11.4 178 NA 177.9 699.3 40957* 0.71 1.93 1.70 2.49 22.9 11.4 133,147,160 2 160.1 634.2 69648 0.58 1.37 1.70 2.26 22.9 11.4 133,147 3 146.8 581.4 161259 0.56 1.17 1.32 1.80 22.9 11.4 133 NA 133.4 528.5 548291** 0.58 1.24 NA NA
4340 Steel Shot Peen R=0.7 22.9 11.4 169,187,205,222, 245,267,289 2 289.1 1,145.1 90243 1.19 2.46 1.65 2.77 22.9 11.4 205,222,245, 2 244.6 968.9 348067 1.17 2.06 1.85 2.06 22.9 11.4 205,222,245,267 2 266.9 1,057.0 43806 1.14 2.36 2.16 2.95 22.9 11.5 178,196 2 195.7 767.3 1965058 0.79 1.80 NA NA 22.9 11.4 222,245,267 2 266.9 1,057.0 318476 0.61 1.22 1.07 1.40
*first step initiation, **spot weld initiation 3 4 5 6 7 8 9 10 11 12 13 14 15 16 17 18 19 20 21 22 23 24 25 26 27 28 29 30 31 32 33 34 35 36 37 38 39 40 41 42 43 44 45 46 47 48 49 50 51 52 53 54 55 56 57 58
Review Copy
Table 7 Test results for laser peened 4340 steel corrosion pit specimens.
w mm t mm load steps kN Cycles /step E6 final Pmax kN final Smax MPa final step cycles ai mm 2ci mm af mm 2cf mm
4340 Steel Laser Peen, R=0.1 22.9 11.4 169,187,205,222, 245,267,289 2 289.1 1,145 90243 1.19 2.46 1.65 2.77 22.9 11.4 205,222,245, 2 244.6 968.9 348067* 1.17 2.06 1.85 2.06 22.9 11.4 205,222,245,267 2 266.9 1,057 43806^ 1.14 2.36 2.16 2.95 22.9 11.5 178,196 2 195.7 767.3 1965058*^ 0.79 1.80 NA NA 22.9 11.4 222,245,267 2 266.9 1,057 318476* 0.61 1.22 1.07 1.40
4340 Steel Laser Peen, R=0.7 22.9 11.4 89,97,111,124, 138,151,169 2 169.0 669.4 172034 1.22 2.59 2.06 3.81 22.9 11.4 178 NA 177.9 704.6 731953 1.17 2.57 3.53 4.60 22.9 11.4 151,169 2 169.0 669.4 313443 1.24 2.64 NA NA 22.9 10.9 151 NA 151.2 619.0 486065 0.79 2.44 NA NA 22.9 10.9 156,169 2 169.0 697.5 35096 0.71 1.96 NA NA
*first step initiation, ^cracking away from pit
Table 8 Test results for bare D6AC steel corrosion pit specimens.
w mm t mm load steps kN Cycles /step E6 final Pmax kN final Smax MPa final step cycles ai mm 2ci mm af mm 2cf mm
D6AC Steel Bare, R=0.1 22.9 10.2 80,84,89,98, 107 2.5 106.8 471.9 255223 0.61 1.73 1.14 2.64 22.9 7.9 80,76,80,84,93 80.1 456.7 175540* 0.58 1.65 1.27 2.59 22.9 8.9 49,58,67,76,84 2.5 93.4 467.9 337176 0.64 1.98 1.24 2.54 22.9 9.9 71,76,80,87, 3 84.5 379.7 345037 1.17 2.54 3.58 6.17 22.9 10.2 72,76,80,87 3 86.7 383.0 152714 1.14 2.51 1.40 3.38 22.9 9.9 72,76,80,84 3 84.5 383.2 521214 1.04 2.92 2.06 4.80 22.9 9.9 71,76,80,85, 102 3 102.3 465.1 114099 1.17 2.64 1.60 3.38 22.9 9.7 80,89 3 89.0 416.2 220434 1.17 2.79 1.73 4.06 22.9 10.2 89 89.0 395.2 441687* 1.17 2.64 2.16 3.81
D6AC Steel Bare, R=0.1 22.9 9.7 89,98,107,120, 133,147,160, 178,196 3 195.7 911.1 293769 0.58 1.47 1.22 2.26 22.9 10.2 147,160,173,191, 209 3 209.1 915.0 501709 0.56 1.70 1.50 2.95 22.9 10.2 160,173,191,209 3 209.1 935.9 334648 0.66 1.68 1.37 2.39 22.9 9.9 178,196 3 195.7 884.1 442707 0.64 1.57 1.30 2.54 22.9 9.9 177,196,214 3 213.5 954.7 644712 0.61 1.63 0.99 2.39 22.9 9.9 178,196, 3 195.7 890.9 515419 0.64 1.57 1.07 2.49 22.9 10.2 133,147,160,178, 196 3 195.7 865.2 1197348 1.32 2.90 NA NA 22.9 10.2 160,178,196,214 3 213.5 943.9 172600 1.22 2.82 1.65 3.28 22.9 10.4 178,196,214 3 213.5 929.9 277400 1.19 2.64 2.03 2.21
*first step initiation 3 4 5 6 7 8 9 10 11 12 13 14 15 16 17 18 19 20 21 22 23 24 25 26 27 28 29 30 31 32 33 34 35 36 37 38 39 40 41 42 43 44 45 46 47 48 49 50 51 52 53 54 55 56 57 58
Review Copy
Table 9 Test results for shot peened D6AC steel corrosion pit specimens.
w mm t mm load steps kN Cycles /step E6 final Pmax kN final Smax MPa final step cycles ai mm 2ci mm af mm 2cf mm
D6AC Steel Shot Peened, R=0.1
22.9 11.4 89,102,116,129 2 129.0 509.2 117366 1.17 2.39 1.93 3.25 22.9 10.7 167,120,133 3 133.4 561.2 117146 1.19 2.44 1.96 3.76 22.9 11.2 107 NA 0.1 431.5 200547* 1.14 2.41 1.63 3.73 22.9 11.2 93,107 3 0.1 428.6 199610 1.27 2.62 1.50 1.65 22.9 10.4 80,89,98,107 3 106.8 462.1 135610 1.22 2.87 1.83 5.49 22.9 11.4 89,98,107,116, 124,133,142, 151,160,173 3 173.5 682.4 79233 1.17 2.41 1.52 3.45 22.9 11.4 98,111, 2 111.2 439.9 210390 0.71 2.31 1.75 2.90 23.1 11.4 89 NA 89.0 350.3 231400* 0.61 1.40 1.32 2.79
D6AC Steel Shot Peened, R=0.7 22.9 11.2 160,173,187, 200,214,222 3 222.0 898.1 4000000> 1.24 2.39 NA NA 22.9 11.2 160,173,187, 205,220,245 2 244.6 992.2 200793 1.14 2.26 1.60 3.51 22.9 11.4 160,169 2 169.0 663.4 913680 1.19 2.49 1.91 3.58 22.9 11.4 160,173,187, 205,222,240 2 240.2 944.9 114308 1.22 2.39 1.63 3.30 22.9 11.4 178,196,214,236, 2 235.7 932.6 2000000 0.61 2.26 0.97 2.95 22.9 11.4 205,222 2 222.4 866.1 258696 0.64 1.32 1.37 1.63 22.9 11.4 160 160.1 632.1 661961 0.58 1.22 1.37 2.69 22.9 11.2 178,196,214, 231,240,267 3 266.9 1083.6 1699 0.58 1.22 0.94 2.29 *first step initiation, >aborted test
3 4 5 6 7 8 9 10 11 12 13 14 15 16 17 18 19 20 21 22 23 24 25 26 27 28 29 30 31 32 33 34 35 36 37 38 39 40 41 42 43 44 45 46 47 48 49 50 51 52 53 54 55 56 57 58
Review Copy
Fig. 1 Residual stress measurements for the aluminum 7075-T7351 (a), 4340 steel (b), and D6AC steel (c). 3 4 5 6 7 8 9 10 11 12 13 14 15 16 17 18 19 20 21 22 23 24 25 26 27 28 29 30 31 32 33 34 35 36 37 38 39 40 41 42 43 44 45 46 47 48 49 50 51 52 53 54 55 56 57 58
Review Copy
Fig. 2 Fatigue notch factors as a function of pit radius for aluminum and steel alloys.
Fig. 3 Specimen schematic and reference corrosion pit location. 3 4 5 6 7 8 9 10 11 12 13 14 15 16 17 18 19 20 21 22 23 24 25 26 27 28 29 30 31 32 33 34 35 36 37 38 39 40 41 42 43 44 45 46 47 48 49 50 51 52 53 54 55 56 57 58
Review Copy
Fig. 4 Fatigue crack initiation and propagation step test process.
Fig. 5 Al 7075-T7351 test results for bare and nominal shot peened specimens, R=0.1. 3 4 5 6 7 8 9 10 11 12 13 14 15 16 17 18 19 20 21 22 23 24 25 26 27 28 29 30 31 32 33 34 35 36 37 38 39 40 41 42 43 44 45 46 47 48 49 50 51 52 53 54 55 56 57 58
Review Copy
Fig. 6 4340 steel fatigue test results for all surface conditions, R=0.1. 3 4 5 6 7 8 9 10 11 12 13 14 15 16 17 18 19 20 21 22 23 24 25 26 27 28 29 30 31 32 33 34 35 36 37 38 39 40 41 42 43 44 45 46 47 48 49 50 51 52 53 54 55 56 57 58
Review Copy
Fig. 7 D6AC steel bare and shot peened test results for R=0.1. 3 4 5 6 7 8 9 10 11 12 13 14 15 16 17 18 19 20 21 22 23 24 25 26 27 28 29 30 31 32 33 34 35 36 37 38 39 40 41 42 43 44 45 46 47 48 49 50 51 52 53 54 55 56 57 58
Review Copy
Fig. 8 Threshold stress as a function of pit depth for aluminum 7075-T7351. 3 4 5 6 7 8 9 10 11 12 13 14 15 16 17 18 19 20 21 22 23 24 25 26 27 28 29 30 31 32 33 34 35 36 37 38 39 40 41 42 43 44 45 46 47 48 49 50 51 52 53 54 55 56 57 58
Review Copy
Fig. 9 Threshold stress for the 4340 steel as a function of pit depth. 3 4 5 6 7 8 9 10 11 12 13 14 15 16 17 18 19 20 21 22 23 24 25 26 27 28 29 30 31 32 33 34 35 36 37 38 39 40 41 42 43 44 45 46 47 48 49 50 51 52 53 54 55 56 57 58
Review Copy
Fig. 10 Threshold stress for the D6AC steel as a function of pit depth. 3 4 5 6 7 8 9 10 11 12 13 14 15 16 17 18 19 20 21 22 23 24 25 26 27 28 29 30 31 32 33 34 35 36 37 38 39 40 41 42 43 44 45 46 47 48 49 50 51 52 53 54 55 56 57 58