The University of Akron
IdeaExchange@UAkron
Honors Research Projects The Dr. Gary B. and Pamela S. Williams Honors
College
Spring 2018
Interfacial Corrosion of Copper and the Formation
of Copper Hydroxychloride
Mary Teague
Shengxi Li
The University of Akron, [email protected]
Hongbo Cong
The University of Akron, [email protected]
Please take a moment to share how this work helps youthrough this survey. Your feedback will be important as we plan further development of our repository.
Follow this and additional works at:http://ideaexchange.uakron.edu/honors_research_projects
Part of theAnalytical Chemistry Commons,Materials Chemistry Commons,Metallurgy Commons,Other Chemical Engineering Commons, and theOther Materials Science and Engineering Commons
This Honors Research Project is brought to you for free and open access by The Dr. Gary B. and Pamela S. Williams Honors College at IdeaExchange@UAkron, the institutional repository of The University of Akron in Akron, Ohio, USA. It has been accepted for inclusion in Honors Research Projects by an authorized administrator of
IdeaExchange@UAkron. For more information, please [email protected], [email protected]. Recommended Citation
Teague, Mary; Li, Shengxi; and Cong, Hongbo, "Interfacial Corrosion of Copper and the Formation of Copper Hydroxychloride" (2018).Honors Research Projects. 696.
Interfacial Corrosion of Copper and the
Formation of Copper Hydroxychloride
Senior Honors/Design Project 4250:497
Mary Teague
Faculty Advisor: Dr. Hongbo Cong
April 27, 2018
Teague 1 Executive Summary
Problem statement:
This project moved forward with the purpose of investigating waterline corrosion of pure copper in 4 M NaCl solution. Commercially pure copper (~99.9%Cu) is a commonly used material in circuitry, water lines, and several other large-scale uses. This project focused on understanding the three-phase boundary of solid to liquid to air, especially in regard to higher levels of pH values. Waterline corrosion and immersion testing was conducted to see on the micro-level what, where, and how corrosion products are forming. The hypothesis is that there are different corrosion product forming along the waterline. Some major limitations are the microscale this work is showing. Many times, data must be analyzed with an educated assumption. Likelihoods are important to understand in analysis of the waterline zone.
Quantitative Results:
Three distinct regions were clearly identified. They are the bulk, waterline, and spreading regions. Corrosion products formed at the waterline are characterized by micro-Raman spectroscopy, complemented by SEM/EDS, as a function of immersion time. The coexistence of four separate copper species is explained by thermodynamic equilibrium consideration of their likelihood. The composition of spreading region is determined and compared with the oxide film formation in different pH NaOH solutions. The anodic dissolution of copper exposed to the bulk electrolyte is investigated by electrochemical methods. The pH and potential profiles across three regions are proposed. From this, results are an understanding of the waterline corrosion of copper and the products that form along the substrate.
Teague 2 As time increases, so does waterline corrosion, with most corrosion occurring in the bulk solution. Different corrosion products form along the three main regions Cu2Cl(OH)3 forming with
longer immersion. The copper hydroxychloride, Cu2(OH)3Cl was determined to be clinoatacamite
by Raman spectroscopy. It formed directly in the waterline region and also precipitated in the bulk solution possibly due to the direct chemical reaction with oxygen. Lastly, possible pH and potential gradient spanning the bulk, waterline and spreading regions is expected.
Definite Conclusions:
In the bulk of the immersed copper surface, pitting corrosion was observed and Cu2(OH)3Cl was identified. This is important because it is the only corrosion formation here that
has chlorides in its molecular formula. Electrochemical investigation suggested that copper dissolved as CuCl2- and CuCl32- in 4 M NaCl solution. In the waterline region, the coexistence of
Cu2O/CuO/Cu2(OH)3Cl was found together with dissolved Cu(I) species. Thermodynamic
equilibrium consideration suggested a unique E-pH combination for the coexistence as will be discussed in the Data and Results section.
The spreading region consists mainly of Cu2O, with island-shaped CuO at the far edge of
the top. A comparison with passive films formed on copper surface in different pH NaOH solutions suggests that high pH of 14 or above is likely in the presence of stable Cu2O. CuO and Cu2O also
present in the thick corrosion product film in the waterline/meniscus region. Large portions covered with a compact layer of crystals. No chloride was detected throughout the entire spreading zone using EDS, which agrees well with the detection of only copper oxides using Raman spectroscopy. EDS results also showed that the lower regions of the spreading zone have higher oxygen content than the upper section of the spreading zone. This difference in oxygen content
Teague 3 indicates that the oxide film thickness decreased from the lower section to the upper section of the spreading zone.
Technical, Career, and Personal Implications:
Corrosion products formed at the waterline are characterized by micro-Raman spectroscopy, complemented by SEM/EDS, as a function of immersion time. The co-existence of four copper species is explained by thermodynamic equilibrium consideration. The composition of spreading region is determined and compared with the oxide film formation in different pH NaOH solutions. The anodic dissolution of copper exposed to the bulk electrolyte is investigated by electrochemical methods. The pH and potential profiles across three regions are proposed. The implications for this knowledge is working to better prevent corrosion susceptibility at the areas most likely to fail, here it is the area adjacent to the waterline zone in the bulk solution. The hypothesis of seeing different products was found true. The technical results can be managed for copper that is commonly used to understand the corrosion failure and prevent future failure. The testing as seen in the Experimental Methods section will show how all this knowledge was acquired. Personally, skills in technical corrosion machinery operation of potentiostats and scanning electron microscopes was gained to aid in understanding result analysis in the corrosion field. Improved independent thinking and confidence to take action was gained through conducting dozens of experiments from hours in length to days.
Recommendations:
This project is unique in the aspect of waterline corrosion for the material of commercially pure copper. It could be recommended to perform this testing on other materials to more fully understand the complexity of waterline corrosion for alloys and other commonly used materials. From the results gathered here, a further look into the effects of each corrosion product and how
Teague 4 to further limit the overall degradation of the substrate. Other students should focus on a material they will commonly see in their chosen career path.
Teague 5 Introduction
This project commenced with the intention to study the waterline corrosion of commercially pure copper in concentrated NaCl solutions, particularly 4N here. Micro-Raman technique, complemented by Scanning Electron Microscope (SEM) and Energy Dispersive X-ray Spectrometer (EDS), was used to analyze the corrosion products that form near the waterline. Electrochemical dissolution in the anodic region was determined by potentiodynamic polarization and the pH effect on the oxide film formation was studied by full immersion and cyclic voltammetry (CV) techniques. The corrosion product identification led to pourbaix diagrams being established. Finally, the potential and pH profiles were proposed for waterline corrosion of copper to better understand exactly what is occurring near this interface of corrosion activity interest.
Commercially pure copper and its alloys have extensively been studied due to their broad functions.1,2 Historic architecture and statuary has used copper for the aesthetically pleasing patina, as seen on the Statue of Liberty.3 Both electrical and mechanical equipment demand minimal
corrosion when exposed to the atmosphere, causing the need for copper usage from its corrosion resistive properties. Salt crystal loading has been applied to study the initiation and growth of atmospheric corrosion on the order of microns and has proven effective although it is a relatively new technique.4,6 This technique was not used directly in this project but was reviewed for understanding of general averages and result comparisons. Differential aeration cells7 were
observed, revealed by dissimilar corrosion products forming at different locations.8 Likewise, the phenomenon secondary spreading was often observed in the literature and this testing, which resulted in much larger area covered by a thin layer of electrolyte.6 The propagation and initiation of secondary spreading was credited to the surface tension at the interfaces between metal, electrolyte, and air interfaces5 and the generation of hydroxide film and/or hydroxyl by the oxygen
Teague 6 reduction reaction (ORR). For charge neutrality, cations like Na+ transport or migrate to the
secondary spreading zone and form NaOH locally.6 Similarly, the transport of anions like Cl- to the secondary spreading region is inhibited. Therefore, the protective properties of the oxide film was not compromised.9
The idea that the cathodic reaction occurs in the secondary spreading zone was proposed, causing a high pH around and mostly above 13pH and low Cl- environment surrounding. In droplet
testing, the anodic reaction occurs in the central region of the droplet due to the limited O2
accessibility.5,6 Another similarly important corrosion phenomenon of waterline corrosion
illustrated the standard differential aeration cells. In waterline corrosion the metal is severely attacked beneath the waterline while a cathode forms at and above the waterline mark.7 This waterline form of corrosion has been well studied for steel and zinc, but scarce information is available for copper.1 Consequently, this research work set out to investigate the waterline corrosion of copper in common, concentrated NaCl solution, related to the recent NaCl droplet corrosion study on copper.
Background
Copper has several corrosion products that can form in the same environment. The most common corrosion products for copper are either with Cu(I) or Cu(II) species. In high concentration, like greater than 1 M chloride environment, it is generally accepted that the primary species of Cu(I) complexes are CuCl2- and CuCl32-, and their ratio depends on the concentration of
both chloride and total Cu(I) species.10,11 The predominance changes from CuCl2- to CuCl32- with
increasing chloride concentration, however, the threshold chloride concentration (activity) is rather controversial.12,13 A large focus of the research is determining each exact species and their general
Teague 7 dominant concentrations by analytical and spectrophotometry techniques.11,15 These technical data
collection means were not without difficulties. The precise determination of the soluble Cu(I) species including overlapping and deconvolution, sensitivity and complicating side reactions.11 Some results of separate techniques indicate opposite theories. For example, a comparison between the Raman spectra of diethyl ether exacted Cu(I) and its aqueous counterpart suggested that the linear ion CuCl2- was dominant in the organic solvent, while a broad diffuse band in the aqueous
solution indicated the presence of more highly coordinated species such as CuCl32-.14 A large
portion of this project was spent analyzing results and determining the likelihoods of each and selecting what made the most sense.
The copper corrosion cathodic reaction normally observed as an irreversible charge-transfer-controlled ORR, dominated by the overall four-electron reduction to OH-.16 A cathodic reduction peak for ORR was observed at a potential of −0.3 to −0.4 V/SCE on copper in 1 mol/dm3
NaCl, and mixed control was deemed significant only at potentials more negative than −0.45 V/SCE.17 A competing idea is the dominant cathodic reaction instead was the reduction of previously oxidized copper. For copper etching in acidic cupric chloride solutions, Georgiadou et al. proposed that the role of oxygen was to regenerate the etchant, CuCl32-, via the oxidation of
etching product, CuCl32-, instead of being reduced directly.18 Lucey et al. proposed another similar
idea for the pitting corrosion of copper in drinking water, where oxygen oxidized Cu(I) to Cu(II) through an oxide membrane, which furthers the attack on a copper substrate.19,20 Additional evidence for the “concentration cell” effect is that copper does not display standard crevice corrosion morphology. The accelerated corrosion occurs outside the crevice former as opposed to traditionally the inside. This is divergent to the differential aeration cells theory.1
Teague 8 With the differential aeration cells layout, a higher pH cathodic region is observed. It is feasible that copper is in the passive state at this site due to sensitivity greatly affected by pH.21 Literature has illustrated Copper dissolution predominated over oxide formation in pH 8.8 borate buffer, while surface oxidation dominated at higher pH around 10 and higher.22 Passivation efficiency was found to increase significantly as pH was increased from 9 to 10 in potable water and pitting corrosion decreased notably at pH 10 after reaching a maximum at pH 9.24,25 The
isoelectric point (IEP) or pH of zero charge (pHpzc) for copper oxide and hydroxide is in the range of 9-10 pH.5,26 A general agreement is the duplex layer of Cu(I) and Cu(II) products structure that
forms on copper in neutral to alkaline solutions.27 The inner layer agreed to mostly being Cu2O
and the outer layer composition depending significantly on the solution chemistry.23 For instance, oxide film formation on copper in 0.1 M NaOH of pH 13 solution has been expansively investigated using electrochemical and surface characterization techniques. A Cu2O layer of
several nm thicknes29 forms initially through lateral growth mode28 and demonstrates epitaxial
relationship with the Copper substrate29 under low applied potentials like −0.25 V vs. SCE. Likewise, studies by in situ surface-enhance Raman spectra,30 electrochemical scanning tunneling microscopy,31 and in situ scanning tunneling microscopy32 revealed that the species are hydroxide or hydroxyl groups rather than the adsorbed oxygen, which may have a significant impact on the catalytic nature of the surface.16 Advancing anodic polarization leads to the formation of a thicker
defect-rich oxide with both crystalline and amorphous structures, as well as the possible hybrid species of Cu4O3.33 Upon polarizing to +0.37 V vs. SCE, the Cu2O layer transformed completely
into CuO with a porous outer layer of Cu(OH)2 formed on top.29 At higher than 12 pH,
thermodynamic equilibrium consideration suggests that CuO is unstable and likely dissolves as HCuO2- or CuO22-.21 This transition was suggested to be responsible for the different
Teague 9 microstructure observed during the fabrication of copper nanoparticles in high pH environment.34
The following sections include all methods used to clarify the understanding of waterline corrosion on commercially pure copper in higher pH values.
Experimental Methods
Sample preparation
The material used was oxygen free electronic (OFE) copper with a chemical composition of 99.99% (minimum) copper. Waterline corrosion samples were cut to dimension of 20 mm×30 mm× 5 mm from the 5 mm thick sheet. Each electrode was drilled, tapped, and mounted with a polytetrafluoroethylene (PTFE or Teflon) gasket on an electrode holder as described in ASTM G-5 standard.35 Immersion and potentiodynamic experiment samples were cut to dimensions of 15 mm × 15 mm. Before each experiment, the samples were well abraded using 320, 600, and 1200-grit SiC papers, ultrasonically cleaned in ethanol, rinsed with isopropanol, and dried under Argon gas (99.998%).
Electrochemical testing
The waterline experiments were conducted by partially-immersing the copper samples in 4 M NaCl solutions made from reagent grade NaCl (Fisher Scientific) and deionized (DI) water (18.2 MΩ·cm). The relative humidity (RH) equilibrated with 4 M NaCl solution in a sealed environment after 24 h was 85% measured by Extech 42280 Humidity datalogger (accuracy ±3%), which agrees with literature.36 Open circuit potential (OCP) points were continuously recorded throughout the entire immersion periods of 1, 3, and 5 days using a Gamry Reference 600+ potentiostat. A saturated calomel electrode (SCE) was used as the reference electrode (+0.241 V
Teague 10 vs. SHE)7 and all the potentials are referenced regarding SCE. Most experiments were conducted
in quiescent air. All free ports of the test cell (ASTM G5)35 were covered with parafilm with holes punctured to allow oxygen access but with minimal evaporation. When oxygen free environment was needed, solution was firstly sparged with Argon gas for a minimum of 2 h in a conditioning vessel and then transferred to the pre-sparged test cell. An inert atmosphere was maintained by purging the headspace with Ar gas to minimize oxygen ingression without disturbing the interface. After immersion, the samples were lightly rinsed using DI water, dried under compressed Argon, and stored in a dry box of RH less than 5% for later characterization techniques.
Potentiodynamic polarization experiments were conducted using a common three-electrode flat cell, with a platinum mesh counter three-electrode and an SCE reference three-electrode. The exposed area of the working electrode was approximately 1 cm2. All experiments were performed in deaerated NaCl solutions with different concentrations of NaOH for higher pH values. Table 1 lists the four tested molar concentrations, and corresponding weight percentage, density and molality. The mean activity coefficients were calculated using linear interpolation method with two nearest molality approximations.37 OCP delay was conducted for 1 h before the sample was polarized from −0.05 V/OCP to a current density limit of 10 mA/cm2 at a scan rate of 0.167 mV/s. Select potentiostatic hold experiments were also performed using this setup.
The passivation behavior of copper was studied in NaOH solutions with different concentrations: 0.01 M (pH 12), 0.1 M (pH 13), 1 M (pH 14), 2 M (pH 14.3) and 3.8 M (pH 14.4). The solutions were made of reagent grade NaOH pallets from Fisher Scientific and DI water and pHs were measured and, if necessary, adjusted using a calibrated pH meter. Experiments were conducted in a flat cell with alkaline resistant cell body and a salt bridge filled with the test solution to physically isolate the SCE from the test bulk solution to prevent contamination. Two types of
Teague 11 experiments were performed: full immersion (OCP) and cyclic voltammetry (CV). Immersion experiments were conducted for a period of 3 days in quiescent solutions with continuous OCP measurements. After immersion, the samples were lightly rinsed using DI water, dried under compressed Argon, and stored in the dry box for later characterization. The CV experiments were performed in deaerated NaOH solutions. Prior to testing, a cathodic potential of −1.3 V vs. SCE was applied to the working electrode for 10 min to remove any trace of air-formed oxide. The CV scans started at −1.3 V vs. SCE, scanned anodically to an apex potential of 0.8 V/SCE and then reversed cathodically to −1.3 V vs. SCE at the scan rate of 10 mV/s.29 Five scans were run for each
experiment and the CV curve from the last scan is presented.
Sample and solution characterization
The surface morphology and the compositional information of corrosion products were obtained using a TESCAN LYRA 3 field emission scanning electron microscope (SEM) equipped with an energy dispersive X-ray spectrometer (EDS). All SEM/EDS analyses were conducted with an accelerating voltage of 20 kV. Raman spectra of the corrosion products was gathered using a Bruker Senterra micro Raman spectrometer equipped with a 532 nm Nd:YAG laser with a maximum laser power of 20 mW. The laser power was kept low at 0.2 mW to avoid laser induced transformation of the corrosion products.38 The laser spot size was approximately 1 μm in diameter using the 50-magnification lens. The spectral resolution was 4 cm-1 and the acquisition time was 60s. Dissolved copper species were also subject to Raman spectroscopic analysis. After potentiostatic hold experiments, ampoule of deaerated solution from the copper side was quickly transferred to a quartz cuvette and placed in a portable i-Raman system from BWTEK Inc. equipped with a 532 nm laser. The Raman probe was inserted in a Raman cuvette holder to perform
Teague 12 the measurements. The laser power at the probe was approximately 33 mW and the resolution was 3 cm-1. The acquisition time was 2-20 min.
Selected samples were chemically cleaned for surface topographic analysis using an infinite focus microscope from Alicona InfiniteFocus (IFM). The cleaning solution was 6 M HCl made of reagent HCl from Fisher Scientific and DI water.39 The samples were fully immersed in the deaerated solution of 6 M HCl for 2 min, followed by rinsing with DI water and drying under Argon gas flow.
Data and Results
Note: all tables are in Appendix A and all figures are in Appendix B
Waterline corrosion - Corrosion potential evolution
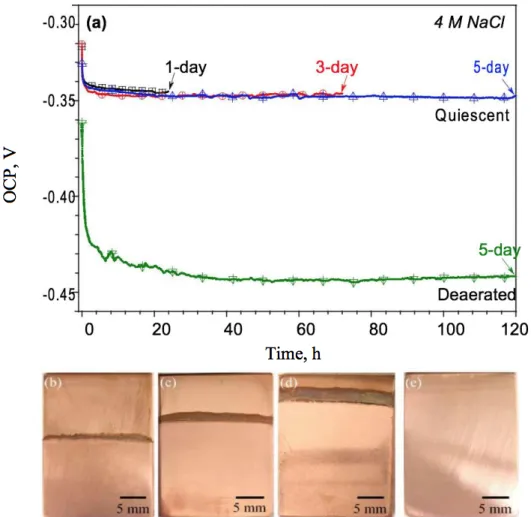
Figure 1a illustrates the OCP profiles of Copper in quiescent 4 M NaCl solutions during the 1 day, 3 day, and 5 day waterline immersion experiments. The 5 day trend tested in deaerated 4 M NaCl condition is also shown for comparison. In ambient conditions, the OCPs started at approximately −0.32 V vs. SCE and quickly decreased and stabilized at −0.345 V vs. SCE within an hour. In deaerated conditions, the OCP was approximately −0.36 V vs. SCE at the beginning, dropped below −0.43 V vs. SCE after several hours, and stabilized at approximately −0.44 V vs. SCE near the end of 5 days. Figure 1b-e exemplifies macroscopic morphologies of the Copper samples after their immersion. It demonstrates that the width of the corroded zone at the interface (discoloration) increased with increasing immersion time. No corrosion signatures were found for the deaerated case.
Teague 13 Micro-Raman spectroscopy was greatly used for characterization of the corrosion product evolution at the three-phase copper/air/solution interface. Raman results are in Figure 2 for the copper sample after 1 day immersion. Optical micrographs alongside Raman results aid in determining the approximate locations where theRaman spectra were collected. According to the corrosion product identification achieved by Raman analyses, three distinct regions can be identified: I) bulk; II) waterline region; and III)spreading zone. The spreading zone is from above the waterline to the very top featuring the formation of island- shaped corroded regions. On the segment of copper immersed in the bulk solution, small downy, mostly green particles are less than 1 μm in length were found and identified as Cu2(OH)3Cl via Raman as seen in Figure 2f and
2j. At thewaterline, Cu2O was the main corrosion product as Figure 2i shows. Waterline is defined
aswhen the corrosion morphology changes sharply from the bulk to the spreading region, as shown in Figure 2e. The spreading zone, above the waterline, on the copper surface had an orange color, but also appeared differently in some regions like as marked by an open arrow in Figure 2a. Nevertheless, both regions in Figure 2c and 2d showed Raman signal of Cu2O in Figure 2h. The
spreading zone highest point featured the formation of small island-shaped regions in Figure 2b, which were identified as CuO, in the Raman data in Figure 2g. Note that the CuO-containing region on the upper edge of the spreading zone was not well defined in some cases and Cu2O
mixed together with CuO.
The comparison between day 1 and day 3 for immersion testing showed some interesting change to the product formation and dominance. The copper sample that was partially immersed in the 4 M NaCl for 3 days had a spreading zone wider than that on the 1 day sample, as seen in Figure 3a. On the copper surface immersed in the bulk NaCl solution, Cu2(OH)3Cl was again
Teague 14 Figure 3e as compared to the 1 day sample in Figure 2f. One of the foremost dissimilarities from the 1 day case is the 3 day sample had developed a distinct waterline region, shown by the dashed lines in Figure 3a, which appeared darker than the spreading zone and bulk in the low- magnification image of Figure 3a. This region was mostly covered by a mostly brown corrosion product film seen in Figure 3d, and was identified as Cu2O through Raman in Figure 3i. The
black corrosion products in this region were found to be CuO, confirmed by Figure 3h. An important note is the weak signal of Cu2O in Figure 3h was found from the mostly brown
corrosion film under and around the CuO particles. Besides CuO and Cu2O, Cu2(OH)3Cl was also
detected in scattered locations in this region, with Raman spectra similar to those from the bulk seen in Figure 3j. Cl- containing corrosion products found in the region are marked by dashed lines in Figure 3a. This suggests that the region was in contact with the bulk solution. Similar to the 1 day case, the corrosion products in the spreading zone were mostly Cu2O Figures 3c and 3g,
although color differed by locations. Additionally, island-shaped CuO was detected on the very upper end of the spreading zone, as seen in Figures 3b and 3f. Another major difference from the 1 day case is that no pure CuO was detected in the upper edge of the spreading zone. CuO coexisted with Cu2O in this region instead, and confirmed by Figure 3f.
The copper sample after 5 day immersion developed similarly to the 3 day samples near the three-phase interface regions. The Raman spectroscopic characterization of the 5 day sample showed similar results as those for the 3 day sample in Figure 3. A minor difference is that there were more green particles, being Cu2(OH)3Cl, from the bulk on the 5 day sample than the 3 day
sample, which indicates more severe corrosion after longer exposure. Common sense would confirm this theory. Furthermore, as immersion time increases so does the width of the spreading zone.
Teague 15 Copper hydroxychloride, Cu2(OH)3Cl, is known to have several polymorphs with different
crystallographic structures, such as; atacamite, paratacamite, clinoatacamite, botallackite and anatacamite.38 Some polymorphs of Cu2(OH)3Cl are often observed in the atmospheric corrosion
of copper such as atacamite,40 with possible accelerated corrosion localized underneath them.41 Of these polymorphs, atacamite is the most common while botallackite is considered the least stable.3 Paratacamite is often mislabeled as the corrosion product of only pure copper. Recent findings suggest that paratacamite should have the chemical formula of (Cu, M)2(OH)3Cl, where M can be
nickel, cobalt or zinc, and thus may not exist as a pure copper mineral.38,42 The identification and
separation of atacamite and clinoatacamite is probably the most controversial issue since these dimorphs differ little in thermodynamic stability.42 It is hypothesized that their formation is likely controlled by kinetic factors.43 The several similar, yet distinctly different, polymorphs of copper hydroxychloride add to the difficulty of unambiguous characterization and appreciable confusion in the literature.3,42,44 This work conducted additional Raman spectra, especially in the high Raman
shift range, to determine the phase information of the Chloride-containing compound. The peaks in the range of 3200 – 3500 cm-1 match well with those of clinoatacamite,38 for all three cases seen in Figures 4a-c. Besides, the presence of peaks at approximately 800 cm substantiates the identification of clinoatacamite.44,45,46 Consequently, all the copper hydroxychloride corrosion products were identified as clinoatacamite according to Raman spectroscopic analysis.
SEM/EDS characterization
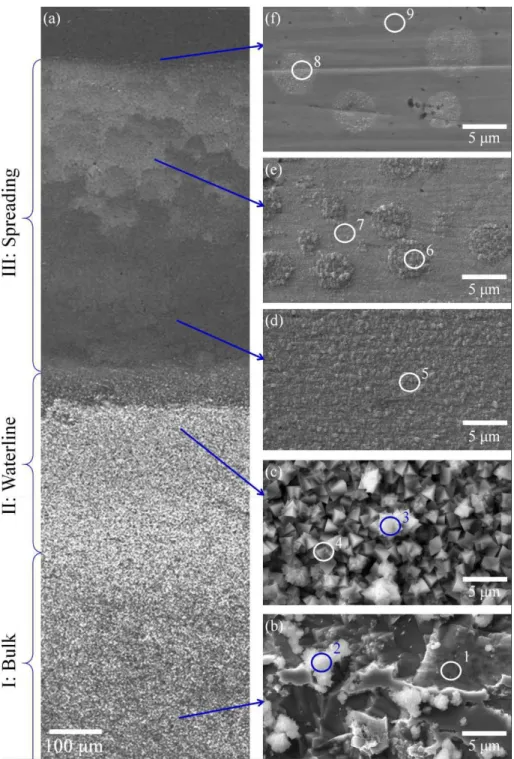
SEM/EDS was utilized to inspect the copper samples after waterline corrosion following Raman. Figure 5 presents the SEM/EDS characterization of different regions on a copper sample after 5 day waterline corrosion. Severe corrosion was seen on the sample surface in Figure 5b. EDS analysis of the corroded regions showed the presence of pure copper in region 1 of Table 2.
Teague 16 Some un-corroded regions were seen on copper after 5 day immersion on the lower right of Figure 5b. Some corrosion product particles were present on the corroded copper surface and showed high contents of chlorides by EDS analysis in region 2 of Table 2, which is consistent with the detection of clinoatacamite by Raman spectroscopy. Large portions of the waterline regions were covered with a compact layer of crystals shown in Figure 5c. EDS analysis indicated the universal presence of chloride in these regions of 3 and 4 in Table 2. However, the corrosion products in this region were also comprised of clinoatacamite with CuO and Cu2O according to Raman
analysis. In the spreading zone, a uniform corrosion product film was observed in the lower section of Figure 5d and a mixture of oxide film and island-shaped regions was found in the upper section of Figure 5e. The spreading zone uppermost section housed only island-shaped regions. No chloride was identified throughout the entire spreading zone using EDS in regions 5-9 of Table 2, which agrees with the detection of only copper oxides by Raman spectroscopy. Finally, the EDS results revealed the lower regions of the spreading zone have higher oxygen content than the upper section of the spreading zone in regions 5-8 of Table 2. This oxygen concentration gradient is evidence of decreasing oxide film thickness from the lower section to the upper section of the spreading zone.
Topographic analysis
After chemically cleaning off the corrosion products described in the Experimental Methods section, the 5 day copper sample was subject to examination using the infinite focus microscope (IFM) and the topographic analysis as exposed in Figure 6. Localized corrosion occurred on the copper surface that was in contact with the 4 M NaCl solution, including the bulk in Figure 6a and the waterline regions in Figure 6b. Numerous deep pits formed on the area immersed in the bulk, however, less corroded regions can also be seen with residual abrasion marks
Teague 17 under SEM. The morphology of copper near the waterline differs from bulk with smaller and more packed pits. The corrosion patterns follow the final abrasion marks, more noticeable in the bulk. A comparison of the depth profile analyses suggests that pitting is more severe in the bulk as seen in Figure 6c than the waterline region in Figure 6d. A point of keen interest is the average roughness for the spreading zone is much smaller than the un-corroded copper surface as seen in Figures 6e-h. This suggests that the corrosion oxidation process in the spreading region preferentially removes high energy locations like peaks and results in a more uniform, smooth surface.
In summary, three distinct regions are established for waterline corrosion of copper in 4 M NaCl solutions up to 5 days, (I) bulk, (II) waterline and (III) spreading region (Figure 7). In the bulk region (I), pitting corrosion occurred, and the corrosion pattern follows the abrasion marks. The main corrosion product was found to be clinoatacamite and its size and density increases with time. In the waterline region (II), smaller but higher density of pits were found. The initial corrosion product was mainly Cu2O and the coexistence of Cu2O/CuO/Cu2(OH)3Cl later being
found. In the spreading region (III), majority of the region was covered by Cu2O and the upper
edge of the region consists of dominant CuO and some Cu2O. The color change and oxygen
concentration gradient in this region suggest possible oxide film thickness decreases from the waterline to the upper edge.
Electrochemical investigation
Based on the corrosion regions identified, electrochemical techniques were applied to understand the electro-dissolution of copper in the bulk NaCl solution and the oxide film formation
Teague 18 on copper as a function of pH. Additionally, Pourbaix diagrams were established for the unique condition in the waterline region as seen in Figures 10 and 11.
Anodic dissolution of copper in chloride environment
Anodic polarization was performed in deaerated NaCl solutions with different concentrations to explain the chloride dependence of copper dissolution. The results are shown in Figure 8a. Similar Tafel slopes were found for all the concentrations investigated and can be seen in Table 1 and were calculated to be 55.2 ± 1.8 mV/decade for all cases. The cross-over potentials also decrease with increasing chloride concentration at approximately −100 mV/log[Cl-], suggesting the effect of chloride concentration on the formation of Cu-Cl complex. It was reported that for copper in high chloride solutions, the anodic reaction is under mixed charge-transfer and mass-transport controlling kinetics in the apparent Tafel region of up to −100 mV vs. SCE.10,17 After the initial formation of Cu-Cl complexes like CuCl2- at the interface,15 their diffusion into
the bulk solution occurs under mass-transport control due to their low diffusivity coefficient and low concentration.15,17 In comparison, the mass-transport effect is absent without the formation of complex species, like in H2SO4 solution.10 A reaction order of 2.34 with respect to Cl- was found
from the log(i) vs. log (aCl-) plot in Figure 8b, suggesting that each dissolved copper complexes with likely two or three chloride ions. This is in agreement with Lee et al.’s results in 4 M H+ solution,10 indicating negligible pH effect within the apparent Tafel region,17 in the absence of
oxygen.47
Potentiostatic hold experiment was then performed at −0.2 V vs. SCE for 24 hours in deaerated 4 M NaCl solution. The test solution was acidified by HCl to pH 1 to prevent the formation of hydroxyl complex at higher pH for the counter electrode. The total anodic charge was
Teague 19 integrated from the I-t curve and compared with the final volume loss measured by IFM. The comparison suggests that copper dissolves as Cu(I) at almost 100% efficiency.
Thus, a it was determined that copper dissolved as a mixture of CuCl2- and CuCl32- under
this condition. It was hypothesized that copper dissolution occurs in two or more consecutive steps in Cl- containing environment.48 The first step is,
𝐶𝑢 + 𝐶𝑙− ↔ 𝑘1
𝑘−1𝐶𝑢𝐶𝑙𝑎𝑑𝑠 + 𝑒
− Reaction (1)
Depending on the Cl- content, further dissolution of CuClads can occur as follows,
𝐶𝑢𝐶𝑙𝑎𝑑𝑠+ 𝐶𝑙− ↔ 𝑘2 𝑘−2𝐶𝑢𝐶𝑙2 − + 𝑒− Reaction (2) 𝐶𝑢𝐶𝑙𝑎𝑑𝑠+ 2𝐶𝑙− ↔ 𝑘3 𝑘−3𝐶𝑢𝐶𝑙3 2−+ 𝑒− Reaction (3)
For a fast reaction (1) in equilibrium and a low surface coverage of CuClads, the anodic current
density (ia) for reaction (3) can be derived as follows.48
𝑖𝑎 𝑛𝐹 = 𝑘1𝑘3 𝑘−1 𝑎𝐶𝑙 − 3 𝑒𝑥𝑝 (𝐹 𝑅𝑇𝜂) − 𝑘−3𝑎𝐶𝑢𝐶𝑙32− Reaction (4)
Accordingly, ia exhibits a 59.1 mV (F/RT) potential dependence at room temperature and a
reaction order of 3 with respect to chloride activity. Similarly, when reaction (2) is the rate-determining step, the same Tafel slope can be determined, but a lower reaction order of 2 is deduced.48 Something to note is chemical equilibrium also exists for:
𝐶𝑢𝐶𝑙2−+ 𝐶𝑙− ↔ 𝐶𝑢𝐶𝑙 3
Teague 20 Raman spectroscopy was performed on the solution in cuvette immediately after potentiostatic hold experiments. The total dissolved Cu(I) species was calculated to be 2.2 mM from total charge and volume loss analysis. Theoretical calculation suggests an optimal Raman peak at 277 cm-1 for CuCl2- in aqueous solutions.14 Conversely, it failed to pick up any signal
around this frequency. Repeated efforts at higher concentration, up to 0.1 M Cu(I) was unsuccessful for identifying CuCl2- in the solution. Comparably, no CuCl32- peaks from Raman
spectra can be identified based on theoretical calculation. It should be noted that the Raman system was firstly evaluated using Na2SO4 solutions and typical Raman peaks for SO42- can be
distinguished for a concentration as low as 0.01 M.
The coexistence of different copper phases at waterline
At the waterline region, three solid phases were found to coexist with the soluble Cu(I) species, Cu2O, CuO and Cu2(OH)3Cl. Possible equilibrium reactions and their thermodynamic
expressions in Table 3 were considered for the construction of Pourbaix diagrams shown in Figures 10 and 11. The Gibbs energy of formation was obtained from either Atlas of Electrochemical Equilibria21 or EPA publication49 and verified by SKB report.50 The Gibbs free energy of formation for clinoatacamite is −1341.8 kJ/mol and was referenced from R. L. Frost, which is slightly lower than at −1339.2 kJ/mol for atacamite.42 A unique point exists for the equilibrium of these species, at pH 8.95 and potential of −0.1 V vs. SCE and the corresponding total dissolved Cu (I) species (CuCl2- and CuCl32-) concentration is 1.09 mM. This was determined
via the following steps.
Firstly, the equilibrium between CuO and Cu2(OH)3Cl, as iii see in Table 3, yields a pH of
Teague 21 equilibrium reaction between CuO and Cu2O, as ii see in Table 3, which is −0.1 V vs. SCE at pH
8.95. Thirdly, the soluble CuCl2- species was determined by the reaction vi in Table 3, and it is
0.63 mM. Finally, all the calculations were verified by the equilibrium reaction between CuCl2
-and Cu2(OH)3Cl as vii in Table 3 and between Cu2O and Cu2(OH)3Cl as iv in Table 3. A threshold
pH exists which below that Cu2(OH)3Cl is stable and above which CuO is stable, has been
previously reported. In their chemical syntheses of copper nanoparticles, Engelbrekt et al. observed the formation of Cu2(OH)3Cl in neutral pH region between 6.4-8.5 pH and CuO in high pH region
between 10.3-12.7 pH.34 Strandberg et al. suggested that CuO is stable at pH greater than 8 in 1 M
chloride solution, by considering the equilibrium between CuO and Cu2(OH)3Cl.43 Furthermore,
Elzey et al. argued that the presence of copper oxides in a sufficient amount is required for the formation of Cu2(OH)3Cl, rather than other copper chloride phases.51
All steps were completed with the third step being repeated for the calculation of CuCl3
2-concentration by reaction ix in Table 3. The 2-concentration of CuCl32- is 0.46 mM and verified by
considering the reaction between CuCl32- and Cu2(OH)3Cl as reaction x in Table 3. The CuCl3
2-concentration is comparable but slightly lower than the CuCl2- concentration, which is in
accordance with the reaction order found in Figure 9 by first-order approximation. Therefore, the total dissolved Cu(I) species is 1.09 mM, ignoring other minor species.
The Pourbaix diagram was also constructed for 1 M CuCl2- for comparison. As shown in
Figure 11, the Cu2O stable region is expanded at the expense of the soluble species, CuCl2-. An
equilibrium between the Cu2O and Cu2(OH)3Cl is established in the neutral pH range of 5.8-8.9
pH. During their study on copper corrosion under the chloride-containing thin electrolyte layers, Liao et al. observed that an initial Cu2O dominant layer partially converted into Cu2(OH)3Cl, and
Teague 22
Oxide formation and growth in the spreading zone
A note of interest is the majority of the spreading zone consists of Cu2O, while at the edge
of the spreading zone Cu2O coexists with CuO. To identify the oxide formation as a function of
pH for copper, 3 day immersion tests were performed on copper in quiescent NaOH solutions with varying concentrations of 0.01 M (pH 12), 0.1 M (pH 13), 1 M (pH 14), 2 M (pH 14.3) and 3.8 M (pH 14.4). The RH in equilibrium with 3.8 M NaOH was measured to be 88% and hypothesized to be the possible equilibrated pH in the secondary spreading region when the bulk solution is 4 M NaCl. Figure 12 compares the OCP profiles and the general trend is that the OCP of Cu decreased with the increase of NaOH concentration. In pH 12 and 13 solutions, the OCP values of copper were relatively stable throughout the 3 day immersion, at −0.17 and −0.2 V vs. SCE, respectively. In 1 M NaOH solution, the OCP of Cu started at low values around −0.55 V vs. SCE and increased sharply to higher values around −0.32 V vs. SCE and stabilized after 2 h immersion. Similar OCP increase to around 0.2 V vs. SCE was also observed in 2 M NaOH solution at longer immersion time, roughly 62 h, from −0.57 to −0.39 V vs. SCE. The OCP of the Cu sample in 3.8 M solution quickly stabilized at −0.6 V vs. SCE upon immersion and did not show abrupt increase during the 3 day immersion. Regarding the appearance of the exposed surface, it was seen that black films formed on the copper surface at pH values of 13 or less and Raman spectroscopic analyses suggested that they were all composed of CuO as seen in Figure 13.33 In comparison, the
copper surfaces appeared diverse from 1 to 3.8 M NaOH solutions and Raman analyses suggested Cu2O as the major corrosion products. In addition, possible crevice corrosion may have occurred
underneath the O-ring.
The CV experiments were also performed to clarify the oxidation mechanism for copper in NaOH solutions. The result in 0.1 M at approximately pH 13 of NaOH solution in Figure 14a
Teague 23 compares favorably with previously published results.29,33 In general, the pair of A
1/C1 peaks
corresponds to the oxidation and reduction of Cu(I) species and the A2-A3/C2 peaks correspond to
the oxidation and reduction of Cu(II) species.52 At pH 14 in Figure 14b, the existence of peak A2
can still be distinguished from peak A3 by the change of slope. When the NaOH concentration is
further increased to 3.8 M in Figure 14c, peak A2 can no longer be identified and correspondingly,
the reduction peak for Cu(II), C2, disappeared from the reduction curve. The comparison between
the peak height for Cu(II) formation, A2-A3, and the corresponding reduction, C2, implies that
oxidation to Cu(II) increases significantly with pH but only a small fraction is reduced. This indicates that a large fraction of the Cu(II) species are possibly dissolved into the solution53 and a low passivation efficiency is seen at high pHs.23,54 The peak A3 can be possibly assigned to the
formation of soluble Cu(II) species, like CuO22-21 and Cu(OH)42-.34,52,53 This peak is much smaller
and less defined at pH 12. Solid phase Cu(II) species, like CuO/Cu(OH)2 can still be found at pH
13 at peak A2/C2, which agrees with the OCP measurement and Raman characterization in Figure
14. At higher NaOH concentration of 1 M and above, a small amount may be present, but Raman measurements did not pick up any signal. The soluble Cu(II) species may be reduced on the cathodic scan and contribute to the complex shape of C1 peak as compared to pH 12.55 The steady
state OCPs at the end of 3 day immersion are also superimposed on the CV diagrams to aid in analysis. At pH 13, the formation of Cu(II) oxide is favorable. In 3.8 M NaOH solution, the steady state OCP falls below the formation peak of Cu(I), suggesting active dissolution and exposure of bare Cu surface. This also occurs in 1 M NaOH solution for the initial 2 h in Figure 14a, yet, the sharp increase of the OCP suggests that a complete coverage of Cu2O is likely achieved and
Teague 24 on the surface is possibly through a dissolution/re-precipitation mechanism53 and the time to reach
complete coverage increases with NaOH concentration.
The comparison between the immersion and CV tests in bulk NaOH solutions and the spreading zone characterization implies that pH may have risen over 13 in the spreading zone. Neufeld et al. reported a measured pH of approximately 13 in the large secondary spreading zone on Zn during atmospheric corrosion.6 Based on the principle of galvanic corrosion,7,36 the reaction
rate of ORR may decrease with increasing distance from the waterline, so a pH profile may be established in the spreading zone, as a higher pH near the waterline and lower pH at the far edge may be found. Lower cathodic efficiency and lower pH equal to 13 pH or less at the far edge may have led to the formation of island-shaped CuO. At the waterline, cathodic efficiency is high, which leads to high local pH and preferential formation of Cu2O. The formation of Cu2O is often
observed on copper during atmospheric corrosion, especially in the early stage. H. Strandberg et al. found Cu2O-covered cathodic areas with reflective black spots remained in the passive state
after 4 weeks of exposure to 70% RH.43 Liao et al. demonstrated that Cu2O formed initially on the
copper surface under thin electrolyte layer, and its amount increased with decreasing layer thickness.40 It was reported that an interfacial pH increase, as high as six pH units,47 can occur via ORR during the natural corrosion of copper.17 It is probable that the separation of anode and cathode leads to an even higher pH in the spreading region.
The presence of a Cu2O dominant region also has a substantial impact on the whole reaction
rate. It was suggested that for ORR on copper, the most catalytic surface contains both Cu(I) and Cu(0) sites.16,17 Although Cu2O was detected as the dominant corrosion product ex-situ, the in-situ
Teague 25 Cu2O, ORR is hypothesized to occur through the following reaction at pH values greater than 13
pH.
2𝐶𝑢2𝑂 + 𝑂2+ 4𝐻2𝑂 + 8𝑂𝐻− → 4𝐶𝑢(𝑂𝐻) 4
2− Reaction (6)
The regeneration of Cu2O can occur electrochemically via the reduction of Cu(OH)42-.
2𝐶𝑢(𝑂𝐻)42−+ 2𝑒− → 𝐶𝑢
2𝑂 + 6𝑂𝐻−+ 𝐻2𝑂 Reaction (7)
Therefore, the presence and width of the Cu2O zone suggests the effective cathodic region
during the waterline corrosion. The presence of island-shaped CuO at the edge indicates the boundary limit. As the spreading zone grows farther upwards, the CuO islands at the previous edge were converted to Cu2O, possibly through pH change and regeneration reaction. The early
formation of Cu(OH)2/CuO layers and their later conversion to a Cu2O dominant layer via
proportionation reaction was reported by Nakayama et al.56 Figure 15 shows the time evolution of the spreading zone width based on multiple measurements and the fitting indicates that the average growth of spreading zone followed t0.4, similar to the t0.5 dependence reported by Neufeld et al.6 It is believed the dissolution and re-precipitation Reactions 6 and 7 at high pH values equal or greater than 14 lead to smoother surface in the spreading region compared to the un-corroded area as seen in Figure 6.
The formation of Clinoatacamite
The waterline experiments ended with milky test solution, and the turbidity increased with the exposure time. Sediments from corrosion fell to the bottom of the solution container after storing the solution in ambient air for a period of several days. These particles were collected by filtering the solution with filter paper from WhatmanTM with pore size of 11 μm. They were then
Teague 26 characterized by Raman spectroscopy. The result showed that the compound is clinoatacamite, similar to the mostly green particles formed at the bulk and waterline as seen in Figure 2j and Figure 3j. A plausible explanation is the direct oxidation of dissolved Cu(I) species by O2 in the
electrolyte. For example,
4𝐶𝑢𝐶𝑙2−+ 𝑂2+ 4𝐻2𝑂 → 2𝐶𝑢2(𝑂𝐻)3𝐶𝑙 + 6𝐶𝑙−+ 2𝐻+ Reaction (8)
This can be further supported by the fact that clinoatacamite formed by exposing initially clear Cu(I) solutions from potentiostatic hold experiment in the open air, in the absence of copper metal. This may offer a possibility for the early detection of clinoatacamite on the copper surface immersed in the bulk solution as seen in Figure 2. The existence of a precipitated Cu(II) corrosion product layer, presumably Cu2(OH)3Cl, in ambient chloride solutions was reported previously.15,48
Moreover, Dekov et al. distinguished two types of naturally-formed atacamite at the submarine vent fields. Type 1 atacamite formed on the parent copper sulfides by direct precipitation while type 2 atacamite precipitated at some distance away from the parent copper sulfide, through the diffusion of initially formed soluble Cu(I)-Cl complex from Reaction 8.57 Likewise, it can be
argued that type 1 clinoatacamite was found at the waterline, while type 2 formed in the solution before precipitation.
Potential and pH Profile
Based on the above results, the pH gradient near the waterline region is postulated. A unique pH of 8.95 has been determined at the waterline by the coexistence of several copper species. This matches the IEP (pHPZC) of copper oxide and hydroxide, and, hence, surface interfacial tension is anticipated to be the highest at the waterline.5 Higher pH values of 14 or
Teague 27 of Cu2O and galvanic coupling theory. Relatively lower pH of 13 or less is estimated at the far
edge, because of the lower efficiency of ORR and the detection of CuO. The pH drops abruptly into the bulk solution and decreases to around 7 pH like the measured solution pH.
Correspondingly, a steep decrease in the potential is expected in a small region within the waterline. Previous Kevin probe measurements demonstrated a sharp potential drop of 0.15 to 0.3V in the interfacial region.5,6 At pH 8.95, the coexistence of several copper species establishes
an equilibrium potential of -0.1 V vs. SCE. Higher potential is assumed in the spreading zone, due to its cathodic nature and hardly-polarized ORR because of the unlimited access of oxygen,1 but
with possible IR drop effect. The potential can possibly decrease to −0.44 V vs. SCE deep into the solution if oxygen is completely depleted as seen in Figure 1a. It should be noted that the corrosion morphology does not exhibit noticeable acceleration of corrosion in the waterline region as seen in Figure 6. The pit morphology in the waterline region appears to be higher density, which may offer a greater propensity toward oxidation.51 In contrast, larger and deeper pits were found in the
bulk region. This may be caused by the diffusion barrier (Cu2O/CuO/Cu2(OH)3Cl) created at the
waterline region,41 whereas CuCl2-/CuCl32- is the dominant species by anodic dissolution in the
bulk, and a film free surface is expected.17
Discussion and Analysis
Design
Testing was conducted with a common three-electrode flat cell. Platinum mesh was the counter electrode and a SCE electrode was used as the reference electrode. The exposed area of the working electrode was approximately 1 cm2. All experiments were performed in deaerated NaCl solutions with different concentrations of NaOH for higher pH values. Table 1 lists the four
Teague 28 tested molar concentrations, and corresponding weight percentage, density and molality. The mean activity coefficients were calculated using linear interpolation method with two nearest molality approximations.37 OCP delay was conducted for 1 h before the sample was polarized from −0.05 V/OCP to a current density limit of 10 mA/cm2 at a scan rate of 0.167 mV/s. This setup was simple but useful for the data collection and identification of corrosion products as visually shown in Figures 2 and 3.
Industrial Effects
Copper has been used in consumer products for more than 10,000 years when the copper pendant was found in 8700 B.C. near Iraq.64 Now copper is heavily in use for water lines, electrical appliances, lubricants, medical implants, and new technical advances such as Tesla electric cars. Modern vehicles each have 63-138 lb of copper on average. Boeing 747 jet planes uses 9,000 lb of copper. Anything from artwork to railroads to instruments to an MRI machine hold some percentage of copper. Its antimicrobial, conductivity, and malleability are a few of the many useful properties of copper. Even the Occupational Safety and Health Administration (OSHA) has regulations requiring the usage of copper.64 As a semi-precious metal, the current price of copper is $3.11/lb. This cost of copper is high for large projects, especially as the third highest used metal, behind iron and aluminum. In 2008, every American was estimated to use 1,309 lb of copper during their lifetime for necessities, lifestyle, and health.64
With all the above in mind, the general and pitting corrosion than can eventually occur from waterline corrosion is concerning. Stagnant waterline corrosion in common households may result in internal corrosion.62 This allows for contaminant leakage into drinking water which is very hazardous to health or eventual failure of the line. Brian Oram of the Water Research Center,
Teague 29 says regarding waterline corrosion, “primary concerns include the potential presence of toxic metals, such as lead and copper; deterioration and damage to the household plumbing, and aesthetic problems such as: stained laundry, bitter taste, and greenish-blue stains around basins and drains.”63 The primary source of copper is the leaching of copper from the household piping used to convey the water throughout the home. In some cases, the water is so corrosive that the interior plumbing system needs to be changed and completely replaced with PVC piping, PEX, or other materials. The installation of a neutralizing system before the piping is installed and causes leaks throughout the home would be beneficial.63
In soft water, corrosion occurs because of the lack of dissolved cations, such as calcium and magnesium in the water. In scale-forming water, a precipitate or coating of calcium or magnesium carbonate forms on the inside of the piping. Controlling the corrosivity of the water is important for preventing this corrosion. Maintaining a neutral pH, active use, and filtration system to prevent introduction of carbon dioxide and other gases along with bacteria and large particles is important. The cost of corrosion can be incredibly expensive. The cost of corrosion is seen in a decrease in efficiency of hot water heaters and may cause premature failure to the heater, premature failure of household plumbing and plumbing fixtures, elevated levels of metals causing the need for continual purchases of bottled water or both acute and chronic health problems.63
The cost in total could amount to a staggering number. A NACE corrosion study estimated 34.7% of the yearly costs of corrosion on utilities could be more than $50,000,000 for the US alone.65 The number does not include the cost of medical bills and miscellaneous results from the corrosion for individuals. The characterization of the waterline corrosion on copper from this research will, hopefully, lead to fully understanding how to prevent this from occurring. By understanding what is there, research can now be put forth for preventing the formation of each of
Teague 30 the copper species forming on any copper alloy or commercially pure copper material. Eventually, the results shown in this report will lead to better corrosion mitigation methods for copper, a metal so common in everyday life.
Cost and Safety
Cost gathered through this project are costly equipment and compensation for researchers. The Gamry 600+ potentiostats, used for all electrochemical testing, costs near $20,000. Thankfully, the other equipment utilized were already in the hands of the University of Akron laboratory and their sponsors. An SEM from TESCAN with LERA 3 double beam system capabilities may cost upwards of $1,000,000, while a Raman spectrometer from Bruker Senterra would cost around $30,000. The general lab equipment of ultrasonic bath, argon gas, SiC polishing paper, polishing machine, gloves, glassware, the material and miscellaneous items could be approximated to be well over $100,000. The average salary for a research technician is $40,47458 and for a research scientist it is $77,225.59 Since this project took approximately six months of
focus, the salaries combined and divided by two could be ensured by a similar project. This total of $58,850 combined with miscellaneous costs like material and argon gas made this project cost below $100,000. Although, if a laboratory lacking in the more advanced machinery wished to conduct this work, it could cost in the upwards of $1,250,000 unless they plan on contracting the usage of them. The Alicona 3D InfiniteFocus price could not be found but due to its cutting-edge technology, the cost would most likely be above the cost of the SEM.
In Regard to safety, it should be clear that proper personal protective equipment be worn in every test. Nitrile gloves, well-covering glasses, and fully covering clothing were worn. This is to ensure that the NaOH salt and the resulting highly basic solution does not come into contact
Teague 31 with skin or more sensitive regions, such as eyes. Medical assistance would have been sought if contact occurred. It was understood that washing with cold water in eyes or on skin was the first immediate step before seeking medical assistance.60 The potentiostat was turned on and off after connecting and never touched metal to skin to ensure no electric shock was possible. Any radiation was safely encased within the machines with firm closure of the equipment doors in accordance with the equipment manuals. It is crucial to follow the safety precautions for each of the intricate machines. The SEM warns to never touch the ceramic parts of the gun due to their function as a high voltage isolator. It is prohibited to use powder gloves and to clean the ceramic parts in any way to avoid contact with any working parts.61
Restraints
The microscale itself is full of assumptions due to the lack of seeing is believing evidence. The SEM may tell you the elements there and Raman may often describe certain molecular structure, but it is up to the experience and interpretation of people actually conducting the testing using theoretical and testing results to make theories and conclusions. The many polymorphs of copper hydroxychloride add to the difficulty of unambiguous characterization and appreciable confusion in the literature. Thicknesses of corrosion product and films could not be certain of, but coloration differences with time are interpreted to mean thickness change. Being technically trained to personally conduct the work with advanced microscopes is another hurdle to overcome. For most of the microscope work, more trained individuals had to instruct or conduct the work themselves for this project.
Teague 32 The development of waterline corrosion on copper in 4 M NaCl solutions over time was investigated and three distinct regions were identified: (I) bulk, (II) waterline and (III) spreading regions. These regions are in agreement with other waterline studies as with nickel and zinc, although products differ in respect to copper. The following conclusions can be drawn from the above project:
In the bulk of the immersed copper surface, pitting corrosion was observed and Cu2(OH)3Cl was identified. Electrochemical investigation suggested that copper dissolved as
CuCl2- and CuCl32- in 4 M NaCl solution. In the waterline region, the coexistence of
Cu2O/CuO/Cu2(OH)3Cl was found together with dissolved Cu(I) species. Thermodynamic
equilibrium consideration suggested a unique E-pH combination for the coexistence. The spreading region consists mainly of Cu2O, with island-shaped CuO at the far edge. A comparison
with passive films formed on Cu surface in different pH NaOH solutions suggests that high pH (≥ 14) is likely in the presence of stable Cu2O. The copper hydroxychloride, Cu2(OH)3Cl was
determined to be clinoatacamite by Raman spectroscopy. It formed directly in the waterline region and also precipitated in the bulk solution possibly due to the direct chemical reaction with oxygen. As time increases, so does waterline corrosion. Most corrosion is seen in the bulk solution. Different corrosion products form along the three main regions with Cu2Cl(OH)3 (Clinoatacamite)
forming with longer immersion. Lastly, possible pH and potential gradient spanning the bulk, waterline and spreading regions is expected.
Recommendations
In the future, a comparison between copper and other materials may be made to further understand the effect of waterline, especially in regard to other materials commonly used in
Teague 33 industrial standard alloys. Further testing at longer periods would also be helpful in determining further evolution of the corrosion products on the commercially pure copper material.
Literature Cited
1. R. Francis, The corrosion of copper and its alloys: a pratical guide for engineers, NACE 506 International, Houston, TX, USA, 2010.
2. C. Leygraf, I.O. Wallinder, J. Tidblad, T. Graedel, Atmospheric corrosion, Second ed., John Wilely & Sons Inc., Hoboken, NJ, USA, 2016.
3. D.A. Scott, Copper and Bronze in Art: Corrosion, Colorants, Conservation, The Getty Conservation Institute, Los Angeles, CA, USA, 2002.
4. R.F. Schaller, C.F. Jove-Colon, J.M. Taylor, E.J. Schindelholz, The controlling role of sodium and carbonate on the atmospheric corrosion rate of aluminum, npj Materials Degradation, 1 (2017) 20.
5. Z.Y. Chen, D. Persson, A. Nazarov, S. Zakipour, D. Thierry, C. Leygraf In Situ Studies of the Effect of CO2 on the Initial NaCl-Induced Atmospheric Corrosion of Copper, J. Electrochem. Soc., 152 (2005) B342-B351.
6. A.K. Neufeld, I.S. Cole, A.M. Bond, S.A. Furman, The initiation mechanism of corrosion of zinc by sodium chloride particle deposition, Corros. Sci., 44 (2002) 555-572.
7. D.A. Jones, Principles and prevention of corrosion, 2 ed., Prentice Hall, Inc., Upper Saddle 520 River, NJ 07458, 1996. 521
8. S. Li, L.H. Hihara, In situ Raman spectroscopic identification of rust formation in Evans' 522 droplet experiments, Electrochem. Commun., 18 (2012) 48-50.
9. A.D. Modestov, G.-D. Zhou, H.-H. Ge, B.H. Loo, A study by voltammetry and the photocurrent response method of copper electrode behavior in acidic and alkaline solutions containing chloride ions, J. Electroanal. Chem., 380 (1995) 63-68.
10. H.P. Lee, K. Nobe, Kinetics and Mechanisms of Cu Electrodissolution in Chloride Media, J. Electrochem. Soc., 133 (1986) 2035-2043.
11. Y. Meng, A.J. Bard, Measurement of Temperature-Dependent Stability Constants of Cu(I) and Cu(II) Chloride Complexes by Voltammetry at a Pt Ultramicroelectrode, Anal. Chem., 87 (2015) 3498-3504.
12. H. Zhao, J. Chang, A. Boika, A.J. Bard, Electrochemistry of High Concentration Copper Chloride Complexes, Anal. Chem., 85 (2013) 7696-7703.
13. S. Kazuhiko, F. Ayako, A Spectrophotometric Study of Copper(I) Chloro-Complexes in Aqueous 5M Na(Cl, ClO4) Solutions, Bull. Chem. Soc. Jpn., 49 (1976) 82-86.
14. J.A. Creighton, E.R. Lippincott, 983. Raman spectra and solvent-extractions of cuprous halides, Journal of the Chemical Society (Resumed), (1963) 5134-5136. 537 [15]
15. J. Crousier, L. Pardessus, J.P. Crousier, Voltammetry study of copper in chloride solution, 538 Electrochim. Acta, 33 (1988) 1039-1042.
16. F. King, M.J. Quinn, C.D. Litke, Oxygen reduction on copper in neutral NaCl solution, J. Electroanal. Chem., 385 (1995) 45-55.
Teague 34 17. G. Kear, B.D. Barker, F.C. Walsh, Electrochemical corrosion of unalloyed copper in
chloride media––a critical review, Corros. Sci., 46 (2004) 109-135.
18. M. Georgiadou, R. Alkire, Modelling of copper etching in aerated chloride solutions, J.
Appl. Electrochem., 28 (1998) 127-134.
19. V.F. Lucey, Mechanism of Pitting Corrosion of Copper in Supply Waters, Br. Corros. J., 2 (1967) 175-185.
20. V.F. Lucey, Developments Leading to the Present Understanding of the Mechanism of Pitting Corrosion of Copper, Br. Corros. J., 7 (1972) 36-41.
21. M. Pourbaix, Atlas of Electrochemical Equilibria in Aqueous Solutions, 2nd ed., National Association of Corrosion Engineers, Houston, Texas, USA, 77084, 1974.
22. U. Bertocci, An EQMB examination of Cu surface oxides in borate buffer, Electrochim. Acta, 49 (2004) 1831-1841.
23. H. Cong, H.T. Michels, J.R. Scully, Passivity and Pit Stability Behavior of Copper as a
Function of Selected Water Chemistry Variables, J. Electrochem. Soc., 156 (2009) C16-C27. 555
24. H. Cong, J.R. Scully, Use of Coupled Multielectrode Arrays to Elucidate the pH Dependence of Copper Pitting in Potable Water, J. Electrochem. Soc., 157 (2010) C36-C46.
25. H. Cong, J.R. Scully, Effect of Chlorine Concentration on Natural Pitting of Copper as a 558 Function of Water Chemistry, J. Electrochem. Soc., 157 (2010) C200-C211.
26. H. Cong, J.R. Scully, Effects of Aluminum Solids on the under-Deposit Corrosion of Copper in Synthetic Potable Water: The Arguments for and against a Semi-Permeable Membrane, J. Electrochem. Soc., 160 (2013) C403-C413.
27. F. King, Corrosion of copper in alkaline chloride environments, in, Svensk Kärnbränslehantering AB, Stockholm, Sweden, 2002.
28. N. Ikemiya, T. Kubo, S. Hara, In situ AFM observations of oxide film formation on Cu (111) and Cu (100) surfaces under aqueous alkaline solutions, Surf. Sci., 323 (1995) 81-90.
29. J. Wu, X. Li, B. Yadian, H. Liu, S. Chun, B. Zhang, K. Zhou, C.L. Gan, Y. Huang, Nano- scale oxidation of copper in aqueous solution, Electrochem. Commun., 26 (2013) 21-24. 30. S. Härtinger, B. Pettinger, K. Doblhofer, Cathodic formation of a hydroxyde adsorbate on
copper (111) electrodes in alkaline electrolyte, J. Electroanal. Chem., 397 (1995) 335-338. 31. M. Osamu, Y. Sadaaki, S. Shoko, M. Satoru, N. Hisakazu, Electrochemical STM
Observation of Well-ordered Adsorbate on Cu (111) Electrode Surfaces in an Alkaline Electrolyte, Chem. Lett., 27 (1998) 947-948.
32. V. Maurice, H.H. Strehblow, P. Marcus, In situ STM study of the initial stages of oxidation of Cu(111) in aqueous solution, Surf. Sci., 458 (2000) 185-194.
33. C. Toparli, A. Sarfraz, A. Erbe, A new look at oxide formation at the copper/electrolyte interface by in situ spectroscopies, PCCP, 17 (2015) 31670-31679.
34. C. Engelbrekt, P. Malcho, J. Andersen, L. Zhang, K. Ståhl, B. Li, J. Hu, J. Zhang, Selective synthesis of clinoatacamite Cu2(OH)3Cl and tenorite CuO nanoparticles by pH control, J.
Nanopart. Res., 16 (2014) 2562.
35. ASTM G5-14, Standard Reference Test Method for Making Potentiodynamic Anodic Polarization Measurements, in, ASTM International, 2014.