Using Truck GPS Data for
Freight Performance Analysis
in the Twin Citi
es Metro Area
Chen-Fu Liao, Principal Investigator Department of Civil Engineering
University of Minnesota
March 2014
Research Project Final Report 2014-14
To request this document in an alternative format call 651-366-4718 or 1-800-657-3774 (Greater Minnesota) or email your request to [email protected]. Please request at least one week in advance.
Technical Report Documentation Page
1. Report No. 2. 3. Recipients Accession No.
MN/RC 2014-14
4. Title and Subtitle 5. Report Date
Using Truck GPS Data for Freight Performance Analysis in the Twin Cities Metro Area
March 2014 6.
7. Author(s) 8. Performing Organization Report No.
Chen-Fu Liao
9. Performing Organization Name and Address 10. Project/Task/Work Unit No. Department of Civil Engineering
University of Minnesota 500 Pillsbury Drive, SE Minneapolis, MN 55455
CTS Project #2013035 11. Contract (C) or Grant (G) No. (C) 99008 (WO) 47
12. Sponsoring Organization Name and Address 13. Type of Report and Period Covered Minnesota Department of Transportation
Research Services & Library
395 John Ireland Boulevard, MS 330 St. Paul, MN 55155
Final Report
14. Sponsoring Agency Code
15. Supplementary Notes
http://www.lrrb.org/PDF/201414.pdf 16. Abstract (Limit: 250 words)
Building on our previous efforts to study freight mobility and reliability, a GPS-based data analysis methodology was developed to study the freight performance of heavy commercial trucks along 38 key freight corridors in the Twin Cities metropolitan area (TCMA). One year of truck GPS data collected in 2012 was obtained from American Transportation Research Institute (ATRI) to study freight mobility and reliability. Several performance measures, such as truck mobility, delay, and reliability index, were computed and analyzed by route, roadway segment, and time of day. For data quality and reliability verification, average truck speed and hourly volume percentage computed from the truck GPS data were validated with weigh-in-motion (WIM) and automatic traffic recorders (ATR) data at selected locations. The GPS based freight analysis methodology offers potential opportunities for freight planners and managers to generate reliable measures in a timely manner. The resulting performance measures indicate that these measures derived from truck GPS data can be used to support the USDOT performance measure initiative and support regional surface freight planner in identifying freight bottlenecks, infrastructure improvement needs, and operational strategies to promote efficient freight movement. FHWA recently announced the National Performance Measurement Research Data Set (NPMRDS) to support its Freight Performance Measurement (FPM). The NPMRDS includes probe vehicle based travel time data in every 5-minute interval. This report also explored the feasibility of using one month of NPMRDS data in Minnesota to compute freight mobility and speed variations along the National Highway System (NHS) during AM and PM peak periods.
17. Document Analysis/Descriptors
Performance measurement, Trucking, Global Positioning System, Analysis, Mobility, Delays, Reliability
18. Availability Statement
No restrictions. Document available from: National Technical Information Services, Alexandria, VA 22312
19. Security Class (this report) 20. Security Class (this page) 21. No. of Pages 22. Price
Using Truck GPS Data for Freight Performance Analysis in
the Twin Cities Metro Area
Final Report
Prepared by: Chen-Fu Liao
Department of Civil Engineering University of Minnesota
March 2014
Published by:
Minnesota Department of Transportation Research Services & Library 395 John Ireland Boulevard, MS 330
St. Paul, Minnesota 55155
This report documents the results of research conducted by the authors and does not necessarily represent the views or policies of the Minnesota Department of Transportation or the University of Minnesota. This report does not contain a standard or specified technique.
The authors, the Minnesota Department of Transportation, and the University of Minnesota do not endorse products or manufacturers. Trade or manufacturers’ names appear herein solely because they are considered essential to this report.
A
CKNOWLEDGMENTSThis research project is sponsored by the Minnesota Department of Transportation (MnDOT). The author would like to acknowledge MnDOT staff and engineers for their invaluable support and providing traffic data. Many thanks to the American Transportation Research Institute (ATRI) for providing truck GPS data and technical support in making this study possible. The author also would like to thank members of the technical advisory panel (TAP) and the following individuals for their invaluable feedback and assistance in making this research possible.
John Tompkins, technical liaison (TL), MnDOT
Bruce Holdhusen, project coordinator (PC), MnDOT
Mark B Nelson, Matthew Pahs, Jesse Larson, Brad Utecht, Jason Junge, Shannon McGrath, and Molly McCartney from MnDOT
Steven Elmer and Jonathan Ehrlich from Metropolitan Council
Dan Murray, Jeff Short, and Katie Fender from ATRI
Stephen Zitzow at the Minnesota Traffic Observatory (MTO), University of Minnesota
Tara Sasank Sunkara and Dayakar Reddy Singana from the Department of Computer Science and Engineering, University of Minnesota
T
ABLE OFC
ONTENTS1. Introduction ... 1
1.1 Background ... 1
1.2 Research Objectives ... 2
1.3 Literature Review... 2
1.3.1 Surface Freight Performance Measures ... 2
1.3.2 Probe Vehicle Based Performance Measures ... 3
1.3.3 National Corridors Analysis & Speed Tool (N-CAST) ... 5
1.4 Data Sources ... 6
1.4.1 ATRI Truck GPS data ... 6
1.4.2 National Corridors Analysis & Speed Tool (N-CAST) ... 7
1.4.3 National Performance Management Research Data Set (NPMRDS) ... 8
1.4.4 MnDOT WIM Data... 8
1.4.5 Automatic Traffic Recorder (ATR) Data ... 8
1.4.6 Other Data Links ... 11
1.5 Report Organization ... 11
2. Data Processing Methodology ... 12
2.1 GPS Data Summary and Limitation ... 12
2.2 Key Freight Corridors ... 13
2.3 Data Processing Methodology ... 15
2.4 Data Analysis ... 17
2.4.1 GPS Data Proximity Analysis ... 17
2.4.2 Comparisons of Processed Probe Vehicle Results and WIM data ... 17
2.4.3 Spot vs. Space Mean Speed ... 18
2.5 Speed and Volume Comparisons ... 22
2.5.1 Probe Vehicle vs. WIM Speed Comparisons ... 22
2.5.2 Speed Comparison by Month and Hour... 24
2.5.3 Probe Vehicle vs. WIM Volume Percentage Comparisons ... 25
2.6 Automatic Traffic Recorder (ATR) Data ... 26
2.6.1 ATR Volume Processing and Analysis... 26
2.6.2 ATR Speed Estimation and Analysis ... 28
2.7 Loop Detector Data ... 30
2.7.1 Loop Detector Speed Analysis... 30
2.7.2 Loop Detector Volume Analysis ... 34
3. Performance Measures ... 37
3.1 Corridor Target Speed... 37
3.2 Freight Node & Freight Corridor ... 40
3.3 Truck Mobility ... 45
3.4 Truck Delay ... 47
3.5 Truck Travel Time Reliability ... 51
3.6 Truck Bottlenecks Identification ... 54
3.6.1 FHWA & Cambridge Systematics ... 54
3.6.3 Washington State ... 54
3.6.4 Our Approach ... 55
3.7 Truck Congestion Cost ... 64
4. National Performance Measurement Research Data Set ... 66
4.1 NPMRDS Data Format ... 66
4.2 NPMRDS Data Processing ... 67
4.3 Speed Analysis Example Using NPMRDS Data ... 71
5. Summary and Conclusions... 76
6. Future Research Opportunities ... 79
References ... 80
Appendix A: Freight Performance Measures Appendix B: Reliability Measures
Appendix C: Weigh-In-Motion (WIM) Data Appendix D: Data Analysis and Comparisons
Appendix E: Data Comparison of Automatic Traffic Recorder (ATR) Appendix F: Data Comparison of Loop Detector Data
L
IST OFF
IGURESFigure 1-1 Snapshot of Truck GPS Point Cloud (Dec. 2012)...7
Figure 2-1 Key Freight Corridors in Twin Cities Metro Area ...15
Figure 2-2 Data Processing Flowchart ...16
Figure 2-3 Example of GPS Data Point Cloud ...17
Figure 2-4(a) Spot vs. Space Mean Speed on Route I-94 at Mile Post 200 ...19
Figure 2-4(b) Spot vs. Space Mean Speed on Route I-94 at Mile Post 200 ...19
Figure 2-5(a) Spot Speed vs. Space Mean Speed on Route I-694 WB near State Highway 51 ...20
Figure 2-5(b) Spot Speed vs. Space Mean Speed on Route I-394 EB after Highway 100 ...21
Figure 2-5(c) Spot Speed vs. Space Mean Speed on Route I-494 EB at Highway 100………..21
Figure 2-6 Probe Vehicle Speed vs. WIM Speed at WIM#37 ...22
Figure 2-7 Probe Vehicle Median Speed vs. WIM Speed by Hour at WIM#37 ...23
Figure 2-8 Probe Vehicle Speed vs. WIM Speed by Hour at WIM#37 ...23
Figure 2-9 WIM37 Heavy Vehicle Mean Speed by Month and Hour ...24
Figure 2-10 Probe Vehicle Mean Speed by Month and Hour at WIM37 ...24
Figure 2-11 Probe Vehicles vs. WIM Volume Percentage by Hour at WIM#37 ...25
Figure 2-12 Comparison of Truck Volume Percentage by Hour (ATR Station #188) ...27
Figure 2-13 Weekday Hourly Truck GPS vs. ATR 191 Speed Comparisons ...29
Figure 2-14 Hourly Speed Variations by Lane at Loop Detector Station #1222 ...32
Figure 2-15 Truck GPS and Loop Detector Speed Comparison (I-394 at Highway 100) ...33
Figure 2-16 Truck GPS and Loop Detector Speed Comparison (I-494 at France) ...34
Figure 2-17 Hourly Volume Percentages by Lane at Loop Detector Station #1222 ...35
Figure 2-18 Hourly Volume Percentage Comparisons (Loop Detector Station 1222 vs. WIM 37) ...35
Figure 3-1 Threshold Speed in TCMA (Source: MnDOT RTMC) ...37
Figure 3-2 GIS Map of Truck Speed Less Than 45 MPH during AM Peak (5-10 AM) in 2012 ...38
Figure 3-3 GIS Map of Truck Speed Less Than 45 MPH during PM Peak (2-7 PM) in 2012 ...39
Figure 3-4 GIS Map of Truck Speed during AM Peak (5-10 AM) in 2012 ...39
Figure 3-5 GIS Map of Truck Speed during PM Peak (2-7 PM) in 2012 ...40
Figure 3-6(a) 2012 Heavy Commercial Annual Average Daily Traffic (HCAADT) in TCMA ...41
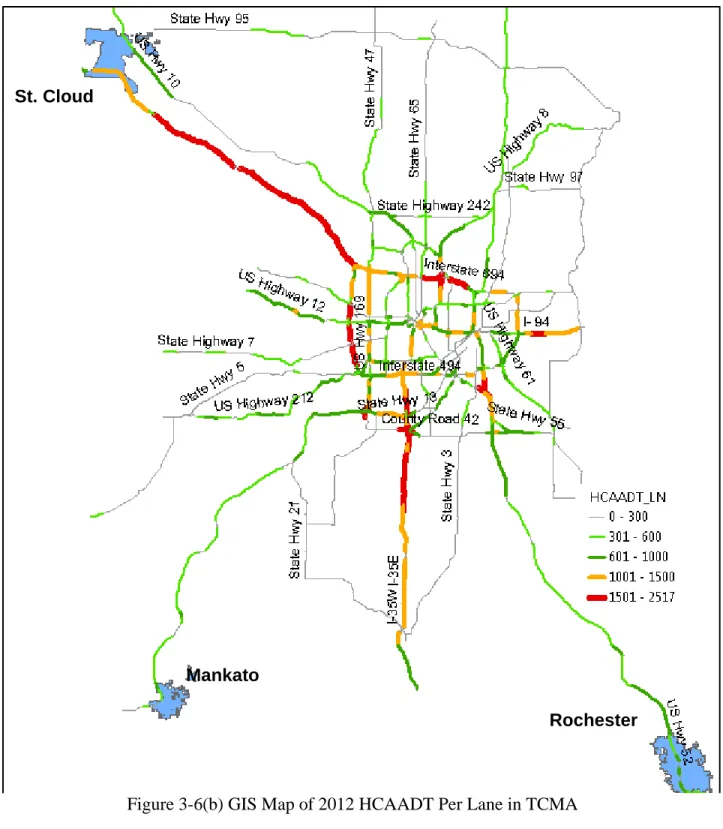
Figure 3-6(b) GIS Map of 2012 HCAADT Per Lane in TCMA ...43
Figure 3-7 GIS Map of 2012 GPS Truck Counts in 7-8 AM ...44
Figure 3-8 Number of AM Peak Hours with Average Speed Less than Threshold Speed ...46
Figure 3-9Number of PM Peak Hours with Average Speed Less than Threshold Speed ...47
Figure 3-10 Average Daily Truck Delay and Speed on I-494 in 2012 ...49
Figure 3-11Map of Truck Delays in AM Peak ...50
Figure 3-12 Map of Truck Delays in PM Peak ...51
Figure 3-13 Truck Reliability Index in AM Peak ...52
Figure 3-14Truck Reliability Index in PM Peak...53
Figure 3-15 Map of Truck Bottleneck (Highlighted) with Delay ≥ 3 Hours in AM Peak ...56
Figure 3-16 Map of Truck Bottleneck (Highlighted) with Delay ≥ 3 Hours in PM Peak ...58
Figure 3-17 Map of Truck Bottleneck (Highlighted) with Average Speed ≤ 45 MPH for Over 5 Hours in AM Peak ...60
Figure 3-18 Map of Truck Bottleneck (Highlighted) with Average Speed ≤ 45 MPH for Over 5
Hours in PM Peak ...62
Figure 3-19 Map of Truck Bottleneck (Highlighted) with Delay Over 10 Hours in Combined AM and PM Peak Period ...63
Figure 4-1 Join Travel Time File with NHS Shapefile ...67
Figure 4-2 Snapshot of NHS Roadway Data ...68
Figure 4-3 Snapshot of TMC Loop Up Table (LUT) ...69
Figure 4-4 Snapshot of TMC Monthly Static File ...69
Figure 4-5 TMC Segment Static Data in MN ...70
Figure 4-6 TMC Segment Static Data in Twin Cities 8-County Metro Area ...71
Figure 4-7 Average Truck Speed during AM Peak Period in Nov. 2013 ...72
Figure 4-8 Average Truck Speed in TCMA during AM Peak Period in Nov. 2013 ...73
Figure 4-9 Average Truck Speed during PM Peak Period in Nov. 2013 ...74
Figure 4-10 Average Truck Speed in TCMA during PM Peak Period in Nov. 2013 ...75 Figure D-1 ATRI Data Distribution by Vehicle Configuration ... D-1 Figure D-2 ATRI Data Distribution by Fleet Size ... D-1 Figure D-3 GPS Point Distribution by Route (Positive Direction)... D-2 Figure D-4 GPS Point Distribution by Route (Negative Direction) ... D-3 Figure D-5 Data Proximity by Route (Increasing Mile Marker Direction) ... D-4 Figure D-6 Data Proximity by Route (Decreasing Mile Marker Direction) ... D-5 Figure D-7 Spot Speed vs. Space Mean Speed on Route State Highway 36 at Mile Post 15 ... D-6 Figure D-8 Spot Speed vs. Space Mean Speed on Route U.S. Highway 52 at Mile Post 81 ... D-7 Figure D-9 Spot Speed vs. Space Mean Speed on Route U.S. Highway 61 at Mile Post 16 ... D-8 Figure D-10 Probe Vehicle Speed vs. WIM Speed at WIM#36 ... D-9 Figure D-11 Probe Vehicle Median Speed vs. WIM Speed by Hour at WIM#36 ... D-9 Figure D-12 Probe Vehicle Speed vs. WIM Speed by Hour at WIM#36 ... D-10 Figure D-13 Probe Vehicle Speed vs. WIM Speed at WIM#40 ... D-10 Figure D-14 Probe Vehicle Median Speed vs. WIM Speed by Hour at WIM#40 ... D-11 Figure D-15 Probe Vehicle Speed vs. WIM Speed by Hour at WIM#40 ... D-11 Figure D-16 Probe Vehicle Speed vs. WIM Speed at WIM#42 ... D-12 Figure D-17 Probe Vehicle Median Speed vs. WIM Speed by Hour at WIM#42 ... D-12 Figure D-18 Probe Vehicle Speed vs. WIM Speed by Hour at WIM#42 ... D-13 Figure D-19 WIM40 Heavy Vehicle Mean Speed by Month and Hour ... D-13 Figure D-20 Probe Vehicle Mean Speed by Month and Hour at WIM40 ... D-14 Figure D-21 Probe Vehicle Median Speed by Month and Hour at WIM40 ... D-14 Figure D-22 Probe Vehicle vs. WIM Volume % by Hour at WIM#36 ... D-15 Figure D-23 Probe Vehicle vs. WIM Volume % by Hour at WIM#40 ... D-15 Figure D-24 Probe Vehicle vs. WIM Volume % by Hour at WIM#42 ... D-16 Figure E-1 Comparison of Truck Volume Percentage by Hour (ATR Station #191) ... E-1 Figure E-2 Comparison of Truck Volume Percentage by Hour (ATR Station #200) ... E-1 Figure E-3 Comparison of Truck Volume Percentage by Hour (ATR Station #335) ... E-1 Figure E-4 Comparison of Truck Volume Percentage by Hour (ATR Station #341) ... E-2 Figure E-5 Comparison of Truck Volume Percentage by Hour (ATR Station #351) ... E-2
Figure E-6 Comparison of Truck Volume Percentage by Hour (ATR Station #352) ... E-2 Figure E-7 Comparison of Truck Volume Percentage by Hour (ATR Station #353) ... E-3 Figure E-8 Comparison of Truck Volume Percentage by Hour (ATR Station #365) ... E-3 Figure E-9 Comparison of Truck Volume Percentage by Hour (ATR Station #381) ... E-3 Figure E-10 Comparison of Truck Volume Percentage by Hour (ATR Station #382) ... E-4 Figure E-11 Comparison of Truck Volume Percentage by Hour (ATR Station #388) ... E-4 Figure E-12 Comparison of Truck Volume Percentage by Hour (ATR Station #400) ... E-4 Figure E-13 Comparison of Truck Volume Percentage by Hour (ATR Station #422) ... E-5 Figure E-14Weekday Hourly Truck GPS vs. ATR 200 Speed Comparisons ... E-5 Figure E-15 Weekday Hourly Truck GPS vs. ATR 335 Speed Comparisons ... E-6 Figure E-16 Weekday Hourly Truck GPS vs. ATR 341 Speed Comparisons ... E-6 Figure E-17 Weekday Hourly Truck GPS vs. ATR 351 Speed Comparisons ... E-6 Figure E-18 Weekday Hourly Truck GPS vs. ATR 352 Speed Comparisons ... E-7 Figure E-19 Weekday Hourly Truck GPS vs. ATR 353 Speed Comparisons ... E-7 Figure E-20 Weekday Hourly Truck GPS vs. ATR 365 Speed Comparisons ... E-8 Figure E-21 Weekday Hourly Truck GPS vs. ATR 381 Speed Comparisons ... E-8 Figure E-22 Weekday Hourly Truck GPS vs. ATR 382 Speed Comparisons ... E-9 Figure E-23Weekday Hourly Truck GPS vs. ATR 388 Speed Comparisons ... E-9 Figure F-1 Snapshot of MnDOT Data Plot Application ... F-1 Figure F-2 Hourly Volume Percentages by Lane at Loop Detector Station #1171 ... F-2 Figure F-3 Hourly Volume Percentages by Lane at Loop Detector Station #1172 ... F-2 Figure F-4 Hourly Volume Percentage Comparisons
(Loop Detector Station 1171 & 1172 vs. WIM 40) ... F-3 Figure F-5 Hourly Volume Percentages by Lane at Loop Detector Station #1232 ... F-3 Figure F-6 Hourly Volume Percentage Comparisons (Loop Detector Station 1232 vs. ATR200) ... F-4 Figure F-7 Hourly Volume Percentages by Lane at Loop Detector Station #1555 ... F-4 Figure F-8 Hourly Volume Percentage Comparisons (Loop Detector Station 1555 vs. ATR335) ... F-5 Figure F-9 Hourly Volume Percentages by Lane at Loop Detector Station #1418 ... F-5 Figure F-10 Hourly Volume Percentage Comparisons (Loop Detector Station 1418 vs. ATR341) . F-6 Figure F-11 Hourly Speed Comparisons (Loop Detector Station 1232 vs. ATR200)... F-6 Figure F-12 Hourly Speed Comparisons (Loop Detector Station 1555 vs. ATR335)... F-7 Figure F-13 Hourly Speed Comparisons (Loop Detector Station 1418 vs. ATR341)... F-7 Figure F-14 General Traffic Speed from Loop Detectors (Oct. 2013 7AM) ... F-8 Figure F-15 Truck GPS Speed (Oct. 2013 7AM) ... F-9 Figure F-16 Speed Difference: Truck GPS Speed – General Traffic Speed (Oct. 2013 7AM) ... F-10 Figure F-17 General Traffic Speed from Loop Detectors (Oct. 2013 4PM) ... F-11 Figure F-18 Truck GPS Speed (Oct. 2013 4PM) ... F-12 Figure F-19 Speed Difference: Truck GPS Speed – General Traffic Speed (Oct. 2013 4PM) ... F-13
L
IST OFT
ABLESTable 1-1 Sample Truck GPS Data ... 6
Table 1-2 ATR Volume by Hour of Day ... 9
Table 1-3 ATR Speed Data in Different Speed Bins by Hour of Day ... 10
Table 1-4 Vehicle Counts by Class and Hour of Day ... 10
Table 2-1 Summary of ATRI GPS Data ... 13
Table 2-2 ATRI Truck GPS Dataset ... 13
Table 2-3 List of Routes in TCMA ... 14
Table 2-4 Description of WIM stations ... 18
Table 2-5 List of ATR Stations in TCMA ... 26
Table 2-6 Hourly Truck Volume Correlation between GPS and ATR Data ... 28
Table 2-7 List of Sample ATR Data in Speed Bins ... 29
Table 2-8 List of Loop Detectors nearby WIM and ATR Stations... 30
Table 2-9 Sample Loop Detector Data ... 30
Table 2-10 Comparison of Different Traffic Data Sources ... 36
Table 3-1 Percent of Miles in TCMA below 45 MPH during AM/PM Peak in 2012 ... 38
Table 3-2(a) Percentage of Miles by Route with HCAADT Greater than 7500 ... 42
Table 3-3(a) Rank of GPS Truck Samples by Route in 2012 ... 45
Table 3-4 Sample Truck Speed and Volume Data for Delay Calculation ... 48
Table 3-5 List of Truck Bottleneck in AM Peak (Based on Delay) ... 56
Table 3-6 List of Truck Bottleneck in PM Peak (Based on Delay) ... 57
Table 3-7 List of Truck Bottleneck in AM Peak (Based on # of Hours below 45 MPH) ... 59
Table 3-8 List of truck bottleneck in PM Peak (Based on # of Hours below 45 MPH) ... 61
Table 3-9 List of truck bottleneck in AM and PM Peak Combined ... 63
Table 3-10 Daily Truck Congestion by Route ... 65
Table 4-1 Sample TMC Static Data ... 66
Table 4-2 Sample Travel Time Data ... 67 Table A-1 Suggested Freight Performance Measures ... A-1 Table F-1 Summary of Speed Differences from Truck GPS and Loop Detectors ... F-13
LIST OF ACRONYMS AND ABBREVIATIONS
AADT Annual Average Daily Traffic AADTT Annual Average Daily Truck Traffic
AASHTO American Association of State Highway and Transportation Officials AL Administration Liaison
ATA American Trucking Association ATR Automatic Traffic Recorder
ATRI American Transportation Research Institute BI Buffer Index
BTI Buffer Time Index
CMV Commercial Motor Vehicle CSAH County State-Aid Highway CTS Center for Transportation Studies
EB Eastbound
FHWA Federal Highway Administration FPM Freight Performance Measurement GIS Geographic Information System GPS Global Positioning System
HCAADT Heavy Commercial Annual Average Daily Traffic HCADT Heavy Commercial Average Daily Traffic
IRC Inter- Regional Corridor ID Identification
LUT Look Up Table
MAP Moving Ahead for Progress
MHCADT Monthly Heavy Commercial Average Daily Traffic MnDOT Minnesota Department of Transportation
MPH Mile Per Hour
MPO Metropolitan Planning Organization MTO Minnesota Traffic Observatory NB Northbound
N-CAST National Corridors Analysis & Speed Tool NCFRP National Cooperative Freight Research Program NCHRP National Cooperative Highway Research Program NHS National Highway System
NPMRDS National Performance Measurement Research Data Set OFCVO Office of Freight and Commercial Vehicle Operations PTI Planning Time Index
RI Reliability Index
RTMC Regional Traffic Management Center SB Southbound
SCOPM Standing Committee on Performance Management SQL Sequential Query Language
TAP Technical Advisory Panel TCMA Twin Cities Metropolitan Area TH Trunk Highway
TL Technical Liaison
TMC Traffic Management Center
TTI Travel Time Index or Texas Transportation Institute UCR Urban Congestion Report
UMN University of Minnesota UMR Urban Mobility Report
USDOT US Department of Transportation
WB Westbound
E
XECUTIVES
UMMARYAs outlined in the Moving Ahead for Progress in the 21st Century Act (MAP-21), the states are required to establish performance targets that reflect performance measures established by the U.S. Department of Transportation (USDOT). The USDOT has identified and recommended critical performance measures, methodologies and standards for data collection, potential issues related to deployment, and usability of performance measures in addressing issues at local, state, and federal levels.
Building on our previous efforts to analyze freight mobility and reliability, an analysis methodology using truck GPS data was developed to study the freight performance of heavy commercial trucks along 38 key freight corridors in the Twin Cities metropolitan area (TCMA). Twelve months of truck GPS data collected in 2012 were obtained from American Transportation Research Institute (ATRI) to compute truck mobility, reliability and delay and to identify bottlenecks.
Average truck traveling speed derived from the GPS data and truck volumes were compared with available benchmark data for data validation. Particularly in urban areas, satellite receptions may be limited and traffic congestion is more common. For data quality validation purposes, average truck speed and hourly volume percentage computed from the truck GPS data were compared with data from weigh-in-motion (WIM) sensors and automatic traffic recorders (ATR) at selected locations in the TCMA.
Several performance measures, such as truck mobility, delay, and reliability index, were identified. Statistical analyses were performed to derive performance measures by route, roadway segment (1-mile), and time of day. In addition to generating performance measures, the research team also identified key freight corridors by comparing the percentage of miles with heavy commercial annual average daily traffic (HCAADT) greater than 7,500 and HCAADT per lane greater than 1,500 in the TCMA. The HCAADT is theoretical estimate of the total number of heavy commercial vehicles using a specific segment of roadway (in both directions) on any given day of the year. This estimate represents the total number of heavy commercial vehicles per year divided by 365 and is developed by MnDOT using factors to adjust for season.
Truck bottlenecks were also identified and ranked based on hours of truck delay and number of hours with speed less than the target speeds (set by MnDOT) during the AM and PM peak periods. For example, Table ES-1 illustrates the top five truck bottlenecks in TCMA during PM peak based on truck delays. Table ES-2 displays the top five truck bottlenecks in TCMA during PM peak based on number of hours of truck average speed below the target speed. The top 5 locations in TCMA with significant truck delays during the combined AM and PM peak periods are listed in Table ES-3. Most of the bottleneck locations are nearby the interchange. The analysis results indicate that I-494 eastbound at between TH-169 and I-35W has the highest combined truck delay of 55.9 hours on a weekday. I-394 eastbound to downtown Minneapolis has the second highest truck delay of 26.2 hours in combined AM & PM peaks. The third highest truck delay (25.2 hours) occurs at I-494 southbound south of I-94 in Maple Grove during the peak periods.
Table ES-1 List of Top 5 Truck Bottleneck in PM Peak (Based on Delay)
Rank Location Dir.
PM Peak Delay (hours) / Mile PM Peak Reliability RI80 HCAADT Number of Lanes Length (miles) 1 I-35W at I-694 NB 14.08 1.94 - 3.75 7700 - 8500 3 3.30 2 I-35W at I-94 SB 12.94 5.00 3250 - 8300 3 1.01
3 I-494 between I-35W & 169 EB 11.31 2.05 - 4.09 6900 -
9100 2 4.88
4 I-394 between TH 100 & I-94 EB 7.14 2.59 - 3.75 400 3 2.61 5 I-694 between I-35E & I-35W WB 6.85 2.37 - 3.04 6700 -
7800 2 3.02
Table ES-2 Top 5 List of truck bottleneck in PM Peak (Based on # of Hours below 45 MPH)
Rank Location Dir.
PM Peak Delay (hours) / Mile PM Peak Reliability RI80 HCAADT # of Lanes Length (miles) PM Peak Delay (hours) 1 I-494 between I-35W &
169 EB 14.45 2.05 - 4.50 6800 - 9100 3 3.14 45.34
2 I-35W at I-694 NB 17.79 3 - 3.75 7200 - 8500 3 2.05 36.47 3 I-394 between downtown
and TH 100 EB 4.96 1.93 - 3.75 2100 - 4200 3 4.78 23.69 4 I-94 between Lowry tunnel
and TH 280 WB 4.51 2.35 - 3.25 4000 - 6300 3 5.02 22.63 5 I-35E at I-94 SB 5.32 1.50 - 22.5 6200 - 7900 3 2.4 12.76
Table ES-3 Top 5 List of truck bottleneck in Combined AM and PM Peak
Rank Location Dir.
AM Peak Delay (hours) PM Peak Delay (hours) AM & PM Peak Delay (hours) 1 I-494 between I-35W & 169 EB 0.7 55.2 55.9
2 I-394 at I-94 EB 7.6 18.6 26.2
3 I-494 S of I-94 (Maple Grove) SB 25.2 0.0 25.2
4 I-694 at I-35W EB 4.0 15.3 19.3
5 I-694 at I-94 WB 13.9 5.0 18.9
In addition to the performance measures, the cost of traffic mobility deficiencies as a means of expressing the financial impact of congestion can be estimated. These congestion cost measures can
have utility to both transportation decision-makers and system users if they accurately reflect the tangible costs of transportation use on congested facilities.
The annual Urban Mobility Report (UMR) produced by Texas Transportation Institute (TTI)
measures the costs of congestion at both the national and the local levels. The 2012 report estimated that the overall cost of congestion in the United States was $121 billion in 2011 based on wasted fuel and lost productivity. In Minneapolis-St. Paul, Minnesota area, annual truck congestion cost was $232 million and the total congestion cost was $1.26 billion in 2011. According to the 2012 UMR, the cost of truck congestion used was $88 per hour.
In addition, the ATRI has been conducted an analysis to assess the operational costs of truck delays since 2008. The recent update of the ATRI study, An Analysis of the Operational Cots of Trucking:
2013 Update, reported that the total marginal costs for the industry across all sectors, fleet sizes and
regions were $1.63 per mile and $65.29 per hour in 2012.
Of the 38 corridors studied in this project, several of them are county roads or state highways with traffic signals. Total truck congestion cost in the TCMA was about 0.8 million per weekday using the hourly operational cost from ATRI. The corresponding annual congestion cost was about $212 million (assuming no delays on weekends). When using the TTI’s congestion cost rate, the total truck congestion cost in the TCMA was about 1.1 million per weekday with corresponding annual congestion cost around $286 million (assuming no delays on weekends). Using the simple cost calculation methodology, daily or annual truck congestion cost measures can be derived by applying industry operating cost rate to truck delays derived from empirical truck speed/time data at a corridor level or in a region.
In July 2013, the FHWA announced the National Performance Measurement Research Data Set (NPMRDS) to support its Freight Performance Measurement (FPM) and Urban Congestion Report (UCR) programs. The NPMRDS includes probe vehicle based travel time data (for both passenger and freight vehicles) in every five-minute interval for all National Highway System (NHS) facilities. The NPMRDS will support transportation agencies’ needs by obtaining a comprehensive and
reliable set of data that can be broadly deployed for use in measuring, managing, and improving the transportation system in the United States. The research team also explored the feasibility of using one month (November 2013) of NPMRDS data in Minnesota to compute freight mobility and speed variations along the NHS during the AM and PM peak periods.
Performance measures derived from GPS data offer promising opportunities for freight planners and managers to generate reliable measures in a timely manner. The findings from this research indicate that these measures derived from the truck GPS data can be used in supporting the USDOT
performance measure initiative and truck/freight modeling in the TCMA. These measures can provide truck specific information to support regional surface freight planner in identifying freight bottlenecks and infrastructure improvement needs and in developing operational strategies to promote efficient freight movement for the industry.
1
1.
I
NTRODUCTIONThe Moving Ahead for Progress in the 21st Century Act (MAP-21) was signed into law by President Obama on July 6, 2012. As outlined in the MAP-21, the States are required to establish performance targets that reflect the performance measures established by the U.S. Department of Transportation (USDOT). Improving efficiency of freight movement is identified as one of the key national goals for performance management. The objective of freight performance
management is to improve freight networks, strengthen the ability of rural communities to access national and international trade markets, and support regional and national economic
development (FHWA, 2012).
This project extended our previous efforts to generate and analyze freight performance measures along 38 key freight corridors in the Twin Cities metro area (TCMA) and four major freight corridors that connect the Twin Cities to three regional freight centers (St. Cloud, Mankato, and Rochester) outside the TCMA (Liao, 2014). Results from the freight performance analysis in the TCMA will lead to supporting improvement in freight management and planning, complement the existing freight/truck models, and guide regional or statewide transportation decision making on infrastructure development and investment.
1.1 Background
In 2005, the Minnesota Department of Transportation (MnDOT) adopted its statewide freight plan (MnDOT, 2005). This multi-modal plan identifies significant freight system trends, needs and issues. The freight plan provides a framework that includes recommended freight policies, strategies and performance measures to guide decision-making on future investments.
In 2009, the author conducted a surface freight performance study along the I-94/90 between the Twin Cities and Chicago. The interstate 94/90 corridor carries significant amounts of freight from Chicago to Minnesota for consumption and distribution throughout the Upper Midwest. Interstate 94/90 also carries Minnesota-produced freight destined for Chicago, as well as national and international markets. Consolidated air cargo from Minnesota moves on the highway to Chicago for access to dedicated international air freighter service. Major regional distribution centers along the corridor in Wisconsin also drive truck traffic in both directions.
According to a report from the FHWA, the volume of heavy commercial vehicles (vehicles with at least two axles and at least six tires) traversing I-94/90 continues to increase. The annual average daily truck traffic (AADTT) of heavy commercial vehicles along the I-94 segment between the Twin Cities and Chicago reached nearly 10,000 trucks per day in 1998. By 2020, the forecasted AADTT will increase to almost 20,000 trucks per day.
The author utilized the truck GPS data (May 2008 – April 2009) obtained from ATRI to study the freight activities along I-94/90. General traffic data along the corridor were also acquired from MN, WI, and IL DOTs for data validation. Freight performance was evaluated and analyzed to compare truck travel time with respect to duration, reliability, and seasonal
variations. These types of analysis results can timely support freight transportation planning and decision-making. Potential applications of the performance measurement analyses were
2
identified in the report of the I-94/90 freight study, such as (1) measuring truck travel time reliability and impact of congestion on cost of freight, (2) identifying truck stop/parking facility needs, and (3) studying the impact of traffic volume with respect to speed gap difference between cars and trucks.
1.2 Research Objectives
The objectives of this study are to integrate private and public freight data sources to generate freight mobility and reliability measures, and identify significant freight node and delays in the TCMA. The outcome will allow freight agency to: (1) better identify system impediments such as traffic congestion or truck bottlenecks; (2) investigate truck volume contributing to traffic congestion and delay; and (3) use the derived measure as a guide to support decision-making on freight related infrastructure investment, freight forecasting and planning.
1.3 Literature Review
The American Association of State Highway and Transportation Officials (AASHTO) established a Standing Committee on Performance Management (SCOPM) to support performance-based management and outcome-driven environment by providing necessary expertise and resources to DOTs and other stakeholders. The NCHRP 20-24(37)G report (2011) has identified and made recommendations for critical performance measures, methodologies and standards for data collection, potential issues related to deployment, and usability of performance measures in addressing issues at local, state and federal levels. However, there is still ongoing debate over concerns and issues with the proposed measures, such as selection of reliability measure, data consistency, availability and adequacy, and federal vs. state role and
responsibilities.
NCHRP (2003) synthesis 311 studied highway segments and system performance measures that included a survey of state DOTs and MPOs. The report indicated the need for a national set of core performance measures that consider data quality and collection, system coverage, and the aggregation of results. Key findings from the report include:
• A variety of different definitions of reliability measures are used by different states and MPOs.
• Need to provide a complete explanation of the measure and the data required to make the calculation.
• No standard way to evaluate and collect information in an operational setting and thus making comparison of operational scenarios difficult.
• Need to develop an effective way to present performance measure results.
• Relatively little work on forecasting performance measures and assessing their sensitivity to policy and changes in travel behavior.
1.3.1 Surface Freight Performance Measures
In the U.S., the trucking industry represents the largest portion of domestic freight movement. According to the U.S. Freight Transportation Forecast to 2021 published by the American Trucking Association (ATA) in 2010, the trucking industry shares about 68% of total tonnage and trucks move more than 80% of freight revenue. Safe, efficient, and reliable trucking services
3
are essential, not only to provide door-to-door freight transportation, but also to ensure the effective operation of other freight modes and facilities.
Trucks usually occupy more than twice of the space of passenger vehicles on the roadway. Truck delays from traffic congestion or adverse weather conditions can have significant impact on truck travel time reliability. Federal Highway Administration (FHWA) has developed national congestion monitoring program that uses archived traffic detector data for measuring traffic congestion and travel time reliability (Pu, 2011; Turner et al., 2004). NCHRP Synthesis Report 384 (Kuzmyak, 2008) identified the challenges that many metropolitan planning organizations (MPOs) are facing in forecasting freight activities and modeling freight movements. NCFRP report #10 (2011) emphasized the importance of freight performance measures to support investment, operations, and policy decisions for both public and private stakeholders.
Many MPOs model heavy trucks as an alternative for modeling freight activity because trucks account for more than 80% of freight movement in most metropolitan areas. FHWA and American Transportation Research Institute (ATRI) released the findings on level of truck congestion at 250 freight significant highway locations in 2011. Five highway interchanges located in the Twin Cities metro area (TCMA) were identified in the study (ATRI, 2011). Schofield and Harrison (2007) reported the status of freight performance measures used in DOTs nationally and suggested a set of relatively broad performance measures including mobility, reliability, economic, safety/environment, and infrastructure for emerging users (See Appendix A for more details). Varmar (2008) compiled, organized, and analyzed freight data by mode, performance measure and indicator categories. The report suggested that there are needs to, (1) determine what performance measures or indicators are relevant and most important for freight planning support, and (2) identify freight significant strategic corridors and nodes.
The Minnesota Department of Transportation (MnDOT), Office of Freight and Commercial Vehicle Operations (OFCVO) has identified and included travel time by mode as one of the four performance indicators in the statewide freight plan (MnDOT, 2005). Currently, the MnDOT has also deployed Automatic Traffic Recorders (ATR) and Weigh-In-Motion (WIM) systems
statewide for measuring truck weight and classifications with varying axle configurations at highway speeds (MnDOT traffic data,http://www.dot.state.mn.us/traffic/data/index.html). Existing ATR and WIM sensors collect truck volume and speed information at selected locations statewide. However, they do provide truck travel time information.
1.3.2 Probe Vehicle Based Performance Measures
With the prevalence of GPS receivers on vehicles and portable navigation devices, probe vehicle based data collection has been increasingly attractive to transportation community. The GPS based vehicle location data has been used to estimate traffic states and derive travel time information for traffic monitoring (Lund and Pack, 2010; Guo et al., 2008; Smith, 2006;
Nanthawichit et al., 2003). Probe vehicle data, when fused with loop detector data and other data sources, can provide more complete and continuous coverage of traffic monitoring. Turner et al. (2011) outlined the primary data requirements for congestion-related performance measures and introduced core data elements and various metadata to ensure data consistency among data
4
providers. They also examined legal and institutional issues related to privacy and Freedom of Information (FOIA) with regard to implementation.
Travel time reliability is one of the key measures of freight performance along interstates or interregional corridors in the nation (Lomax et al., 2003; TTI, 2006). Pu (2011) examined several reliability measures and recommended a median-based buffer index or a failure rate estimate is more appropriate to handle heavily skewed travel time distributions. A list of reliability measures is included in Appendix B.
Majority of commercial vehicles are equipped with on-board Automatic Vehicle Location (AVL) systems that collect truck locations at a fixed polling rate. The continuous trajectory information presents an excellent data source for monitoring travel time and reliability. However, GPS-based truck trip data usually are not available and are more difficult to collect due to the proprietary nature of the data. Commercially available travel time information (for example, from INRIX) provides some coverage using aggregated general traffic speed data from loop detectors and other probe vehicle based data sources. However, heavy commercial vehicles are considerably underrepresented in this type of data source.
Since 2002, FHWA has established a partnership with the American Transportation Research Institute (ATRI) and the trucking industry to measure average truck travel speed on major freight-significant corridors using more than 400,000 commercial trucks in North America (Jones et al., 2005). A spatial data processing methodology was evaluated, refined, and assisted by Liao (2008) to improve the effectiveness of generating freight performance measures (FPM). Analyzing truck speed, volume and travel time by location can also help identify network impediments and variations of seasonal flow changes (Liao, 2009). Derived vehicle speed and travel time from the GPS and/or terrestrial wireless systems used by the trucking industry provide potential opportunities to support freight planning and operation on the surface transportation system.
McCormack and Hallenbeck (2006) used 25 portable GPS data collection units with 1-second polling rate to gather truck positioning data for measuring freight movements along freight significant corridors in Washington State. The study concluded that GPS data can be collected cost effectively and can provide an indication of roadway performance. Based on processed truck speed data, a route model including analyses of truck travel time, delay and reliability can be developed to better understand current freight network performance, freight origin to destination flows, and to study possible solutions to future freight demand growth (Short & Jones, 2008). Initial phase of the FHWA FPM initiative is to measure average travel rates on five freight-significant corridors (Jones et al., 2005). ATRI analyzed the severity of 30 key freight bottlenecks in the U.S. interstate system (Short et al., 2009). Freight bottlenecks occurred at highway interchanges were analyzed using a freight congestion index. Possible causes for the bottlenecks may include roadway geometry (e.g., grade, curvature, and sight distance), capacity (number of lanes), toll booths, speed limit, weather, truck volume vs. general traffic volume, and available lane of travel for trucks.
5
The MnDOT completed a study on truck parking analysis. The goal was to develop the information necessary to support decisions regarding future approaches to the truck parking issues in Minnesota (Maze et al., 2010). Short and Murray (2008) demonstrated the capability of utilizing FPM data for truck parking analysis. Another application is to utilize the FPM data to evaluate the travel time and delay at border crossing. FHWA conducted a study to address the need to reduce the hours of delay for commercial motor vehicles passing through ports-of-entry (FHWA, 2002). However, manually truck data collection at border crossing plaza is labor intensive and expensive.
Recently, FHWA is leading the effort to asses and validate the appropriateness of using GPS data from commercial vehicles to derive mobility and reliability performance measures and to support congestion monitoring on the highway system. Four key factors, including average daily traffic (ADT) per lane, percent of heavy vehicle, grade, and congestion level, were investigated. The preliminary findings indicated that (1) estimates of speed from FPM data are sufficiently accurate for performance measurement on most roadways in the United States, (2) FPM speed estimates show a consistent negative bias due to differences in operating characteristics of trucks and autos, and (3) grade and congestion have the greatest effect on FPM data accuracy among the four key factors evaluated (FHWA, 2012).
1.3.3 National Corridors Analysis & Speed Tool (N-CAST)
ATRI in coordination with the FHWA previously announced in October 2012 a beta release of Freight Performance Measures (FPM) tool that expands on the scope and functionality of the original FHWA-sponsored “FPMWeb” application (www.freightperformance.org/). The
National Corridors Analysis & Speed Tool (N-CAST, www.atri-online.org/n-cast) provides key roadway performance and truck mobility information for the U.S. Interstate Highway System. The N-CAST database includes average speed and share of total position reads of each one-mile segment in AM peak (6-10AM), mid-day (10AM-3PM), PM peak (3PM-7PM), and off peak (7PM-6AM) periods. The N-CAST tool has the potential to be integrated with existing truck data sources to generate critical performance measures (such as delay and reliability) to provide technical guidance to stakeholders in the freight industry.
For example, the vehicle-hours of delay on Interstate and NHS corridor can be computed as,
𝐴𝑛𝑛𝑢𝑎𝑙𝐷𝑒𝑙𝑎𝑦= ∑ ∑ ( 𝑆𝑒𝑔𝑚𝑒𝑛𝑡𝑇𝑟𝑎𝑣𝑒𝑙𝑆𝑝𝑒𝑒𝑑𝐿𝑒𝑛𝑔𝑡ℎ
(Eq. 1-1) − 𝑆𝑒𝑔𝑚𝑒𝑛𝑡𝑇ℎ𝑟𝑒𝑠ℎ𝑜𝑙𝑑𝐿𝑒𝑛𝑔𝑡ℎ𝑆𝑝𝑒𝑒𝑑 ) ×𝐻𝐶𝐴𝐴𝐷𝑇
𝐴𝑙𝑙𝑆𝑒𝑔𝑚𝑒𝑛𝑡𝑠 𝑑𝑎𝑦
The Reliability Index (RI) for 80th percentile travel time can be defined as, 𝑅𝐼80 𝑇𝑟𝑎𝑣𝑒𝑙𝑇𝑖𝑚𝑒𝑎𝑡𝐴𝑔𝑒𝑛𝑐𝑦−𝑆𝑝𝑒𝑐𝑖𝑓𝑖𝑒𝑑𝑇ℎ𝑟𝑒𝑠ℎ𝑜𝑙𝑑𝑆𝑝𝑒𝑒𝑑
(Eq. 1-2)
6
1.4 Data Sources
Traffic data obtained from FHWA, MnDOT, and American Transportation Research Institute (ATRI) for this study.
1.4.1 ATRI Truck GPS data
Since 2002, the ATRI has partnered with FHWA and the trucking industry to continuously collect GPS data on key national corridors, using nearly 500,000 commercial trucks in North America. This massive amount of truck GPS data can provide public agencies at both the federal and regional level with tools that can increase understanding of freight activity, identify
impediments along the freight network, and provide for near-real-time operations decision-making.
Aside from its official use by the U.S. DOT, ATRI's data has now been used by more than a dozen MPOs and 9 state DOTs to conduct truck- and freight-related analyses. Other "providers" of traffic data who claim to incorporate "commercial vehicles" primarily use taxis and limos to meet this definition. Those same providers do have some large trucks, but their total truck populations do not exceed 35,000 for the entire U.S. According to ATRI, "no other traffic provider in the U.S. has more than 10% of the large truck units that ATRI has". The ATRI data also includes descriptive data for their truck units at a high-level. Existing research has
concluded that there are no good surrogate data for large trucks. That is, it's inadequate to use cars or taxis as a surrogate for large truck analyses.
The University of Minnesota (UMN) has established a data sharing agreement with ATRI. The data attributes to be reported for each record will include a unique vehicle number, latitude, longitude, and date/time. No two trucks will use the same identifier. Twelve months (January 2012 to December 2012) of truck GPS data in the Twin Cities metro area (TCMA) were obtained. A sample of GPS point cloud data is displayed in Figure 1-1. Example of truck GPS data is listed in Table 1-1.
Table 1-1 Sample Truck GPS Data
Truck ID XXXXXXXXX
Date & Time String 2012-12-31 18:00:33 (UTC Time Zone)
Speed 55
Heading W
Latitude 44.9639807 Longitude -92.6853899
7
Figure 1-1 Snapshot of Truck GPS Point Cloud (Dec. 2012)
1.4.2 National Corridors Analysis & Speed Tool (N-CAST)
ATRI, in coordination with the FHWA, announced a beta release of Freight Performance Measures (FPM) tool that expands on the scope and functionality of the original FHWA-sponsored “FPMWeb” application. The National Corridors Analysis & Speed Tool (N-CAST) provides key roadway performance and truck mobility information for the U.S. Interstate
Highway System. The N-CAST database includes average speed and share of total position reads of each one-mile segment in AM peak (6-10AM), mid-day (10AM-3PM), PM peak (3PM-7PM), and off peak (7PM-6AM) periods. The N-CAST tool has the potential to be integrated with existing truck data sources to generate critical performance measures (such as delay and reliability) to provide technical guidance to stakeholders in the freight industry.
8
1.4.3 National Performance Management Research Data Set (NPMRDS)
In July 2013, FHWA has announced a National Performance Management Research Data Set (NPMRDS) to support its FPM and Urban Congestion Report (UCR) programs. The NPMRDS includes probe vehicle based travel time data (for both passenger and freight vehicles) for all National Highway System (NHS) facilities. The NPMRDS will support transportation agencies needs by obtaining a comprehensive and reliable set of data that can be broadly deployed for use in measuring, managing and improving the US transportation system.
1.4.4 MnDOT WIM Data
The WIM data contains individual vehicle data such as number of axle, speed, vehicle class, and weight. Speed data from WIM sensors is an ideal benchmark data source to validate the speed derived from probe vehicle GPS data. There are 4 WIM stations, listed as follows, in the 8-county TCMA. The WIM data was used for both truck speed and volume comparisons at each location. Detailed descriptions of the MnDOT WIM data are included in Appendix C.
• WIM #36 in Lake Elmo (State Highway 36)
• WIM #37 in Albertville/Otsego (Interstate Highway 94)
• WIM #40 in West St. Paul (US Highway 52)
• WIM #42 in Cottage Grove (US Highway 10/61) 1.4.5 Automatic Traffic Recorder (ATR) Data
Continuous traffic counting devices (WIMs and ATRs) are installed in the TCMA (TCMA Map & Interactive Mapping Application). In the 7-county metro area, there are 18 ATR’s that collect vehicle classification (11 of which are on trunk highways) and 4 WIM’s (3 of which are on trunk highways). The WIM/ATR program is currently progressing towards the goal of converting every ATR in the state to collect vehicle classification.
Three different types of ATR devices were deployed by MnDOT in TCMA to collect traffic volume, speed, and/or classification information. Limitations of different ATR devices are summarized as follow.
• ATR volume only recorder – Collect all traffic counts. This data cannot be used for truck volume comparison.
• ATR volume/speed recorder – No vehicle classification information. This data cannot be used for truck speed comparison.
• ATR volume/speed/class - The Vehicle Classification counts can provide volumes for heavy commercial vehicles.
The HCAADT is theoretical estimate of the total number of heavy commercial vehicles using a specific segment of roadway (in both directions) on any given day of the year. This
estimate represents the total number of heavy commercial vehicles per year divided by 365 and is developed by MnDOT using factors to adjust for season. The Heavy Commercial Average Daily Traffic (HCADT) a 24-hour heavy commercial traffic volume that should be qualified by stating a time period (e.g., MHCADT – monthly average daily heavy
9 Sample ATR data are listed as follows:
Table 1-2 ATR Volume by Hour of Day Date Oct. 30, 2012 Hour EB WB 1 1 5 2 2 1 3 0 1 4 1 3 5 4 1 6 21 5 7 42 16 8 48 31 9 45 26 10 38 19 11 30 25 12 25 29 13 22 27 14 34 35 15 29 40 16 46 50 17 47 50 18 53 51 19 29 43 20 20 35 21 8 22 22 9 25 23 3 13 24 9 8 TOTAL 566 561
10
Table 1-3 ATR Speed Data in Different Speed Bins by Hour of Day
HOUR 40 MPH 45 MPH 50 MPH 55 MPH 60 MPH 65 MPH 70 MPH 75 MPH 80 MPH 85 MPH 100 MPH 110 MPH >110 MPH 07:00 6 0 0 0 0 0 0 1 0 0 2 21 18 08:00 6 0 1 0 0 0 0 0 0 2 1 18 18 09:00 3 1 1 0 1 0 0 0 0 4 2 16 10 10:00 3 0 0 0 1 1 0 0 0 1 3 7 16 11:00 2 0 0 0 0 0 0 0 0 0 2 8 13 12:00 1 1 0 0 0 0 0 0 1 0 2 10 7 13:00 4 1 0 0 0 0 0 0 0 1 2 4 22 14:00 4 2 0 0 0 0 0 0 0 0 3 9 12 15:00 5 2 0 0 3 0 0 0 0 1 4 17 14 16:00 6 0 1 0 1 0 0 0 0 0 3 14 23 17:00 5 2 0 0 0 0 0 0 0 0 1 14 31 18:00 3 0 0 1 0 0 0 0 0 2 1 9 13
Table 1-4 Vehicle Counts by Class and Hour of Day
Time Lane # Class 1 Class 2 Class 3 Class 4 Class 5 Class 6 Class 7 Class 8 Class 9 Class 10 Class 11 Class 12 Class 13 Class 14 8:00 1 0 37 8 0 0 0 0 0 0 0 0 0 0 0 8:00 2 0 15 8 0 0 0 0 3 0 0 0 0 0 0 9:00 1 0 24 9 0 1 0 0 4 0 0 0 0 0 0 9:00 2 0 11 7 0 0 0 0 1 0 0 0 0 0 0 10:00 1 0 13 15 0 0 0 0 1 0 1 0 0 0 0 10:00 2 0 14 6 0 2 0 0 3 0 0 0 0 0 0 11:00 1 0 19 4 0 0 0 0 2 0 0 0 0 0 0 11:00 2 0 24 5 0 0 0 0 0 0 0 0 0 0 0 12:00 1 0 14 7 0 1 0 0 0 0 0 0 0 0 0 12:00 2 0 13 8 1 0 0 0 5 0 0 0 0 0 0 13:00 1 0 25 9 0 0 0 0 0 0 0 0 0 0 0 13:00 2 0 22 13 0 0 0 0 0 0 0 0 0 0 0 14:00 1 0 21 4 0 2 0 0 0 2 0 0 0 0 0 14:00 2 0 29 7 0 4 0 0 0 0 0 0 0 0 0 15:00 1 0 26 15 0 3 0 0 1 0 1 0 0 0 0 15:00 2 0 34 15 0 0 0 0 1 0 0 0 0 0 0 16:00 1 0 31 14 0 1 0 0 1 0 0 0 0 0 0 16:00 2 0 33 13 0 1 0 0 3 0 0 0 0 0 0 17:00 1 0 33 17 0 2 0 0 1 0 0 0 0 0 0 17:00 2 0 37 14 0 0 0 0 0 0 0 0 0 0 0 18:00 1 0 22 6 0 1 0 0 0 0 0 0 0 0 0 18:00 2 0 34 9 0 0 0 0 0 0 0 0 0 0 0
11 1.4.6 Other Data Links
Additional web links of other data are listed as follows.
• MnDOT Online Mapping Application, http://www.dot.state.mn.us/traffic/data/tma.html
• Metro trunk highway HCAADT map,
http://www.dot.state.mn.us/traffic/data/maps/th_adt_overview/2011_HCAADT_Metro_
• Greater MN trunk highway HCAADT map,
http://www.dot.state.mn.us/traffic/data/maps/th_adt_overview/2011_HCAADT_Gr8M
• MN Road data ftp site, ftp://ftp2.dot.state.mn.us/pub/outbound/TDA/WIM/WIM_Sites/
• Web link for the WIM Data Analyst’s Manual,
http://www.fhwa.dot.gov/pavement/wim/pubs/if10018/if10018.pdf • Web link to the monthly WIM reports,
http://www.dot.state.mn.us/traffic/data/html/wim_reports.html
Map.pdf N_Map.pdf
1.5 Report Organization
The rest of this report is organized as follows. Data summary and processing mythology are discussed in Section 2. Performance measures and analysis results are included in Section 3. Brief discussion of the National Performance Measurement Research Data Set (NPMRDS) and a data analysis example using the NPMRDS data in Minnesota are presented in Section 4. Finally, conclusion and summary are included in Section 5.
12
2.
D
ATAP
ROCESSINGM
ETHODOLOGYA data analysis methodology was developed to process raw truck GPS data. The processed results were used to derive performance measures to better understand the mobility and reliability of trucks traveling along the key freight corridors in the Twin Cities metro area (TCMA). First, truck GPS raw data received from American Transportation Research Institute (ATRI) is summarized in the following section. Second, a list of studied corridors in TCMA, the data processing methodology and analysis results are presented. Processed probe vehicle speed and volume percentage by hour are compared to the data collected from a weigh-in-motion (WIM) station. Lastly, freight performance measures, such as truck delay, cost of delay, and travel time reliability are derived and discussed.
2.1 GPS Data Summary and Limitation
ATRI’s database of GPS traces of trucks includes nearly 4 billion truck positions annually in North America. The truck GPS traces provide empirical evidence of where and when real truck activity occurs. ATRI acquires this information through several private sector data sharing partnerships and compiles it as part of the freight performance measures (FPM) initiative, an effort sponsored in part by the Federal Highway Administration (FHWA, 2002). The primary source of these data is onboard communications equipment installed on commercial trucks (e.g. tractor-trailer combinations or FHWA vehicle class 9 or above) from large trucking firms and independent truckers. The ATRI’s GPS data represents a good sample of truck flows, but it does not represent all truck flows. It does not separate intra-urban commercial motor vehicles (CMV) from inter-regional freight movements. More information about ATRI’s GPS data distribution by vehicle configuration and fleet size is included in Appendix D.1.
As part of the data sharing agreement between the UMN and ATRI, the research team received three different sets of truck GPS data as summarized and listed in Table 2-1. Dataset A and C contain probe vehicle spot speed and latitude-longitude location information. Dataset B does not include vehicle spot speed information. Dataset A has a positioning accuracy less than 3 meters. At 95% probability, the GPS positioning accuracy of dataset B and C is about 150 and 58 meters, respectively. Corresponding tolerance is used to merge raw GPS point to a nearest roadway. Due to data privacy concerns, the vehicle ID is masked or encrypted. In addition, the vehicle ID in dataset B rotates every 15 days and the vehicle ID in dataset C changes every 24 hours. The estimated GPS pinging rate for dataset A, B and C are about 8, 18 and 1 minute with standard deviations of 15, 26, and 5 minutes, respectively. A list of ATRI truck GPS data fields for each dataset is included in Table 2-2.
There are no Automatic Traffic Recorders (ATR) that collect vehicle classification counts located on the metropolitan freeway system within the 494/694 ring, and only 1 ATR on the ring (I-694 in Oakdale) which would be heavily influenced by through truck trips as that is the designated through route to avoid travelling through the downtowns. In addition, 1 Weigh-in-Motion (WIM) counter is on the freeway US-52 within the ring and would provide vehicle classification data. There are also 2 ATRs on County Highways within the ring that are also vehicle classification capable; however, truck movements on these highways could be very different in composition and purpose than those on the freeway system. Data for this study
13
depended predominantly on ATR freeway counts taken outside the ring, but made inferences about truck movements on freeways inside the ring.
2.2 Key Freight Corridors
Thirty eight (38) key freight corridors in the Twin Cities metro area (TCMA), as illustrated in Figure 2-1, were selected for this study. This study also includes 4 major corridors that connect the Twin Cities metropolitan area to regional freight centers in St. Cloud, Mankato, and
Rochester. List of each freight corridor ID referred in the data processing and analysis, and its corresponding route description is tabulated in Table 2-3.
Table 2-1 Summary of ATRI GPS Data
Data Set DS-A DS-B DS-C
Time Zone GMT/UTC GMT/UTC GMT/UTC
Spot Speed Yes No Yes
Static ID Yes Rotates every 15 days Rotates every 24 hours
Data Accuracy Within <3 meters
Within 124-134 meters at 90% probability and 129-150 meters at 95% probability. Within 13-56 meters at 90% probability and 15-58 meters at 95% probability.
Snap Tolerance Used (meter) 50 150 50
2013 Number of Truck Trips 74,823 35,179 76,471
2013 Raw Data Size 50,170,591 3,142,634 38,871,190
2013 Snapped 18,792,493 957,076 13,270,602
2013 Snapped Percentage 37.5% 30.5% 34.1%
Average Sampling Time (min) 8 18 1
SD Sampling Time (min) 15 26 5
Table 2-2 ATRI Truck GPS Dataset
Data Field DS-A DS-B DS-C
1 truckid truckid truckid
2 readdate readdate readdate
3 speed - speed
4 heading - -
5 latitude latitude latitude 6 longitude longitude longitude
14
Table 2-3 List of Routes in TCMA
Route ID Interstate Highway No. Highway Name Length (mile)
1 N 242 State Highway 242 13.19 2 N 610 State Highway 610 6.80 3 N 252 State Highway 252 4.10 4 Y 694 Interstate 694 22.37 5 N 36 State Highway 36 21.61 6 Y 494 Interstate 494 42.78 7 N 100 State Highway 100 15.80 8 Y 394 Interstate 394 9.58 9 N 12 US Highway 12 16.49 10 N 280 State Highway 280 3.32 11 N 7 State Highway 7 34.26 12 N 62 State Highway 62 12.39 13 N 110 State Highway 110 1.38 14 N 212 US Highway 212 34.37 15 N 77 State Highway 77 11.77 16 N 32 County Road 32 1.99 17 N 101 County Road 101 2.19 18 N 42 County Road 42 21.38 19 N 316 State Highway 316 7.82 20 N 18 County Road 18 3.07 21 N 51 State Hwy 51 11.24 22 N 97 State Hwy 97 12.83 23 N 95 State Hwy 95 126.43 24 Y 94 I-94 135.45 25 N 8 US Highway 8 22.12 26 N 65 State Hwy 65 58.35 27 N 61 US Highway 61 60.91 28 N 55 State Hwy 55 55.00 29 N 52 US Hwy 52 85.12 30 N 5 State Hwy 5 85.98 31 N 10 US Hwy 10 99.87 32 N 47 State Hwy 47 58.48 33 Y 35 I-35E** 113.68 34 Y 35 I-35W 116.10 35 N 3 State Hwy 3 46.56 36 N 21 State Hwy 21 38.38 37 N 169 US Hwy 169 104.09 38 N 13 State Hwy 13 43.37
* Highlighted in light blue are the interstate corridors. Highlighted in pink are the US corridors. ** I-35E from TH-5 to I-94 is excluded from the key freight routes
15
Figure 2-1 Key Freight Corridors in Twin Cities Metro Area (Note: I-35E from TH-5 to I-94 is excluded from the key freight routes)
St. Cloud
Mankato
Rochester
Key Freight Corridors in
Twin Cities Metro Area
ATR Volume ATR Volume/Speed ATR Volume/Speed/Class WIM County Road Interstate State Highway US Highway HIGHWAY Anoka Carver Chisago Dakota Hennepin Ramsey Scott Washington COUNTY
2.3 Data Processing Methodology
A route geo-spatial database of 38 key freight corridors in the TCMA was prepared using the ArcGIS software (http://www.esri.com/software/arcgis). The geographic information system (GIS) roadway network data was imported to an open source Structured Query Language (SQL) object-relational database, called PosgreSQL (http://www.postgresql.org/). In addition, a spatial database extension, call PostGIS (http://postgis.net/), for PostgreSQL database was included to support geographic objects analysis and allow location queries to be executed in the SQL environment.
16
After importing the raw truck GPS data from each dataset into the PostgreSQL database, several SQL scripts were developed to locate nearest roadway segments for all GPS latitude-longitude points and compute linear referencing measurements and distances. Individual vehicle trip speed was then computed by grouping vehicle ID and sorting the location data by time. Average vehicle space mean speed of a network segment is calculated by dividing the linear distance difference over time difference between two consecutive GPS data points within the same trip. Vehicle spot speed was also included for later data analysis. Processed data does not meet the speed filtering parameters (potential anomalies) are stored in a separate database for later truck stop location and stop duration analyses. The data processing and analysis flowchart was presented in Figure 2-2. Create Route Spatial Database Locate Features Raw Probe Vehicle GPS Data Merge AVL GPS Data on Route Sort by Vehicle
Trips and Time
Calculate Segment Space Mean Speed Vehicle Space Mean Speed by Segment Data Quality Filtering Vehicle Stops and Stop Durations Generate Vehicle Speed Statistics Segmentation Program Vehicle Spot Speed, if available
Figure 2-2 Data Processing Flowchart
Truck speed variations by location and by hour of day were analyzed. Speed and volume variations at specified mile marker were analyzed to compare the changes over the hour of day. Computed truck speed versus the general traffic speed gathered by state DOTs were compared to evaluate the speed difference between trucks and passenger vehicles. Raw truck GPS data did not pass through the data quality filter were trucks that might stop for service or rest. Public truck rest locations or facility along the key corridors in the TCMA and their stop durations were also derived to evaluate truck parking activity and service availability.
17
2.4 Data Analysis
Data proximity, spot vs. processed speed (or space mean speed), comparisons of speed and hourly volume percentage between probe vehicles and WIM stations were discussed and presented in this section. Positive direction is defined as the direction along a route where mile post increases. And the negative direction is the direction along a route where mile post
decreases. Bar charts of number of probe vehicle data points by route in both directions are included in Appendix D.2.
2.4.1 GPS Data Proximity Analysis
Due to GPS data accuracy and the accuracy of road network GIS data, collected GPS data points distribute along a roadway as illustrated in Figure 2-3. As shown in the bar charts of data
proximity by route in Appendix D.3, most of raw data from dataset A and C are, in average, 20 meters away from roadway centerline. In average, most GPS points from Dataset B are about 70 meters away from roadway.
Figure 2-3 Example of GPS Data Point Cloud
2.4.2 Comparisons of Processed Probe Vehicle Results and WIM data
There are four Weigh-In-Motion (WIM) stations in the TCMA. The WIM sensor records individual vehicle speed, classification, and weight information. It’s an ideal source to validate processed probe vehicle data. 12-month of WIM data from all four stations were received from MnDOT. Both passenger vehicles (class 2) and heavy commercial vehicles (class 9 and above) were analyzed and compared with processed results from probe vehicle data. Descriptions of these four WIM stations and their corresponding 2011 HCAADT counts are listed in Table 2-4 as follows. WIM station #37 is discussed in the following section. Additional data analysis results of WIM station #36, 40 and 42 are presented in Appendix D.4 ~ D.7.
18
Table 2-4 Description of WIM stations
WIM ID 36 37 40 42
Route Name MN 36 I-94 US 52 US 61
County Name Washington Wright Dakota Washington
City Name Lake Elmo Otsego West St Paul Cottage Grove
Direction EB WB NB SB
Mile Post 15 200 127 119
WIM Location Description
.7 mi W of CSAH17 Lake Elmo Ave N) in Lake Elmo 1.2 mi NW of CSAH19 (La Beaux Ave) in Otsego 0.5 mi N of CSAH14 in West St. Paul 0.4 mi S of TH95 (Manning Ave S), S of Cottage Grove
WIM Type VOLUME/SPEED/CLASS/WEIGHT
Route ID 5 24 29 27
Roadway Segment ID 15 59 81 16
Linear Ref Direction 1 1 1 -1
2011 HCAADT 1100 6900 4400 1750
2.4.3 Spot vs. Space Mean Speed
Spot speed is the instantaneous vehicle speed captured by the GPS unit. Processed speed (or space mean speed) is the average vehicle speed calculated based on two consecutive vehicle GPS locations. Dataset A and C have spot speed information while dataset B does not have spot speed information. Spot speed at mile post 200 on I-94 is analyzed and compared with space mean speed as an example.
The histogram of probe vehicle spot speed and space mean speed are displayed in Figure 2-4(a) and 2-4(b) in both directions. In the increasing mile post direction (positive direction), the median of spot speed and space mean speed are 64.0 and 64.2 MPH, respectively. The distribution of average spot speed in positive direction is 61.3 MPH; 2.4 MPH lower than the average space mean speed at the same location. Similarly, the median of spot speed and space mean speed in the decreasing mile post direction (negative direction) are 64.0 and 64.5 MPH, respectively. The distribution of average spot speed in negative direction is 62.7 MPH, 1.7 MPH lower than the average space mean speed at the same location. In general, the standard deviation of spot speed is about twice as large as the processed speed in both directions.
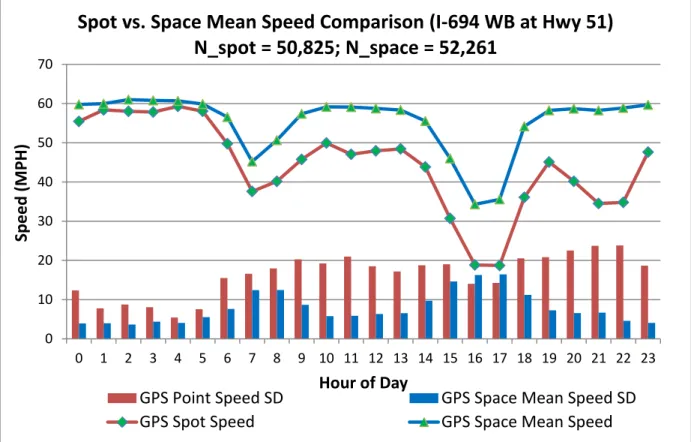
Figure 2-5(a) illustrates the hourly comparison of average spot speed with space mean speed at a segment on I-694 WB before the Highway 51 exit ramp. The average spot speed, displayed by the red curve with green diamond marker, is about 14 MPH lower than the space mean speed displayed in blue curve with triangle marker after 7AM. The gap is significantly larger from 9-11PM. The hourly spot speed average has larger standard deviation as compared to the average space mean speed. The standard deviation of the spot speed is as high as 20 MPH after 7AM. The standard deviation of the space mean speed exceeds 10 MPH during the AM and PM peak hours as shown in Figure 2-5(a).
19
Figure 2-4(a) Spot vs. Space Mean Speed on Route I-94 at Mile Post 200 (In Increasing Mile Post Direction)
Figure 2-4(b) Spot vs. Space Mean Speed on Route I-94 at Mile Post 200 (In Decreasing Mile Post Direction)