current precision viticulture
practices: predicting vineyard
performance
by
Yolandi Barnard
Thesis presented in partial fulfilment of the requirements for the degree of
Master of Agricultural Science
at
Stellenbosch University
Department of Viticulture and Oenology, Faculty of AgriSciences
Supervisor:
Dr CA Poblete-Echeverría
Co-supervisor:
Dr AE Strever
DECLARATION
By submitting this thesis electronically, I declare that the entirety of the work contained therein is my own, original work, that I am the sole author thereof (save to the extent explicitly otherwise stated), that reproduction and publication thereof by Stellenbosch University will not infringe any third-party rights and that I have not previously in its entirety or in part submitted it for obtaining any qualification.
Date: December 2018
Copyright © 2018 Stellenbosch University All rights reserved
SUMMARY
Producing high quality grapes is difficult due to intra-vineyard spatial variability in vineyards. Variability leads to differences in grape quality and quantity. This poses a problem for producers, as homogeneous growth is nearly non-existent in vineyards. Remote sensing provides information of vineyard variability resulting in better knowledge of the distribution and occurrence thereof, leading to improved management practices. Remote sensing has been studied and implemented in several fields of research and industry, such as monitoring forest growth, pollution, population growth, etc. The potential to implement remote sensing technology is endless. Generating variability maps introduces the possibility of plant specific management practices, to alleviate problems occurring from variability. Aerial and satellite remote sensing provide new methods of variability monitoring, through spatial variability mapping of soil and plant biomass. Advances in geo-referencing and geolocations provide high accuracy precision tools for producers and researchers. New technology introduces possible means of vigour classification and stress monitoring on a plant scale, relieving the uncertainty caused by the distribution and extent of variability in vineyards. Vineyards are more difficult to analyse with remote sensing technology, due to the discontinuous canopies resulting in objects, other than plant biomass, to be monitored with the plant biomass. These objects can be soil and inter-row plant growth, along with trees close to or adjacent to the vineyards. This provides a dilemma through diluting biomass estimations and resulting in misinterpretation of the vineyard variability. These problems could be solved with the use of high-resolution multispectral imaging, providing clear classification and information of plant growth and health status. These sensing technologies have only been studied in some industries and have yet to be implemented to provide plant specific information. Introducing high accuracy plant specific information along with geolocation information will provide the producer with enough information to implement specific management practices alleviating heterogeneous plant growth and promoting homogeneous growth and yield, resulting in improved economic status through limiting input costs and environmental impact, providing better living conditions for plants along with increased plant longevity.
The aim of the study was to evaluate the accuracy of leaf area index (LAI) estimations from selected remote sensing technologies with three different sensor resolutions. Imaging of the experimental site with natural variability were taken with the remote sensors. Targeted vines in the vineyard were selected as ground control points for ground truth measurements. The data acquired from the ground truth measurements were compared to the normalised difference vegetation index (NDVI) values generated from the remote sensing technologies. Grid analysis was performed on the unmanned aerial vehicle (UAV) multispectral images, mapping the LAI of individual plants. Significant differences in LAI predictions were obtained with good correlations between the ground truth data and the UAV multispectral image NDVI, r2 = 0.69. Climatic
Variability is often caused by environmental factors, although management practices influence variability of vineyards. Management practices can be beneficial to plant growth, such as tillage promotes soil aeration and biodiversity through mixing the soil layers and providing more homogeneous soil conditions in the vineyard, or detrimental, for example saline irrigation water can lead to toxic saline concentrations in the soil and result in plant degradation over time as the symptoms are only visual when toxicity has occurred. Salinity also provides improved soil moisture conditions through reducing the rate of soil drying. Other factors result in zonal variability, such as patchy growth from nutrient deficiencies or irregular growth patterns from pests or diseases. Remote sensing technology provides several sensing methods to determine the extent and distribution of variability. These methods involve various sensors, such as multispectral, light distance and ranging (LiDAR), etc., providing enough information to make informed decisions on management practices to limit variability or improve the extent thereof. These sensors are attached to aerial, satellite or ground platforms depending on the resolution needed and the extent of the study site.
Field measurements of the selected ground truth sampling points showed the presence of natural variability and the distribution thereof in the vineyard. Analysis of the UAV multispectral images revealed a good correlation between the ground truth data and the NDVI values. Soil and other objects were removed from the multispectral images, resulting in increased accuracy of biomass estimations and limited the NDVI blending effect observed in low-resolution images. Pixel based NDVI values of each plant, generated from the UAV multispectral device, were averaged to provide the NDVI per plant. Satellite images generated resolution-based area averages and blended pixel values of the soil and other objects adjacent to the vines limiting the plant-based information. Satellite images were affected by climatic conditions, especially cloud cover, along with limited image acquisitions revealed restricted image usability. UAV multispectral images provided plant-based LAI maps based on information generated through grid analysis, revealing the distribution of variability with accurate vine locations.
This study provided methods of autonomous image analysis for high- and low-resolution remote sensing technology. Models with accurate plant-based estimations to monitor and evaluate management practices will improve grape production and optimise quality resulting in improved wine quality. Selective harvesting and management practices will lead to optimised yield quality for targeted wine production, feeding the consumer driven industry. This study paved the way for future research in variability estimations from remote sensing technology with emphasis on the causes of within-vineyard variability.
OPSOMMING
Die vervaardiging van hoë gehalte druiwe is ingewikkeld as gevolg van variasie in wingerde. Variasie lei tot verskille in druiwe kwaliteit en kwantiteit. Dit hou 'n probleem in vir produsente, deur homogene groei wat byna nie in wingerde bestaan nie. Afstandswaarnemingstegnologie verskaf inligting oor wingerd variasie wat lei tot 'n beter kennis van die verspreiding en voorkoms daarvan en dus verbeterde bestuurspraktyke. Afstandswaarneming is ondersoek en geïmplementeer in verskeie navorsings- en nywerheidsvelde, soos die monitering van oerwoudgroei, besoedeling, bevolkingsgroei, ens. Die implementeringspotensiaal van afstandswaarnemingstegnologie is eindeloos. Deur variasiekaarte saam te stel, kan plantspesifieke bestuurspraktykte geïmplementeer word, wat probleme wat die voorkoms van variasie veroorsaak, kan verlig. Lugfoto’s en satelliet afstandswaarnemingstegnologie bied nuwe metodes van variasie monitering deur die kartering van grond- en plantbiomassa ruimtelike variasie. Vooruitgang in geo-verwysings en geo-ligging bied 'n hoë akkuraatheid presisie instrumente vir produsente en navorsers. Nuwe tegnologie stel moontlike maniere van groeikrag klassifikasie en stresmonitering op 'n plantvlak voor, dus verligting van onsekerheid wat veroorsaak word deur die verspreiding en omvang van variasie in wingerde. Wingerde is moeiliker om met afstandswaarneming tegnologie te ontleed, te danke aan die diskontinue lower wat lei tot monitering van voorwerpe, anders as plantbiomassa. Hierdie voorwerpe kan grond en tussen-ry plant groei wees, saam met bome wat naby of aangrensend aan die wingerd is. Dit bied 'n dilemma deur verdunde biomassa skattings en lei tot waninterpretasie van wingerdvariasie. Hierdie probleme kan opgelos word met die gebruik van 'n hoë-resolusie multispektrale kamera, deur duidelike klassifikasie en inligting van plantegroei en gesondheidstatus te verskaf. Hierdie afstandswaarnemingstegnologie is slegs in sommige nywerhede bestudeer en is nog nie gebruik om plantspesifieke inligting te verskaf nie. Die bekendstelling van hoë akkuraatheid plantspesifieke inligting saam met ligginggewing inligting sal aan die produsent genoegsame inligting verskaf om spesifieke bestuurspraktyke daar te stel ter verligting van heterogene plantegroei en die bevordering van homogene groei en opbrengs, wat lei tot verbeterde ekonomiese status deur die beperking van insetkoste en omgewingsimpak, dus beter lewensomstandighede vir plante te verskaf tesame met 'n verlengde plant lewensverwagting.
Die doel van die studie was om blaaroppervlakte indeks (LAI) skattings van geselekteerde afstandswaarnemingstegnologieë met verskillende resolusies te evalueer. Lugfoto’s is van die eksperimentele terrein, wat natuurlike variasie toon, geneem met die afstandswaarnemingstegnologie. Geteikende stokke in die wingerd is gekies as grondkontrolepunte vir grond waarheidsmetings. Data verkry uit die grond waarheidsmetings is vergelyk met die genormaliseerde verskil plantegroei indeks (NDVI) metings verkry van die afstandswaarnemingstegnologieë. Matriks analise is uitgevoer op die onbemande vliegtuig (UAV)
multispektrale beelde wat tot kartering van die individuele plante se LAI gelei het. Beduidende verskille in LAI voorspellings is verkry deur 'n goeie korrelasie tussen die grond waarheid data en die NDVI van die UAV multispektrale beelde. Klimaatstoestande het probleme vir die satellietbeelde aangedui, waar resolusie ook 'n probleem was.
Veranderlikheid is dikwels veroorsaak deur omgewingsfaktore, hoewel bestuurspraktyke variasie van wingerde beïnvloed. Bestuurspraktyke kan voordelig wees vir die groei van plante, bv. grondbewerking wat deurlugting en biodiversiteit bevorder deur die vermenging van grondlae en meer homogene grondtoestande te verskaf in die wingerd, of nadelig, bv. sout besproeiingswater kan lei tot giftige sout konsentrasies in die grond en met verloop van tyd lei na plant agteruitgang waar visuele simptome slegs toon nadat toksisiteit plaasgevind het. Soutgehalte bied ook verbeterde grondvog toestande aan deur die tempo van grond droging te verlaag. Ander faktore lei tot sonale variasie, soos onewe groei deur voedingstekorte of onreëlmatige groeipatrone van peste of siektes. Afstandswaarnemingstegnologie bied verskeie waarnemingsmetodes aan om die omvang en verspreiding van variasie te bepaal. Hierdie metodes behels verskeie sensors, soos multispektrale kameras, “light distance and ranging” (LiDAR), ens, wat genoeg inligting verskaf om ingeligte besluite oor bestuurspraktyke te neem om variasie te beperk of verbeter. Hierdie sensors is aan lug-, satelliet- of grondplatforms geheg, afhangende van die resolusie wat nodig is en die omvang van die studie area.
Veldmetings van die gekose grond waarheid monsternemingspunte het die teenwoordigheid van natuurlike variasie en die verspreiding daarvan in die wingerd. Ontleding van die UAV multispektrale beelde het 'n goeie korrelasie tussen die grond waarheid data en die NDVI waardes geopenbaar. Deur grond en ander voorwerpe uit die multispektrale beelde te verwyder, word verhoogde akkuraatheid van biomassa skattings verkry en die NDVI vermenging effek waargeneem in 'n lae-resolusie beelde beperk. Gemiddelde pixel gebaseerde NDVI waardes van elke plant, wat uit die UAV multispektrale toestel verkry is, het die totale NDVI van elke plant opgemaak. Satellietbeelde het resolusie-gebaseerde area gemiddeldes met gemengde pixelwaardes van die grond en ander voorwerpe langs die wingerd gegenereer en tot beperking van plant-gebaseerde inligting gelei. Satellietbeelde is deur klimaatstoestande beïnvloed, veral wolkbedekking, wat saam met beperkte beeld aanwinste die bruikbaarheid van die beelde verlaag. UAV multispektrale beelde, wat gebaseer is op inligting gegenereer deur matriks analise, verskaf plant-gebaseerde LAI kaarte, wat lei tot die onthulling van die verspreiding van variasie met akkurate wingerdstok posisies.
Hierdie studie verskaf metodes van outomatiese beeld analise vir hoë- en lae-resolusie afstandswaarnemingstegnologieë. Modelle met akkurate plant-gebaseerde skattings wat monitering en evaluasie van bestuurspraktyke tot gevolg het, sal druiwe produksie verbeter en druiwe kwaliteit optimaliseer wat sal bydra tot verbeterde wyngehalte. Selektiewe oes- en
bestuurspraktyke sal lei tot optimale opbrengsgehalte vir geteikende wynproduksie uitkomste, wat die verbruiker-gedrewe bedryf sal voed. Hierdie studie het die weg gebaan vir toekomstige navorsing in variasie skattings met afstandswaarneming tegnologie met klem op die oorsake van in-wingerd variasie.
BIOGRAPHICAL SKETCH
Yolandi Barnard was born in Pretoria on 20 April 1993. She matriculated at Stellenberg High School in 2011. Yolandi enrolled at Stellenbosch University in 2012 and obtained the degree BScAgric in Viticulture and Oenology in December 2016. She then enrolled for the MScAgric in Viticulture degree in 2017 at Stellenbosch University.
ACKNOWLEDGEMENTS
I wish to express my sincere gratitude and appreciation to the following persons and institutions: Dr CA Poblete-Echeverría, Department of Viticulture and Oenology, Stellenbosch University, for his invaluable guidance, encouragement and motivation as a supervisor for my project.
Dr AE Strever, Department of Viticulture and Oenology, Stellenbosch University, for his input, enthusiasm and absolute encouragement as a co-supervisor for my project.
Ms E Moffat, Department of Viticulture and Oenology, Stellenbosch University, for her support and invaluable assistance throughout this study.
Dr T Southey, Department of Viticulture and Oenology, Stellenbosch University, for her support and invaluable assistance throughout this study.
My family: Mr JL Barnard (sr.), Mrs M Barnard and Mr JL Barnard (jr.), for their encouragement and support throughout this process
Mr A Bellotto and Mr N Manzan, Università degli studi di Padova, for their assistance in the trial.
Ms R Loubert, University of Earth, Costa Rica,for his assistance in the field.
My friends, for their encouragement and support throughout this process.
WINETECH, the Department of Science and Technology (DST) as well as the Institute of Grape and Wine Sciences (IGWS) for financial support for the project.
PREFACE
This thesis is presented as a compilation of four chapters. Each chapter is introduced separately and is written according to the style of the South African Journal of Enology and Viticulture, except Chapter 3, which is a draft article for publication in Sensors Journal.
Chapter I General introduction and project aims
Chapter II Literature review
Causes of variability in vigour and variability assessment using remote sensing technologies
Chapter III Research results
Chapter 3. Evaluation of intra-vineyard spatial and temporal variability of Leaf Area Index using multispectral images obtained by satellite (Landsat 8, Sentinel-2) and unmanned aerial vehicle platforms.
Table of Contents
Chapter 1. General introduction and project aims
1
1.1 Introduction 2
1.2 Specific project aims 4
1.3 References 4
Chapter 2. Causes of variability in vigour and variability assessment using remote
sensing technologies
6
2.1 Introduction 7
2.2 Leaf Area Index (LAI) 8
2.3 Causes of variability 10 2.3.1 Management practices 11 2.3.2 Soil 11 2.3.3 Topography 12 2.3.4 Climate 12 2.3.5 Water stress 13
2.3.6 Other stress related factors 13
2.3.7 Effect of variability on grape and wine quality 14
2.4 Assessing variability using remote sensing technology 15
2.4.1 Positioning/operational systems 16
2.4.2 Sensors 16
2.4.3 Platforms 18
2.5 Conclusion 19
2.6 References 20
Chapter 3. Evaluation of intra-vineyard spatial and temporal variability of Leaf Area
Index using multispectral images obtained by satellite (Landsat 8, Sentinel-2) and
unmanned aerial vehicle platforms.
28
1 Introduction 29
2 Materials and methods 31
2.1 Experimental site 31
2.2 Leaf area index measurements 31
2.3 Remote sensing data 31
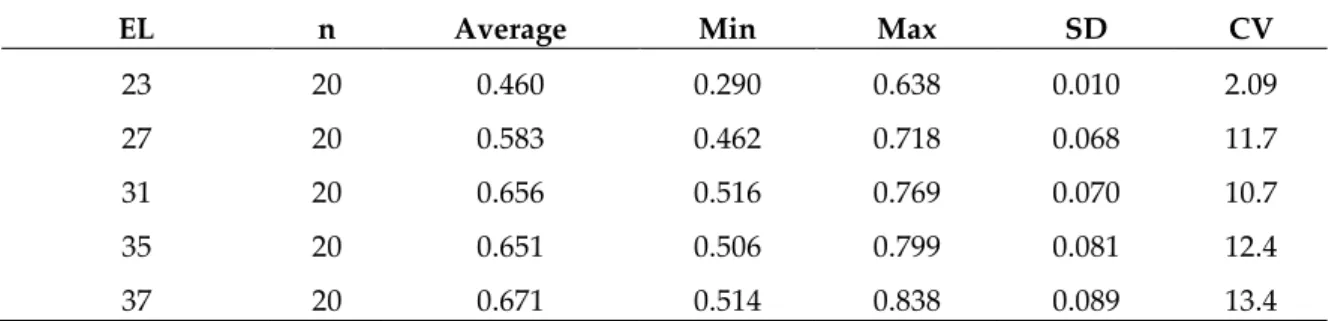
3 Results 33
3.1 Descriptive analysis of leaf area index measurements 33
4. Discussion 36
5. Conclusion 39
6. References 39
Chapter 4. General conclusions and perspectives
43
Chapter 1
General introduction and
project aims
CHAPTER 1: GENERAL INTRODUCTION AND PROJECT
AIMS
1.1 Introduction
Vineyard spatial variability is a natural occurring phenomenon that can be generalised as the growth and responses of plants in an environment. These responses can be beneficial to the plant, promoting health and disease resistance, or detrimental where in severe cases plant death can occur. Variability can occur between adjacent vines (Hunter et al., 2010), vineyards situated close to each other (Bramley, 2004), or even in a given region (Blanco-Ward et al., 2007), e.g. Stellenbosch.
Viticultural practices currently in use, i.e. general management, do not generally account for the spatial variability in the vineyard and may therefore result in more stressed vines due to misrepresentation of the vineyard status. Strategies, especially irrigation, are implemented through the measurement of a few selected vines, which may not be representative of the whole block. The latter strategy may introduce larger problems in the vineyard, as over irrigation leads to waterlogged conditions that increase the occurrence of root rot and even vine death. Bramley & Hamilton (2004) stated that the strategies used to monitor and estimate variation are inaccurate due to the lack in methods to observe and monitor variation, therefore the variability of the vineyards are regarded as non-existing resulting in the implementation of general viticulture practices. Irrigation strategies, such as partial root drying, or deficit irrigation can be selectively implemented to increase the balance of vineyard growth (Zsófi et al., 2009), resulting in a decreased occurrence of variability.
To optimise the production, quality and health of vines, research on developing technology (Mack et al., 2017; Llorens et al., 2011) and remote sensing (Matese and Di Gennaro, 2015; Moran et al., 1997) have provided beneficial alternatives to improve management practices. These technologies along with the use of field measurements and historical records are beneficial to improve future management practices. The previously mentioned strategy is regarded as Precision viticulture.
Precision viticulture is regarded as a high priority in viticulture, due to the improvement of environmental impact and the consequent profitability (Whelan and McBratney, 2000). Remote sensing forms part of Precision viticulture, i.e. by using unmanned aerial vehicles (UAV’s) mounted with sensors, such as multispectral, thermal and high-resolution cameras. Satellite image analysis has formed part of crop characterisation research and has proven to be beneficial for crops with continuous canopies, e.g. wheat and corn, rather than those with discontinuous canopies, e.g. vineyards. The use of these technologies has grown exponentially throughout the agriculture industry.
The continuous development of new technology provides the possibility of increased accuracy for estimations and evaluations of current and past management practices (Moran et al.,1997; Bellvert et al., 2014). These technologies are increasingly difficult to use and to interpret
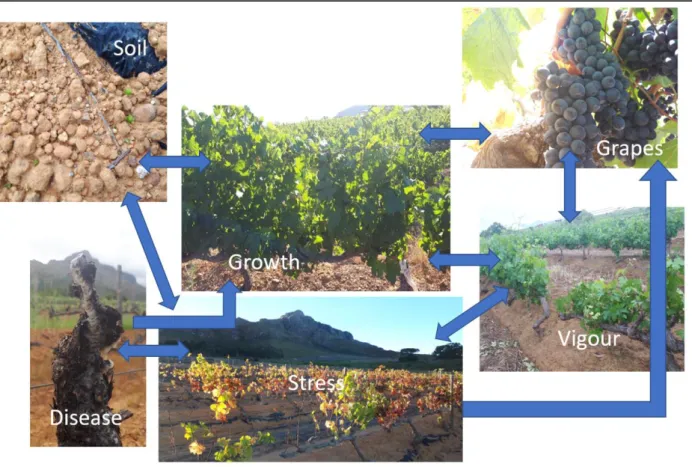
data, due to the complex methodology and abundance of data. In the research field, creating automated and easy-to-use models are of great importance. Challenges arise to ensure the models are easily accessible and user friendly, creating usable on-the-go methods to determine vine health and production. The completion of the previously mentioned could provide models that can link vineyard variability parameters (Figure 1) to improve fast implementation for preventative or aiding management practices.
Figure 1: Relationships between parameters influencing growth and development that can be monitored or prevented with technology.
The goal of this study is to improve current analysis methods of various resolution satellite and UAV multispectral imaging technology and the influence of resolution parameters in the estimation of vigour (leaf area index; LAI), resulting in adequate knowledge of the status of the vines and where/when problem areas arise. This project received industry funding to study the possible role of imaging technologies to make timely decisions for optimal vineyard management and decreased inputs via costs and labour. Problems in the wine industry were identified and provided this study with relevant information to introduce objectives to address current problems. This project mainly focussed on Vitis vinifera L. cv. Pinotage in Stellenbosch (South Africa). This study was conducted to improve the understanding of variability in the vineyard. The project focussed on satellite and UAV multispectral imaging technology, and the improvement of the data analysis to make it more readily available for commercial farmers. Imaging technologies, therefore, formed the backbone of this study.
1.2
Specific Project Aims
To achieve these goals, a field trial was designed to incorporate random variability, leading to the following aims and objectives:
i) Identify and characterise variability in the vineyard and the possible causes of vigour variability using UAV multispectral imaging
a. Perform imaging at various stages during the growing season
b. Analyse unmanned aerial vehicle (UAV) multispectral images to characterise vigour variability (temporal and spatial)
c. To compare the relationship between field measurements and remote sensing UAV images in relation to temporal and spatial variability
ii) Assess the accuracy of high-resolution UAV multispectral images regarding LAI estimation in comparison to low-resolution satellite imaging technology
a. Provide an easy-to-use method of extracting normalized difference vegetation index (NDVI) values from UAV multispectral and satellite images
b. Use extracted NDVI values to investigate the interference of inter-row soil reflectance
c. Determine the optimal resolution needed for LAI estimation at plant level
The field experiment considered the natural variability of the vineyard block, enabling the satellite and UAV multispectral imaging technology currently available to cover the complete vineyard for preliminary field characterisation, classification and zoning. Vineyard zoning practices enable producers to select specified vines with pre-determined grape compositions or vigour, in theory, for selective vineyard management practices and winemaking. Allowing producers to identify the optimal vines for special wines, e.g. limited release, and limiting production costs and losses to ensure sustainable farming practices.
1.3
References
Bellvert, J., Marsal, J., Girona, J., and Zarco-Tejada, P.J., 2014. “Seasonal Evolution of Crop Water Stress Index in Grapevine Varieties Determined with High-Resolution Remote Sensing Thermal Imagery.” Irrigation Science. Https://doi.org/10.1007/s00271-014-0456-y. Blanco-Ward, D., Queijeiro, J.M.G., and Jones, G., 2007. “Spatial Climate Variability and Viticulture in the Miño River Valley of Spain.” Vitis - Journal of Grapevine Research 46 (2): 63.
Bramley, R.G.V., 2004. “Understanding Variability in Winegrape Production Systems 2. Within Vineyard Variation in Yield over Several Vintages.” Australian Journal Of Grape And Wine Research 10 (2): 32–45. https://doi.org/10.1111/j.1755-0238.2004.tb00006.x.
Bramley, R.G.V., and Hamilton, R.P., 2004. “Understanding Variability in Winegrape Production Systems 1. Within Vineyard Variation in Yield over Several Vintages.” Australian Journal Of Grape And Wine Research 10 (1): 32–45. https://doi.org/10.1111/j.1755-0238.2004.tb00006.x.
Hunter, J., Archer, E., and Volschenk, C.G., 2010. “Vineyard Management for Environment Valorisation.” In Proc. Eighth International Terrior Conference, Soave, Italy., 3–15.
Llorens, J., Gil, E., Llop, J., and Escolà, A., 2011. “Ultrasonic and LIDAR Sensors for Electronic Canopy Characterization in Vineyards: Advances to Improve Pesticide Application Methods.” Sensors. https://doi.org/10.3390/s110202177.
Mack, J., Lenz, C., Teutrine, J., and Steinhage, V., 2017. “High-Precision 3D Detection and Reconstruction of Grapes from Laser Range Data for Efficient Phenotyping Based on Supervised Learning.” Computers and Electronics in Agriculture 135: 300–311. https://doi.org/10.1016/j.compag.2017.02.017.
Matese, A., and Di Gennaro, S.F., 2015. “Technology in Precision Viticulture: A State of the Art Review.” International Journal of Wine Research. https://doi.org/10.2147/IJWR.S69405. Moran, M.S., Inoue, Y., and Barnes, E.M., 1997. “Opportunities and Limitations for Image-Based
Remote Sensing in Precision Crop Management.” Remote Sensing of Environment 61 (3): 319–46. https://doi.org/10.1016/S0034-4257(97)00045-X.
Whelan, B.M., and McBratney, A.B., 2000. “The ‘“Null Hypothesis”’ of Precision Agriculture Management.” Precision Agriculture 2: 265–79. https://doi.org/10.1023/A.
Zsófi, Zs., Gál, L., Szilágyi, Z., Szücs, E., Marschall, M., Nagy, Z., and Bálo, B., 2009. “Use of Stomatal Conductance and Pre-Dawn Water Potential to Classify Terroir for the Grape Variety Kekfrankos.” Australian Journal of Grape and Wine Research 15 (1): 36–47. https://doi.org/10.1111/j.1755-0238.2008.00036.x.
Chapter 2
Literature review
Causes of variability in vigour and variability
assessment using remote sensing technologies.
LITERATURE REVIEW
2.1
Introduction
Traditional management practices for viticulture are under immense pressure to provide accurate information for real-time implementation. As a result, continuous research is done on the improvement and validation of these methods, included under the collective name “Precision Viticulture” (PV) (Schieffer and Dillon, 2014; Matese and Di Gennaro, 2015; Rey-Caramés et al., 2015). The ever-changing vineyard environment promotes the implementation of PV practices to develop satisfactory and well-planned management strategies, including the use of emerging sensing technologies.
Terroir is classified as the interaction of an ecosystem, including human intervention (Seguin, 1986; 1988). These factors give rise to variation in soil patterns, variability in vine growth and health and can be attributed to differences in soil, aspect, altitude, effective soil depth, water supply, etc. Variability is present in all vineyards. Several factors attribute to the occurrence, effect and distribution of variability. These factors include, amongst others, the topography (i.e. height above sea level, aspect, slope and latitude) and geology (i.e. soil factors such as composition, water holding capacity, texture and structure) of the vineyard. The manipulation of these factors is considered close to impossible (Carey et al., 2002). Variability can be classified as either spatial or temporal, where the latter is regarded as the most important (McBratney et al., 1997). Nonetheless, management strategies can contribute to a delay in onset of variation.
Several studies have investigated the influence of spatial variability in vineyards, i.e. yield (Taylor et al., 2005), quality (Bramley, 2004), vigour (Bramley et al., 2011), soil moisture (Zucco et al., 2014; Ramos and Martínez-Casasnovas, 2006; Molina et al., 2014), soil properties (Vasu et al., 2017), and grapevine water status (Taylor et al., 2010). Temporal variability is regarded as variability over time. This includes climatic conditions (i.e. rainfall, temperature and wine) and annual vineyard manipulations. These factors change annually due to vineyard requirements and climate change. Temporal variability is regarded as the most important, as it is regarded as unstable (Krstic et al., 1998).
PV is regarded as a high priority in viticulture, due to the improvement of environmental impact and possible increased profitability arising from its use (Whelan and McBratney, 2000). It includes the spatial variability arising in a plot along with differential management focused on subareas of the plot to ensure that the grape quality and lifespan of the vines in the subarea are optimal. This approach allows for little loss due to variability, i.e. of water content resulting in over-irrigation of some subareas and under-over-irrigation in others. PV achieves reductions in environmental impact (Schieffer and Dillon, 2014), due to the restriction in application of
pesticides, herbicides, fertilizers and other chemicals to desired areas. Factors such as labour, machinery costs and time limitations also decrease as part of PV management.
Alternative monitoring for vineyard management practices includes the use of developing technologies, such as sensors and imaging. Studies have shown that the use of sensors increase the efficiency of monitoring through the availability of real-time data (Santesteban et al., 2016). Sensors can be used to classify and characterise the growth and health of fruit bearing plants, regardless of species (Gongal et al., 2015).
Satellite imaging has been used to classify and monitor vineyards (Yandún Narváez et al., 2016). The sensors mounted in the satellites use wavelengths of both short- and long-wave solar radiation bands (Unninayar and Olsen, 2008). Satellites, such as Landsat, Sentinel, MODIS (Moderate resolution imaging spectroradiometer), HJ (Huanjing satellite), GF-1 (Gaofen satellite no. 1), image the Earth continually (Wu et al., 2015). Passive or active instruments are attached to the satellites (Table 1). The former collects radiation in the form of reflection, refraction or emission from the atmosphere or Earth’s surface. The latter generates and transmits electromagnetic signals, form instruments such as LiDAR and radar, to the Earth’s surface (Unninayar and Olsen, 2008).
The goal of this study is to determine causes of variability in vigour, focusing on leaf area index, to assess the distribution and occurrence of variability using remote sensing technologies, such as satellites and UAV imaging.
2.2 Leaf Area Index (LAI)
Vine leaf area (LA) is defined as the total leaf surface covering the growing shoots per vine. Winter canes are lignified vine shoots that grew during the growing season. Pruning mass and shoot length indicate the growth and vigour of the vine. This is commonly used as a vegetation index for vine growth (Edwards and Clingeleffer, 2013). LA develops inter-annually and is dependent on current environmental effects (Soar et al., 2006). Larger leaf areas relate to larger exposed leaf surface and in turn higher evapotranspiration. High vigour vines with large leaf areas have higher evapotranspiration rates than low vigour vines, therefore have a larger water requirement (Rossouw, 2010). In grapevines, Stem Water Potential (SWP) is an indicator to the water status of the plant. This method is time consuming and the implementation thereof is limited, as this method is destructive, and the removal of leaves can affect the crop adversely. Large negative SWP induces restricted shoot growth and leaf area resulting in a decreased LAI. Grapevines respond to deficit soil water potential in various ways, i.e. internode extension, leaf expansion and tendril elongation (Pellegrino et al., 2005), influencing the LA.
LAI has several definitions, including total, green and effective LAI (Further reading: Fang and Liang, 2008). These definitions differ slightly, where total LAI is mostly used in measuring the total outside LA per soil area (Equation 1).
𝑇𝑜𝑡𝑎𝑙 𝐿𝐴𝐼 =𝑇𝑜𝑡𝑎𝑙 𝑜𝑢𝑡𝑠𝑖𝑑𝑒 𝑙𝑒𝑎𝑓 𝑎𝑟𝑒𝑎
𝑆𝑜𝑖𝑙 𝑎𝑟𝑒𝑎 …… (1)
Direct methods used to determine LAI require leaf harvesting, sampling of adequate size, along with field or laboratory area determination and are generally used for the calibration of indirect methods (Fang and Liang, 2008). Leaf removal is an accurate, destructive and time consuming direct LA measurement method (Johnson et al., 2003). Canopy dimensions, height and width, are used to estimate the canopy volume (Llorens et al., 2011). Canopy volume is used as an indication to the vigour and health of vines.
The measurement of pruning mass, shoot length and the number of shoots are indirect methods of LA estimation (Johnson et al., 2003). The optimal bud load can be determined by the length of the shoots or pruning mass, indicating the vigour of the vine. Several factors influence shoot growth. These factors can be natural (biotic, abiotic) or due to intervention (management practices). Strever (2003) stated that the implementation of management practices such as tipping or topping influences the pruning mass. Soar et al. (2006) found that the pruning mass decreased noticeably during high stress conditions. Regulated deficit and prolonged deficit irrigation resulted in decreased pruning mass where the latter irrigation strategy yielded the lowest pruning mass (Edward et al., 2013). Soil can influence the growth of vines, through restricting root growth that results in less vegetative growth.
Indirect optical and contact methods are faster and more convenient than direct methods of LAI estimation (Fang and Liang, 2008). Indirect contact methods include the point quadrants method (King et al., 2014), which is a 1.2 m sharpened rod used to pierce the canopy in the fruit zone and determine the number of leaves intercepted, resulting in leaf layer or canopy density measurements (Dokoozlian and Kliewer 1995). On the other hand, indirect optical methods include ceptometers, hemispherical canopy photography (fisheye lens), TRAC instrument (radiation tracer) and LAI-2000 (gap fraction) (Fang and Liang, 2008).
Comas et al. (2010) stated that minimal and spur pruning produces comparable final canopy density. With minimal pruning, earlier canopy development is observed due to the increased bud load per shoot resulting in an initial higher leaf area. Soar et al. (2006) stated that rootstock choice influenced the leaf area, where own rooted Shiraz produced larger LA in optimal conditions and lower LA in stressed conditions compared to the grafted vines. LA development is influenced by the water availability in the soil. Water deficits result in decreased LA development, i.e. amount, thickness, composition, orientation (exposure) and size, due to the decrease in transpirable water (Rossouw, 2010). Senescence of old leaves occur during water deficit conditions (Serra Stepke,
2014). Vine phenological development decreased duration of growing season and leaf senescence, is influenced by irrigation strategies (Strever et al. 2012). Therefore, the influence of irrigation strategies can be assessed through LA.
The vigour of the vine plays an important role in the pruning mass. Vigorous vines tend to have long and thick shoots where vines with weak vigour have short and thin shoots. Pruning mass can, therefore, indicate vine growth, balanced or irregular (Rossouw, 2010), and define the capability of the soil to sustain growth. Soar et al. (2006) stated that own-rooted Shiraz produced the largest pruning mass compared to the grafted vines. This was the opposite when stress conditions were introduced.
LA is largely influenced by plant spacing, i.e.1.3 m2/vine for a spacing of 1.5 m by 0.5 m
compared to 6.3 m2/vine for a spacing of 3 m by 3 m (Jackson, 2014b). Internode length
determines the number of nodes on a shoot. This is due to the decreased area for leaf attachment with elongated internodes or overcrowding in the case of dwarfed internode lengths. Shorter internodes are observed when the transpiration rate exceeds the leaf water supply, resulting in stomatal closure (Archer and Strauss 1989). Several factors, such as leaf removal, tipping, topping, shoot removal and cover crops, are regarded as LA management practices (Johnson et al., 2003). Shoot removal increases secondary shoot growth, whereby the removed LA is re-established (Strever et al. 2012).
The choice in pruning system effects the growth and consecutive pruning mass derived from the vine growth. Pruning systems include cane and spur pruning, amongst others. Cane pruning allows for more bearing wood to remain on the vine, resulting in a larger bud load and reduced pruning mass (May, 1972), compared to spur pruning. Uneven shoot development can be attributed from the length of the bearing wood, in the case of apical dominance (Keller, 2010b). Rapid shoot growth induces cytokinin delivery that stimulates secondary shoot growth, resulting in an increased pruning mass (Strever et al. 2012).
Strong winds with prevailing directions can influence the growth of vines (Eugster, 2008). This is due to the wind damaging young shoots, resulting in the secondary bud breaking, or breaking older shoots, leading to lateral shoot growth. Secondary buds are less fertile than primary buds with tertiary buds being mostly infertile (Keller, 2010b). This phenomenon leads to decreased yield with increased LA per vine.
2.3 Causes of vigour variability
Vineyards are subject to several factors that promote or hinder the occurrence of variability. Temperature, nutrient status, pruning, vine age, soil moisture and genetic plant characteristics influence shoot growth and the development of vines (Keller, 2010a), giving rise to variability. De
Clercq (1999) stated that the geometric features of canopies are difficult to study due to spatial and temporal variability.
2.3.1 Management practices
Management practices are in general the most effective manner of improving the occurrence of variability, due to the interaction of environmental factors that are not manipulatable. In the past, costly and labour-intensive conventional vineyard management practices were implemented to account for the variation in growth vigour (Strever, 2003). Nel (2005) concluded that natural cycles, e.g. carbon cycle, are negatively influenced through conventional management practice, due to the increase in off-farm inputs. Zapata et al. (2017) stated that the prediction of phenological stages, with little error in degree days, could lead to improved management practices.
Management practices, such as canopy manipulation, impacts the vine physiology and growth that could influence the grape and wine quality (Strever et al. 2012; Hunter et al. 2014). The timing is of absolute importance as the stage of vineyard development will result in a different plant response, i.e. plant water deficits leading to stomatal closure resulting in the inhibition of leaf and shoot development (Archer and Strauss 1989). Increased photosynthesis rates are observed in leaves when leaf thinning is applied, along with a delay in leaf senescence (Strever et al. 2012).
Soil nutrient management of macro nutrients are of great importance to the development of vines and sustaining crop productivity (Vasu et al. 2017), i.e. grape composition and ripening. Likar et al. (2015) concluded that soil and canopy management is detrimental to vine nutrition, affected by biotic and abiotic soil characteristics. Soil tillage improves the soil structure affecting the aeration, water availability and nutrient status of the soil resulting in improved growing conditions for vines (Jackson, 2014b). Farms managed organically have significantly larger earthworm populations than farms that use conventional management practices (Nel 2005). Higher mycorrhiza fungi populations and diversity are achieved by farming organically (Likar et al. 2015).
2.3.2 Soil
Vineyard growth and soil variability are correlated (Bramley and Hamilton, 2004), i.e. areas with low soil fertility with waterlogged soil conditions will have low vigour/dead vines, whereas areas with high fertility and good soil texture will result in healthy vigorous growing vines. King et al. (2014) stated that variability in important soil properties can occur over short distances. Conradie et al. (2002) found that the conditions of South African soils have large variation over small distances. Within vineyard differences in soil available water leads to vigour variability (Rossouw, 2010). The growth and development of fruitless shoots indicate increased sensitivity to deficit soil moisture content compared to shoots bearing fruit (Strever et al. 2012). Archer and Strauss (1989)
stated that shoot growth is sensitive to soil available water. Poor soil fertility and water content decreases yield and grape quality (Vasu et al. 2017).
Jackson (2014b) stated that heat absorption of soil is affected by colour and structure, relating to frost protection and fruit development. Slower soil drying can be attributed to soil salinity, with high salinity leading to reduced evapotranspiration (De Clercq 1999). The mineral composition of grapevines are affected by soil (Van Leeuwen and Seguin 2006), e.g. soil composition reflects environmental conditions. Soil characteristics, such as pH, Ca content, and partitioning, affect the soil mineral composition and vineyard growth conditions (Jackson 2014a).
2.3.3 Topography
The most noticeable cause of variability through topography is linked to the site, i.e. altitude and latitude. The resulting variability increases with an increased altitude and/or latitude. This is attributed to the changes in solar radiation, i.e. near-infrared and visible spectrum of light. Improved solar radiation is subject to optimal solar angle. Jackson (2014a) stated that the optimum slope for maximum solar radiation is directed toward the Earth’s equator. Nonetheless, several local factors play an important role in site selection for optimal growing conditions for selected cultivars. The reflection of heat and radiation off water bodies and soil surfaces are limited with increased cloud cover conditions, resulting in reduced solar radiation and is most noticeable at low solar altitudes.
Row direction can decrease the effect of strong prevailing winds, that may cause damage to the vineyard growth. The row direction should be calculated to allow the wind to blow through the rows instead of through the vines (Jackson 2014a). This allows for improved air circulation to reduce the occurrence of rot or wind damage during the growing season. The airflow promotes decreased heat accumulation resulting in improved climate conditions for vines. This phenomenon leads to longer ripening periods and improved grape development (Strever et al. 2012), from a compound point of view, i.e. phenols.
2.3.4 Climate
Phenology is described as the initiation of new plant growth, through differentiation, and the impact of environmental factors on these processes (Coombe, 1995; Zapata et al., 2017). Slight changes in the localised atmospheric conditions could result in significant differences in the grapevine phenology (Lorenzo et al., 2013). Lorenzo et al. (2013) stated that grape composition is influenced by fluctuations in daily meteorological conditions.
Microclimate negatively influences soil properties, such as nutrient availability through leaching and erosion. This is also the case for water deficiency. The length and appearance of phenological stages are influenced by temperature (Caffarra and Eccel, 2010; Nendel, 2010). Holzapfel & Smith (2012) stated that carbohydrate mobilization and storage are more effected by seasonal climatic conditions than management practices. Warm temperature induces the
transport of cytokinin to auxiliary buds that stimulates secondary shoot growth (Strever et al. 2012).
De Clercq (1999) stated that increased crop stress is due to high temperatures, affecting the biochemical cycles in the leaves and increasing transpiration rates. Keller (2010b) suggested that low temperatures inhibit plant growth by lowering the production of proteins. Severe xylem cavitation occurs in vigorous vines during cold winter temperatures with dry soil conditions. Cavitation is irreversible and leads to abortion of plant structures.
2.3.5 Water stress
Grapevines are regularly produced under deficit irrigation (DI) strategies. Stress that occurs through the limitation of water has an impact on the development of berries. This could lead to misinterpretation of optimal ripeness as the biological ripeness and chemical ripeness of the berries fail to follow normal development when severe water stress is introduced.
Yield and grape quality are affected by the water status of the vine, in that severe water surplus increases the vegetative production of the vineyard and reduces the reproductive processes in the vine, resulting in limited production of grapes and a loss in grape quality (Pellegrino et al., 2005). Extreme water deficits can lead to canopy closure, reducing leaf area and exposing the fruit to environmental conditions (Pellegrino et al., 2005). There is, therefore, a need for the vineyard to have moderate water deficits, to ensure the vegetative growth is affected more than the reproductive growth and an increase in the quality of the fruit may be observed. Thus, there is a need for monitoring the water status of the vineyard throughout the ripening season of the grapes.
Vegetative growth and leaf area are restricted by salinity in irrigation water (De Clercq 1999), leading to stressed conditions. Plant water availability, indicated by leaf temperature, is an alternative method of determining plant response to stress conditions (Stoll et al., 2008). Water stress induces stomatal closure, leading to increased leaf temperature due to decreased transpiration (Sepúlveda-Reyes et al. 2016).
2.3.6 Other stress related factors
Vines grow in a diverse environment with numerous organisms influencing vine health, growth and development. Organisms present in the soil or above-round can be either neutral, beneficial or detrimental to vines. Brief explanations of some organisms will be covered in this section.
Neutral organisms do not damage grapes or vines, but rather use vines as shelter or as hunting grounds. Some of these organisms are incapable of breaching the defence system, such as yeast (Keller 2010b). Spiders and some birds use vines for hunting and reproduction purposes, along with shelter. These organisms do not influence grape development or vine growth.
Vines are dependent on beneficial organisms, e.g. bee’s and birds for reproduction purposes. Bee’s pollinate vine flowers whereas birds spread grape seeds. Grapevines are highly dependent on mycorrhizal bacteria, living around the root system and help break down important mineral bonds, making the minerals readily available for root uptake (Likar et al. 2015). Low mycorrhiza colonies in some over farmed soils are incapable of producing sufficient nitrogen (N) for plant growth, therefore N deficiencies occur in some vines, depending on soil structure and composition (Keller 2010b).
Phylloxera is a well know vineyard pest, feeding on vine roots and in some cases on the above-ground organs of vines (Keller 2010b). Jackson (2014a) stated that sandy soils prevent the movability of phylloxera and therefore less infestation is observed. Vines are usually grafted on phylloxera resistant rootstocks to prevent damage (Keller 2010b).
Cover crops determine the occurrence of pests, such as mealybug. Muscas et al. (2017) found that mealybugs performed better on vigorous vines with high nitrogen content. Mansour et al. (2012) found higher mealybug and ant populations in vineyards where no tillage was applied. Mealybugs influence grape composition and table grape quality (Daane et al., 2012), resulting in economic losses and vineyard variability due to variations in infestation and population. Virus transmission, promoting microorganism growth and feeding damage are some of the mealybug related damages (Jones et al., 2015).
Mealybugs are reported to be the vectors of some grapevine leafroll-associated viruses (GLRaVs). GLRaVs are recognised as the most important disease in grapevines (Jones et al., 2015), affecting vigour, yield and grape quality. This disease can only be prevented, as curative measures are non-existent. Infected vines of red cultivars show red discoloration, affecting photosynthesis rates, with an in-vineyard patchy appearance.
Botrytis cinerea is best known for causing mould on grapes, even though B. cinerea infects all green plant organs (Keller 2010b). Bunch rot, i.e. grey rot, influences the quality and quantity of grapes. Increased B. cinerea susceptibility is achieved through some cultivation practices that increase vigour, such as irrigation, excessive N fertilisation and vigorous rootstock scion combinations (Ferreira and Marais 1987).
2.3.7 Effect of variability on grape and wine quality
Wine quality can be influenced through spatial variability. Strever (2003) suggested that this can be due to external factors, such as genetic and physiological plant factors, management inputs and environmental factors. Grapevine physiology affects grape and wine quality and is affected by variability in vineyards (Rossouw, 2010), such as vigour and soil variability.
Reduced yield and berry size is achieved by deficit water conditions (Strever et al. 2012; Hunter et al. 2014). Strever et al. (2012) observed a reduction in berry mass from 140 to 160 days
after budburst and stated that the date of harvesting along with plant water status influenced berry mass. Decreased grape and wine quality is achieved by excessive leaf removal (Strever et al. 2012). Yield is reduced with early defoliation practices (Strever et al. 2012), though improving bunch compactness, berry size and the occurrence of rot (Johnson et al. 2003).
Decreased wine quality can be linked to unbalanced berry development through vineyard soil variability (Jackson, 2014b). Spatial and temporal changes in wine composition and quality are caused by variability in soil (King et al., 2014). The maintenance and management of soil nutrient status lead to increased grape and wine quality and production (Jackson, 2014b). Wine quality is associated with soil nitrogen status. Toxic ions inhibit vine growth and yield, with symptoms being initially dormant (De Clercq 1999).
The industry uses historical records along with climate and weather patterns to calculate yield. This is used in association with the samples taken in the field. This method is inaccurate as the performance of the vine along with the soil can differ each year, independent on the manipulations performed during the growing season, due to the small sample size compared to the spatial variability throughout the vineyard (Nuske et al., 2014).
Yield monitoring is critical to introduce a new approach to farming, enabling growers to monitor and observe the changes related to the variability in the vineyard. Bramley & Hamilton (2004) suggest that the implementation of an accurate yield determination method involves continuous observation of the viticultural changes that occur in the natural environment, interpretation and evaluation of the records and lastly the implementation of management to ensure the required results are obtained. This limits the impact that variation has on the determination and results in an increased accuracy of yield estimation, in the vineyard.
2.4 Assessing spatial variability using remote sensing technology
Computer systems are of great value, due to the non-contact and non-destructive techniques that are in use (Chherawala et al., 2006). Although these systems are beneficial to management practices, some problems arise with the use thereof. The risk of extracting unsatisfactory information, i.e. not enough or too much, is of great importance and therefore the research field of PV is highly active (Strever, 2003). Sawasawa (2003) stated that high quality spatial and temporal information is provided by remote sensing data.
Image analysis forms part of machine vision systems. These systems make analysis of data gathered in the field easier. Studies (Lamb 2001; Strever 2003; Matese and Di Gennaro 2015) have indicated that the use of image analysis for soil and vigour measurements should only be done at véraison and before harvest, rather than throughout the growing season. This is due to the lack of viable information generated through image analysis at early and late stages of vine canopy development (Tisseyre, Ojeda, and Taylor 2007).
2.4.1 Positioning/operational systems
Geolocation and time information are generated by a satellite-based radionavigation system (GPS), consisting of 30 satellites. The development of operational systems, such as global positioning systems (GPS) and geographical information systems (GIS), are highly pursued with the improved awareness of PV managements to improve grape quality (Strever, 2003). Sensors usually rely on Global Positioning Systems (GPS), which could present problems due to the interruption of data collection with the interference of canopies (Yandún Narváez et al., 2016).
The GPS satellite constellation generates accurate location information and in conjunction with computer-based GIS systems, generate spatial information maps (Hall et al. 2002) that enable monitoring and observation of the global environment (Unninayar and Olsen, 2008).
2.4.2 Sensors
Digital red, green and blue (RGB) images are images with three light beams, i.e. red, green and blue, that are combined in different intensities to produce the visible colour spectrum. RGB images are currently in use to determine gaps in the foliage, exposed leaf percentage and density of fruit (Rey-Caramés et al., 2015). Manzan et al. (2017) stated that RGB image segmentation produced good correlations between measured and imaged bunch weight (r2 = 0.72) and bunch
displacement (r2=0.7). This was further improved through leaf removal resulting in better
correlations between the measured and imaged vines, bunch weight (r2 = 0.89) and bunch
displacement (r2=0.89). Diago et al. (2012) found a correlation between LA and leaf pixels
(r2=0.78) using RGB images.
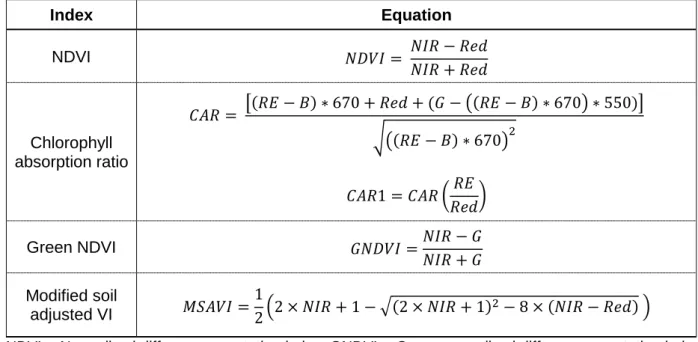
Multispectral devices use 3 to 7 spectral bands, including RGB + NIR (Usha and Singh 2013). Multispectral imaging of vineyards have been obtained by numerous producers in the South African wine industry (Strever, 2003). These images are currently limited to vineyards with uniform requirements and have been used to estimate yield with great success (Nuske et al., 2014). Usha and Singh (2013) stated that multispectral imaging can distinguish between plant species using colour patterns exhibited by the plants. Baluja et al. (2012) studied Vegetation indexes (VI) obtained from the use of multispectral indexes. Table 1 illustrates the equation for some vegetation indexes that were used in their study. VI are calculated with multispectral imaging, such as the normalised difference VI (NDVI), Chlorophyll absorption ratio (CAR), green NDVI and the modified soil adjusted VI (MSAVI).
Table 1. Equations for vegetation index derived from the multispectral images. Modified from Baluja et al. (2012). Index Equation NDVI 𝑁𝐷𝑉𝐼 = 𝑁𝐼𝑅 − 𝑅𝑒𝑑 𝑁𝐼𝑅 + 𝑅𝑒𝑑 Chlorophyll absorption ratio 𝐶𝐴𝑅 = [(𝑅𝐸 − 𝐵) ∗ 670 + 𝑅𝑒𝑑 + (𝐺 − ((𝑅𝐸 − 𝐵) ∗ 670) ∗ 550)] √((𝑅𝐸 − 𝐵) ∗ 670)2 𝐶𝐴𝑅1 = 𝐶𝐴𝑅 (𝑅𝐸 𝑅𝑒𝑑) Green NDVI 𝐺𝑁𝐷𝑉𝐼 =𝑁𝐼𝑅 − 𝐺 𝑁𝐼𝑅 + 𝐺 Modified soil adjusted VI 𝑀𝑆𝐴𝑉𝐼 = 1 2(2 × 𝑁𝐼𝑅 + 1 − √(2 × 𝑁𝐼𝑅 + 1) 2− 8 × (𝑁𝐼𝑅 − 𝑅𝑒𝑑) )
NDVI = Normalised difference vegetation index, GNDVI = Green normalised difference vegetation index, MSAVI = Modified soil adjusted vegetation index, NIR = Near infrared, CAR = Chlorophyll absorption ratio, RE = Red edge, B = Blue, G = Green,
Hyperspectral images contain narrow spectral bands by the hundreds (Usha and Singh 2013). Possibilities of using narrow bands (350 – 2500nm) such as red-edge (680 – 750 nm), instead of red and NIR bands, arise with hyperspectral sensors, eliminating the saturation effect of NIR at high LAI levels (Mutanga and Skidmore 2004) and contain more information than multispectral images. Usha and Singh (2013) stated that conventional imaging techniques combined with spectroscopy give rise to hyperspectral sensors, resulting in spatial and spectral information of the object.
Temperature images (thermograms) are created by measuring IR light emitted from an object and scanned by infrared-detectors in thermal cameras (Ding et al. 2017). Thermal images of vineyards, using drones, have proved valuable in the determination of plant water status (Baluja et al., 2012). Thermal imaging have also been used to monitor plant responses to pathogen attack (Stoll et al., 2008). Sepúlveda-Reyes et al. (2016) concluded that grapevine water status can be monitored through aerial or ground based thermal imaging measurements depending on the canopy zone and methodology.
Light distance and ranging (LiDAR) devices are used to determine canopy characteristics, such as height and width, allowing three-dimensional scanning of objects (Manzan et al. 2017). Time of flight LiDAR sensors use laser pulse technology to determine the distance between the source and the object through measuring the time for a single laser pulse from emission to reach the target and back. Phase-shift LiDAR sensors measure the difference in phase of the reflected and emitted beams (Manzan et al. 2017). Vertical outlines of objects are represented by
two-dimensional LiDAR sensors. LiDAR sensors provide highly accurate and fast measurements. LiDAR sensors have been extensively used to estimate above-ground biomass (Koch 2010). Recently, Sanz et al. (2018) compared tree row LiDAR volume with measured vine LA and found a good correlation between the measurements (r2=0.86). They found a strong correlation (r2 =
0.80) between the projected tree row surface and LA, where they found correlations between LA and the frontal projection surfaces (r2=0.85) along with the flat top projection surfaces (r2=0.61).
Synthetic aperture radar (SAR) are relatively independent of weather conditions (Koch 2010). These sensors are widely used to assess biomass and forest cover. Radar is mostly used for insect movement monitoring and can be beneficial to vineyard management practices through tracking migratory patterns of beneficial insects (Usha and Singh 2013).
Depth sensors provide depth information of the targeted object. Depth sensors integrate information from various sensors, e.g. RGB, IR depth sensor, IR emitter and microphones. Manzan et al. (2017) used Kinect (depth sensor) to estimate vine yield and obtained significant correlations (r2 = 0.85) between the measured bunch characteristics and the 3D model developed
form Kinect measurements.
2.4.3 Platforms
Remote sensing cameras are attached to drones, satellites and robots for monitoring biomass of vegetation, such as forests and agricultural crops, or climate indexes, e.g. CO2
emissions in the atmosphere and pollution. 2D LiDAR sensors are used to capture data from a points corresponding to aerial vehicles where positions are determined by GPS geo-referencing (Manzan et al. 2017). GPS and geo-referencing are done on all images, from ground scans using robots to aerial imaging.
Robots are ground based sensing devices, used for data acquisition from a vertical angle. Sensors attached to the device can be adjusted to the required specification of the trial, i.e. thermal or multispectral camera. Studies have shown good correlations between ground sensed NDVI and vegetation. Siebers et al. (2018) developed a vineyards robot, GRover, with a LiDAR scanner attachment to determine vineyard characteristics. Manzan et al. (2017) used a vineyard robot, Dassie mark II (CSIR, Pretoria, South Africa), with a LiDAR sensor attached, to determine vineyard yield obtaining a r2 of 0.68 for bunch displacement and 0.69 for bunch weight.
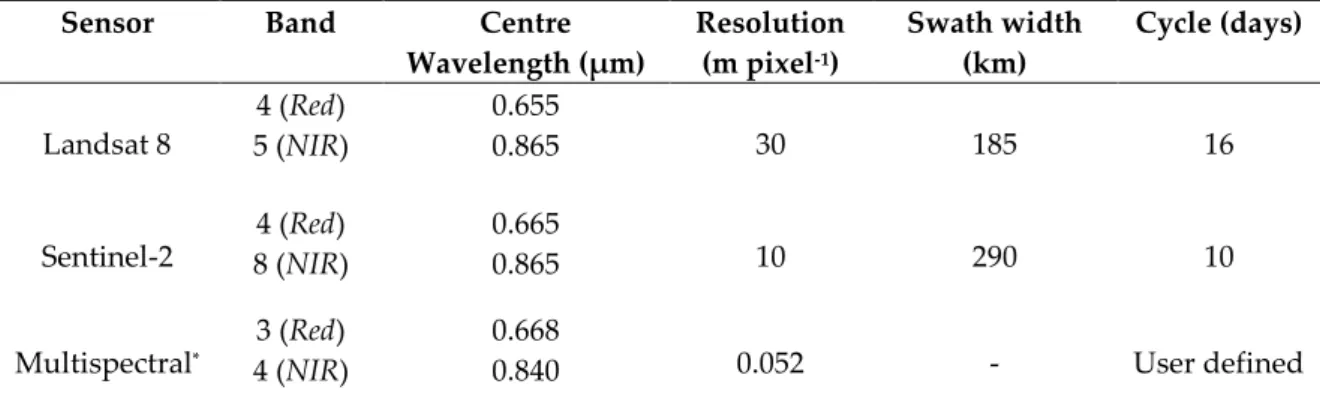
Satellite imaging provides a fast and low-cost alternative to terrestrial data acquisition. Access to global spatial information is achieved through the development of satellite imaging, creating advances in crop monitoring (Sawasawa 2003). Satellite images provide monitoring and decision support to vineyard management (Usha and Singh 2013). Nonetheless, the resolution of the satellite imaging poses a great drawback in accurate monitoring of vineyards (Table 2). This sensor method has proved valuable to some producers, due to their ability to cover large
areas (Yandún Narváez et al., 2016), regardless of the lack in resolution. Johnson et al. (2003) concluded that canopy variability was sufficiently detected using IKONOS multispectral images with a 4 m spatial resolution (decommissioned in 2015). Wu et al. (2015) stated that reconstructed time series data, incorporating several imaging satellites, achieved higher NDVI crop mapping accuracy for cotton and wheat-corn. Sawasawa (2003) stated that NDVI combined with characteristics of land and management practices, compared to only using NDVI, improves the accuracy of rice yield estimation.
Table 2. Specifications of satellites (mentioned in introduction). Sourced form Wu et al., (2015) and Barnard et al. (2018) [Chapter 3]. Sensor Band Centre Wavelength (µm) Resolution (m pixel-1) Swath width (km) Cycle (days) Landsat 8 4 (Red) 5 (NIR) 0.655 0.865 30 185 16 Sentinel-2 4 (Red) 8 (NIR) 0.665 0.865 10 290 10 MODIS 1 (Red) 2 (NIR) 0.645 0.859 250 2330 2 HJ CCD 3 (Red) 4 (NIR) 0.660 0.830 30 700 2 GF – 1 WFV 3 (Red) 4 (NIR) 0.660 0.830 16 800 4 IKONOS 3 (Red) 4 (NIR) 0.665 0.805 4 13.8 3
Drones are classified as unmanned aerial vehicles (UAVs), having autonomously flying fixed or rotary wings (Matese and Di Gennaro 2015). UAVs are extensively used in different fields of interest (Gago et al. 2015), such as military, forestry, horticulture, risk management, etc. In food services, UAVs are used to monitor the growth and health of plants, along with yield estimations (Reynolds et al. 2017; Marciniak et al. 2017). Drones can carry different cameras, such as multispectral and high-resolution RGB cameras. This allows the surveyor to adjust the camera to fit the required measurements, i.e. NIR, IR or RGB. UAVs fitted with multispectral cameras are used to determine vegetative growth through NDVI measurements (Mathews and Jensen 2013). Increased resolution, compared to satellite images, is the main advantage of UAV imaging along with the temporal acquisition of images.
2.5 Conclusions
Numerous causes of variability are present in vineyards, where only some are deemed significant. The most important causes of spatial variability arise from climate and topography, where soil and management practices account for the temporal variability in vineyards. Spatial variability can be
manipulated using management practices, such as soil, irrigation or canopy management strategies, however, temporal variability is close to impossible to manipulate, therefore the better option is to implement PV to manage spatial variations to promote economic and sustainable vineyard growth. Automated and non-destructive methods can be used to monitor, estimate and limit variability patterns that influence grapevine growth and yield. Variability is rarely accounted for in management practices. Improved methods of measuring and limiting variability are available through remote sensing technology.
Combining different remote sensing technologies, such as satellite and UAV imaging, provides large amounts of information related to plant characteristics. Algorithms selecting relevant information and reducing noise could increase the usability of these technologies. Limiting vineyard variability to promote homogenous growth and grape production is in high demand. Remote sensing technology could provide accurate selection and mapping of specified grape characteristics, such as phenolic compounds, or promote selective management practices, reducing input costs from fertilizing, sprays and irrigation. This will improve winemaking techniques though pre-determining, selective harvesting, the major phenolic compounds present in wine. The technology available for use in the vineyard is developing continuously. It will be of great value to the industry to harvest the technology available and use it to improve the current management strategies.
2.6 References
Archer, E., and Strauss, H.C., 1989. “The Effect of Plant Spacing on the Water Status of Soil and Grapevines.” South African Journal for Enology and Viticulture 10 (2): 49–58.
Baluja, J., Diago, M.P., Balda, P., Zorer, R., Meggio, F., Morales, F., and Tardaguila, J., 2012. “Assessment of Vineyard Water Status Variability by Thermal and Multispectral Imagery Using an Unmanned Aerial Vehicle (UAV).” Irrigation Science 30 (6): 511–22. https://doi.org/10.1007/s00271-012-0382-9.
Bramley, R.G.V., 2004. “Understanding Variability in Winegrape Production Systems 2. Within Vineyard Variation in Yield over Several Vintages.” Australian Journal Of Grape And Wine Research 10 (2): 32–45. https://doi.org/10.1111/j.1755-0238.2004.tb00006.x.
Bramley, R.G.V., and Hamilton, R.P., 2004. “Understanding Variability in Winegrape Production Systems 1. Within Vineyard Variation in Yield over Several Vintages.” Australian Journal Of Grape And Wine Research 10 (1): 32–45. https://doi.org/10.1111/j.1755-0238.2004.tb00006.x.
Bramley, R.G.V., Ouzman, J., and Boss, P.K., 2011. “Variation in Vine Vigour, Grape Yield and Vineyard Soils and Topography as Indicators of Variation in the Chemical Composition of Grapes, Wine and Wine Sensory Attributes.” Australian Journal of Grape and Wine Research 17 (2): 217–29. https://doi.org/10.1111/j.1755-0238.2011.00136.x.