HANDHELD AND ROBOTIC PHENOTYPER DESIGNS
by
YONG WEI
B.Eng., Shanxi Agricultural University, P.R. China, 1996 M. Eng., Shanxi Agricultural University, P.R. China, 2001
AN ABSTRACT OF A DISSERTATION
submitted in partial fulfillment of the requirements for the degree
DOCTOR OF PHILOSOPHY
Department of Biological and Agricultural Engineering College of Engineering
KANSAS STATE UNIVERSITY Manhattan, Kansas
Abstract
One of precision agriculture researches currently focuses on the relationship between plant phenotype, genotype, and ambient environment, including critical investigations of a multi-sensor-integrated phenotyping platform and data mining technology for big data. This study examined the designs of two phenotyping platforms and developed machine vision (MV) technology to estimate wheat growth status and count wheat head.
The GreenSeeker, an infrared thermometer (IRT), a web camera, and a global positioning system (GPS) receiver were integrated into one handheld phenotyping platform, named as
Phenocorn. The Phenocorn allowed simultaneous collection of the normalized difference vegetative index (NDVI) and canopy temperature (CT) with precise assignment of all
measurements to plot location by GPS data points. The Phenocorn was tested using a field trial of 10 historical and current elite wheat (Triticum aestivium) breeding lines at the International Maize and Wheat Improvement Center (CIMMYT) in Ciudad Obregon, Mexico, during the 2013 and 2014 growing seasons. Results showed that the NDVI data, PVC (percent vegetation
coverage) data, and temperature data obtained by the handheld phenocorn could availably reflect the wheat growing status in the field, and the handheld phenocorn could be used as an instrument to do plant phenotyping information collection.
This study also used the modular design method to design the mechanical structures of a robot-based phenotyping platform, named as Phenorobot. Its control system was based on a Controller Area Network (CAN bus). The basic function performances such as steering function, lifter load, and movement features were tested in the laboratory. Proposed design indicators were achieved, demonstrating its potential utilization for field experiments.
Image acquisition is one of the main data collection methods for plant phenotyping research. The method for extracting plant phenotyping traits based on MV was explored in this research. Experiments for detecting the wheat development based on the images taken in the field were designed and carried out from March to June 2015, and a method based on color analysis to estimate percent vegetation coverage (PVC) of wheat was developed. A wheat growth model based on the PVC was used for the wheat growth status analysis. In addition, a wheat head counting method was developed and divided into three steps: wheat head image
segmentation, leaf debris elimination, and wheat head counting. This paper proposes the first wheat head counting model (WCM) based on the pixels group measurement of wheat heads. Compared to the Joint Points Counting (JPC) method (Liu et al., 2014) and the Wheatear Shape Index (WSI) method (Frédéric et al., 2012), the WCM more accurately counted wheat heads from images taken in the experiments.
HANDHELD AND ROBOTIC PHENOTYPER DESIGNS
by
YONG WEI
B.Eng., Shanxi Agricultural University, P.R. China, 1996 M. Eng., Shanxi Agricultural University, P.R. China, 2001
A DISSERTATION
submitted in partial fulfillment of the requirements for the degree
DOCTOR OF PHILOSOPHY
Department of Biological and Agricultural Engineering College of Engineering
KANSAS STATE UNIVERSITY Manhattan, Kansas
2017
Approved by: Major Professor Naiqian Zhang
Copyright
YONG WEIAbstract
One of precision agriculture researches currently focuses on the relationship between plant phenotype, genotype, and ambient environment, including critical investigations of a multi-sensor-integrated phenotyping platform and data mining technology for big data. This study examined the designs of two phenotyping platforms and developed machine vision (MV) technology to estimate wheat growth status and count wheat heads.
The GreenSeeker, an infrared thermometer (IRT), and a global positioning system (GPS) receiver were integrated into one handheld phenotyping platform, named as Phenocorn. The Phenocorn allowed simultaneous collection of the normalized difference vegetative index (NDVI) and canopy temperature (CT) with precise assignment of all measurements to plot location by GPS data points. The Phenocorn was tested using a field trial of 10 historical and current elite wheat (Triticum aestivium) breeding lines at the International Maize and Wheat Improvement Center (CIMMYT) in Ciudad Obregon, Mexico, during the 2013 and 2014 growing cycles. Results showed that the NDVI data, PVC (percent vegetation coverage) data, and temperature data obtained by the handheld phenocorn could availably reflect the wheat growing status in the field, and the handheld phenocorn could be used as an instrument to do plant phenotyping information collection.
This study also used the modular design method to design the mechanical structures of a robot-based phenotyping platform, named as robotic phenotyper. Its control system was based on a Controller Area Network (CAN bus). The basic function performances such as steering
function, lifter load, and movement features were tested in the laboratory. Proposed design indicators were achieved, demonstrating its potential utilization for field experiments.
Image acquisition is one of the main data collection methods for plant phenotyping research. The method for extracting plant phenotyping traits based on MV was explored in this research. Experiments for detecting the wheat development based on the images taken in the field were designed and carried out from March to June 2015, and a method based on color analysis to estimate percent vegetation coverage (PVC) of wheat was developed. A wheat growth model based on the PVC was used for the wheat growth status analysis. In addition, a wheat head counting method was developed and divided into three steps: wheat head image
segmentation, leaf debris elimination, and wheat head counting. This paper proposes the first wheat head counting model (WCM) based on the pixels group measurement of wheat heads. Compared to the Joint Points Counting (JPC) method (Liu et al., 2014) and the Wheatear Shape Index (WSI) method (Frédéric et al., 2012), the WCM more accurately counted wheat heads from images taken in the experiments.
Table of Contents
List of Figures ... xi
List of Tables ... xv
Acknowledgements ... xvi
Chapter 1 - INTRODUCTION AND OBJECTIVES ... 1
1.1 Handheld phenotypers ... 2
1.2 Robotic phenotypers ... 3
1.3 Objectives ... 4
Chapter 2 - LITERATURE REVIEW ... 7
2.1 Phenotypic prediction model ... 7
2.2 Field-based phenotyping (FBP) platform ... 7
2.3 Robotic vehicles for agricultural applications ... 9
2.4 Potential technologies for measuring the plant leaf traits ... 11
2.4.1 3D reconstructions by lasers, stereo cameras, and time of flight cameras ... 11
2.4.2 Light curtain arrays ... 12
2.4.3 RGB imaging ... 12
Chapter 3 - DESIGN OF A HANDHELD PHENOTYPER ... 15
3.1 Introduction ... 15
3.2 Material and Methods ... 15
3.2.1 Phenocorn design ... 15
3.2.2 Phenocorn data acquisition ... 17
3.2.3 Summary of raw data and derived parameters ... 18
3.3 Results and Discussion ... 18
3.3.1 Phenotyping platform test ... 18
3.3.2 Phenocorn CT (Canopy Temperature) test ... 22
3.3.3 NDVI vs. grain yield ... 23
3.3.4 Advantages and disadvantages of phenocorn ... 24
3.3.5 Discussion about the total cost of phenocorn ... 24
Chapter 4 - ROBOTIC PHENOTYPER DESIGN ... 27
4.1 Introduction ... 27
4.2 Material and Methods ... 30
4.2.1 Chassis ... 31
4.2.2 Wheel system ... 44
4.2.3 Shade system ... 45
4.2.4 Robotic control system ... 46
4.2.5 Control system software design ... 56
4.3 Results ... 60
4.3.1 Scissors-type lifter test ... 60
4.3.2 Steering system test ... 62
4.3.3 Maintaining constant speed ... 62
4.4 Discussion ... 63
4.5 Conclusion ... 64
4.6 Future work ... 65
Chapter 5 - IMAGE PROCESSING TO DETECT WHEAT GROWTH STATUS AND COUNT WHEAT HEADS ... 66
5.1 Introduction ... 66
5.1.1 Wheat traits detection using image processing... 68
5.1.2 Image analysis algorithms for plant phenotyping ... 69
5.1.3 Objectives ... 70
5.2 Material and Methods ... 71
5.2.1 Material ... 71
5.2.2 Methodology ... 72
5.2.2.1 Extraction of vegetation coverage... 72
5.3.2.1 Wheat head image segmentation based on texture analysis ... 104
5.3.2.2 Leaf debris elimination based on color analysis ... 106
5.3.2.3 Wheatear counting methods ... 108
5.3.2.4 WCM-based algorithm test ... 110
5.4 Discussion ... 111
5.4.1 Application of PVC ... 111
5.4.2 Wheat head counting method ... 112
5.5 Future work ... 113
Chapter 6 - CONCLUSION ... 114
6.1 Conclusions ... 114
6.2 Future work ... 115
6.2.1 Future work on handheld phenocorn ... 115
6.2.2 Future work on robotic phenotyper ... 115
6.2.3 Future work on image processing algorithms ... 115
Chapter 7 - ACKNOWLEDGMENTS ... 116
References ... 117
Appendix A-Phenocorn Components and Technical Specifications ... 126
Appendix B- ... 127
Appendix C-Control system schematic ... 158
Appendix D-Control system wiring diagram ... 162
Appendix E-Control system panel ... 163
Appendix F-Control system C code ... 164
Appendix G-Matlab code of K-Means method ... 191
Appendix H-Matlab code of ME (Maximum Entropy) method ... 192
Appendix I-Matlab code of RGB-based GF (Green Feature) method ... 194
Appendix J-Matlab code of LAB-based GF (Green Feature) method ... 195
Appendix K-Wheat growth status ... 196
Appendix L-Selection of Texture Features for wheatear counting ... 200
Appendix M-Matlab Code for estimating PVC ... 204
List of Figures
Figure 3.1 Integrated hardware components of Phenocorn. ... 16
Figure 3.2 Block diagram of the Phenocorn software system (A) and its Labview control platform (B) (Crain et al., 2016). ... 17
Figure 3.3 A and B. Custom mounting bracket to hold individual sensors. C. Using the Phenocorn as a handheld platform in the field, Ciudad Obregon, Mexico (Crain et al., 2016). ... 17
Figure 3.4 Normalized NDVI distribution in the geographical space. ... 21
Figure 3.5 Normalized PVC distribution in the geographical space. ... 21
Figure 3.6 Normalized temperature distribution in the geographical space. ... 21
Figure 4.1 Robotic phenotyper block diagram. ... 30
Figure 4.2 Two kinds of robot chassis (M. Berducat, 2015). ... 31
Figure 4.3 Chassis of robotic phenotyper. ... 32
Figure 4.4 Two types of adjustable robot chassis for phenotyping (Rubens et al., 2011; Biber et al., 2012). ... 33
Figure 4.5 Scissor-type lifter in chassis. ... 33
Figure 4.6 Key component dimensions in the lifter. ... 34
Figure 4.7 Lifting process: (a) initial position, (b) change of critical driving position from pressing to pushing, and (c) final position. ... 36
Figure 4.8 (a) Partial sketch, (b) movement locus of the V-type end during lifting. ... 37
Figure 4.9 Partial sketch for calculating the critical point. ... 39
Figure 4.10 Main dimensions of the T-type bar. ... 40
Figure 4.11 Partial sketch for calculating lifting characteristics in the pressing phase. ... 40
Figure 4.12 Lifting characteristics curve of the function f1(y). ... 41
Figure 4.13 Partial sketch of the lifter for calculating the lifting characteristics in pushing phase. ... 42
Figure 4.18 Shade system on the Robotic platform. ... 46
Figure 4.19 Robotic control system. ... 47
Figure 4.20 Interlock circuits for 24V and 36V power control. ... 48
Figure 4.21 2-way interlock circuit. ... 49
Figure 4.22 Simplified circuit for calculating Vin2+. ... 50
Figure 4.23 Value interval of R0 and R4. ... 51
Figure 4.24 Wheel control module. ... 52
Figure 4.25 Wheel with hub motor. ... 52
Figure 4.26 Hall balanced car driver board. ... 53
Figure 4.27 MCP4725 ... 53
Figure 4.28 Steering control module. ... 54
Figure 4.29 Photoelectric encoder fixed on the DC motor. ... 54
Figure 4.30 Window comparator circuit for sensor A/B. ... 55
Figure 4.31 Close-loop control of steering system. ... 55
Figure 4.32 Linear actuator/ shade motor module. ... 55
Figure 4.33 CAN-BUS shield for Arduino. ... 56
Figure 4.34 Address definition according to the wheel position in the chassis. ... 57
Figure 4.35 Flowchart of the control program. ... 58
Figure 4.36 Flowchart of set parameter. ... 59
Figure 4.37 Flowchart for the encoder counter. ... 59
Figure 4.38 Platform of robotic phenotyper during testing stage. ... 60
Figure 4.39 Scissor-type lifter in the testing stage: (a) pressing stage, (b) pushing stage, (c) final position. ... 61
Figure 4.40 Steering system in the testing stage. ... 62
Figure 4.41 Constant speed trait without load. ... 63
Figure 5.1 Top ten wheat-producing countries (from http://www.mapsofworld.com). ... 66
Williams, 2006). ... 67
Figure 5.3 Experimental location ... 71
Figure 5.6 Green pixels in an image ... 74
Figure 5.7 (a) Thresholds vs Time in LAB color space, (b) Thresholds vs Time in RGB color space ... 75
Figure 5.8 (a) Image extracted from image WHF-20150317-1, (b) Image extracted from image WHF-20150410-1, (C) Image extracted from image WHF-20150608-1. ... 76
Figure 5.9 Image processing results with the MRGB method for (a) images WHF-20150317-1, (b) images WHF-20150320, and (C) image... 77
Figure 5.10 Image processing results with the OLAB method for (a) images WHF-20150317-1, (b) images WHF-20150320, and (C) image about WHF-20150323-1. ... 78
Figure 5.11 curve ( ) for the extracted image from WHF-20150323-1 ... 79
Figure 5.12 Green leaves extracted from the image WHF-20150401-1 using the MRGB method. ... 81
Figure 5.13 Image WHF-20150401-1... 81
Figure 5.14 Area of green pixels in the LAB color space. ... 82
Figure 5.15 Process of counting the green pixels, (a) curve of pixels in the LAB color space, (b) a component of pixels in the LAB color space, (c) results of , (d) results by the automated method, (e) results by manually counting. ... 83
Figure 5.16 Image after counting green pixels. ... 84
Figure 5.17 Image after filtering the background noise. ... 84
Figure 5.18 PVCs of all images. ... 86
Figure 5.19 Gray-tone wheat picture. ... 87
Figure 5.20 Computing process of the texture-color analysis method. ... 87
Figure 5.21 A portion of one wheat image. ... 92
Figure 5.22 Binary images of the corresponding grey level image. ... 93
Figure 5.23 Extracted wheatheads image ... 94
Figure 5.28 Wheatear counting results, (a) using the WSI method and (b) using the JPC method. ... 98 Figure 5.29 Wheatear counting results using the WCM (Wheatear Counting Model) method. 100 Figure 5.30 Wheat growth curves ... 102 Figure 5.31 Wheat developing speed curves ... 102 Figure 5.32 Wheats affected by leaf rust, (a) Fungici wheat, (b) U6837 wheat, (c) TRAY1 wheat, (d) TRAY9 wheat, (e) Winter wheat. ... 103 Figure 5.33 (a) Original image, (b) autocorrelation grey-level image; (c) sum variance grey-level
image under sunny weather ... 104 Figure 5.34 (a) Original image, (b) autocorrelation level image, and (c) sum variance
gray-level image under cloudy weather ... 104 Figure 5.35 Extracted wheat head images, (a) image taken under sunny weather, (b) image taken
under cloudy weather. ... 107 Figure 5.36 Wheatheads in the leaves... 112 Figure 5.37 Crowed wheatheads. ... 112
List of Tables
Table 3.1 Raw data and their applications (White et al., 2012). ... 18
Table 3.2 Data for calculating sampling frequency and frame ratio. ... 19
Table 3.3 Correlation coefficient between Phenocorn CT vs. handgun IRT (Crain et al., 2016). 22 Table 3.4 Correlation coefficient between Phenocorn CT and grain yield for vegetative and grain filling growth stages in wheat (Crain et al., 2016). ... 23
Table 3.5 Correlation coefficient between Phenocorn NDVI and grain yield for vegetative and grain filling growth stages in wheat (Crain et al., 2016)... 23
Table 3.6 Phenocorn components and their prices. ... 25
Table 4.1 Initial center position of the four hinges in the coordinate system. ... 39
Table 4.2 Movement parameters value related to the key components during lifting. ... 39
Table 4.3 Wires specification in the hub motor. ... 52
Table 4.4 Total components cost. ... 64
Table 5.1 Acronyms of the six methods. ... 75
Table 5.2 values obtained using 6 methods ... 76
Table 5.3 Results for testing criterion (5.6) ... 79
Table 5.4 Applicable thresholds from the three methods in LAB color space. ... 80
Table 5.5 Applicable thresholds from the three methods in RGB color space. ... 80
Table 5.6 PVCs of the extracted image by the nine thresholds in the bracket pairs. ... 85
Table 5.7 Applicable thresholds and methods used to calculate them. ... 85
Table 5.8 Validation of methods of extracting green pixels. ... 86
Table 5.9 Equations related to 23 texture features. ... 89
Table 5.10 . ... 101
Table 5.11 ... 101
Table 5.12 Wheat head extracting rates for various images ... 105
Acknowledgements
First of all, I want to express my heartfelt thanks to Dr. Naiqian Zhang, my supervisor, for all the time and energy he has put into training me as a student of agricultural engineering at Kansas State University. I benefited much from his critical thinking, extensive knowledge, scholarly expertise, and kind encouragement before I entered the doctoral program. However, being one of his many students in its real sense has provided me with a precious opportunity to be exposed to his unforgettable tutelage of various kinds, academic and non-academic.
My particular thanks should go to my supervisory committee: Dr. John Hatcliff, Dr. Paul Armstrong, Dr. Ajay Sharda, and Dr. Ignacio Ciampitti for their scholarly advice, meticulous style, and generous help while researching my project at Kansas State University. Thank Dr. Paul Armstrong again for his financial support to the project of designing the robotic phenotyper. I am also indebted to Dr. Jesse Poland for his financial assistance to the project of handheld phenotyper. I thank Dr. Joseph Harner, Head of the Biological and Agricultural Engineering Department, for his support and encouragement.
Moreover, I want to thank Mr. Jonathan M. Zeller for his very patient and time-consuming assistance while manufacturing the robotic phenotyper, to Dr. Jared Crain for his cooperation in the research and development of the handheld phenotyper and his hard work for testing the handheld phenotyper at the International Maize and Wheat Improvement Center (CIMMYT) at Ciudad Obregon, Mexicoand. I thank Dr. Xu Wang, and Mr. Jared Barker for their assistances and suggestions while studying at Kansas State University.I am heartily thankful to the
department staff, Ms. Barbara Moore, Mr. Randy Erickson, and Ms. Cindy Casper for helping me on all aspects of my study and research in the BAE department. I also offer my regards and
Finally yet importantly, I want to express my sincere thanks to my family, and especially, to my parents and my wife Ms. Xiaoying Guo for the support, kindness, encouragement, and understanding they have given to me for many years.
Chapter 1 -
Global demand for crop production is rapidly increasing with the growth of population, diet shifts, and biofuel consumption. It is estimated that global crop production will have to achieve a 100-110% increase to meet the projected needs by 2050 (Tilman et al., 2011). That is, global crop production should keep growing at a rate of 2.4% per year, which is a tremendous challenge. According to statistical data, the fields of top four crops - maize, rice, wheat, and soybean - are increasing at a rate of 1.6%, 1.0%, 0.9%, and 1.3% per year, respectively, all of which are lower than the required production growth rate of 2.4%. Moreover, the increasing rate of total global crop production was only 28% between 1985 and 2005, among which 20%
increase was due to the rise of crop yields per hectare (Ray et al., 2012). To meet the global food demands by 2050 while reducing the environmental impacts of agricultural expansion, the preferred solution is to boost crop yields rather than using more land (Ray et al., 2012; Tilman et al., 2011). The most effective solution to boost crop yields is to improve the breeding efficiency (Araus et al., 2014).
Phenomics is an area of biology that measures the physical and biochemical traits of organisms. It is a discipline to study the genotype-phenotype mapping, identify the genetic basis of complex traits, and explain the causation at the phenotypic level (Houle et al., 2010; Furbank and Tester, 2011). Phenotype and genotype are two fundamental concepts related to phenomics.
phenotype is all of its observable traits, which are influenced by its genotype and the environment. Phenotyping is represented by a set of tools and methodologies of studying
Accurately assessing and recording phenotypic data are essential for plant breeders, agronomists, plant physiologists, and geneticists. With the rapid advances in high-throughput genotyping technology, scientists have a tremendous opportunity to generate high-density
genomic data for crop improvement (Morrell et al., 2011). Successfully understanding genotypic data requires large amounts of phenotypic data to explore the genotype-phenotypic relationship (Campos et al., 2004; Cobb et al., 2013). However, phenotyping has been lagging behind genomic capabilities due to the lack of high-throughput technologies to access integrated phenotypes (Houle et al., 2010; Araus and Cairns, 2014). Therefore, phenotyping is often
described as the current bottleneck in research (Houle et al., 2010; White et al., 2012; Cobb et al., 2013, Myles et al., 2009, White et al., 2012). Development of accurate, high-throughput
phenotyping technology would provide tremendous potentials for discovering the complex interactions among genotype, phenotype, and environment (Breccia and Nestares, 2014).
There are two ways of characterizing phenotypes - extensive phenotyping and intensive phenotyping. Extensive phenotyping is defined as sampling a wide variety of phenotypes, and intensive phenotyping is defined as repeatedly sampling one phenotype through time. Both methods are important for phenomics (Houle et al., 2010). Multi-sensor, integrated phenotyping platforms and big data mining technologies are crucial research issues related to both extensive and intensive phenotyping.
1.1 Handheld phenotypers
manually entered or transcribed from data collection to completed analysis. In addition, each step may be performed by different individuals, further increasing the possibilities that errors or
In recent years, many high-throughput phenotyping (HTP) platforms have been developed. These included tractor-mounted platforms, platforms operated on cranes, towers similar to sports stadium cameras, and aerial vehicles. While all these platforms have a potential for use, there are also limitations associated with each of them. Tractor-mounted vehicles
require an experienced operator and could be limited by maneuverability in the field. Cranes and cable robots are limited by the amount of area that they can cover. Aerial vehicles are usually weight limited. In addition to these physical limitations, the cost for these platforms is often significant. Costs estimated by White et al. (2012) range from $100,000 USD for a tractor mounted phenotyping platform to over $1,000 USD for a one-hour drone flight.
While each phenotyping platform has its advantages, there is a current need for a highly mobile, field-based phenotyping platform that could be deployed in locations throughout the world at an affordable cost. The affordable cost will enable those working in developing countries or remote field locations to capitalize on the development in field-based HTP (Tester and Langridge, 2010). To address this type of phenotyping, a mobile platform that integrates georeferenced, simple and basic sensors to measure canopy characteristics becomes necessary. To reduce the cost and improve the maneuverability for flexible field scouting, the platform may be manually driven - carried on shouder or pushed on wheels.
1.2 Robotic phenotypers
However, characterizing large mapping populations and diversity panels of thousands of recombinant inbred lines multiple times throughout their whole growth cycle by HTPP (High Throughput Phenotyping Platform) is a hard, repetitive, and time-consuming task, especially for the operators of the HTPP. In the same time, hundreds of times of testing for a tractor-mounted phenotyping platform on the filed results in the environment impact of soil compaction.
Therefore, developing autonomous, light-weighted, driverless phenotyping robot is necessary for plant phenotyping research. Robotic phenotypers have the advantages of lighter weight, lower labor costs, fewer energy consumption, less environmental impacts, and higher measurement efficiency (Luis et al., 2014). With the help of a GPS-based auto-navigation system, a robotic phenotyper can automatically work at the field-scale, reducing unintended human error by the operator (white et al., 2012). Another advantage of robotoic phenotypers is their ability to work during night, which would double the productivity and allow plant traits that become more significant when there is no light to be detected. Although no commercial solution has become available for robotic phenotyping (Deery et al., 2014), many prototypes have been developed and will be operative in the future (Rubens et al., 2011).
1.3 Objectives
From 2012 to 2013, in the Instrumentation and Control Laboratory of the Biological and Agricultural Engineering Department at Kansas State University, we developed a tractor
mounted, field-based, high-throughput phenotyping platform for rapid, simultaneous
1. Developing a low-cost, handheld phenotyping platform to measure basic crop traits - leaf greenness and canopy temperature, and record crop images at various growth stages. The platform will be equipped with a computer-based data acquisition system that is capable of handling multiple sensors and a GPS device that allows
georeferencing of sensor data, which would provide much higher throughput than manual phenotyping. The affortable cost would allow the phenotyper to be used in less developed countries for urgently needed phenotyping to enhance their crop breeding and production.
2. Developing a robotic phenotyping platform to allow multiple sensors for fast, autonomous, high-throughput phenotyping. The robotic platform will allow autonomous or semi-atinomous phenotyping in crop fields. The adjustable width, height, and shielding of the platform will allow the platform to be used for various types of crops during their entire growth season. The light weight of the platform will reduce soil compaction, thus allowing multiple phenotyping passes. The robotic nature of the platform will allow night operations to observe certain crop traits that can be observed only during night and it would also double the productivity in
phenotyping. These features cannot be found in vehicle-driven phenotypers. Very few research on robotic phenotypers can be found in existing literature and the ones found in literature do not possess all these features. Experiences and lessens learned during the design and testing of the proposed robotic phenotyper would greatly enhance the literature in this area. The developed robotic phenotyper can be directly used to assist research in phenotyping and precision agriculture for various crops in Kansas,
3. Studying methods to extract useful phenotypic information from the sensor data. Specifically for this study, two traits that relate to wheat growth will be studied as examples --- the wheat growth trend and the total number of heads formed at maturity. A digital camera will be used as the sensor and image processing techniques will used to extract the information from the images.
Handheld, vechicle-driven, and robotic phenotypers are the basic platform types for ground-based phenotyping of field crops. A vehicle-based phenotyper has been previously developed in the BAE Instrumentation and Control Laboratory. Completions of the hand-held and robotic phenotypers will alow comparison among the three types of phenotypers. Like the vehicle-based phenotyper, the developed hand-held and robotic phenotypers will become useful tools for researchers at KSU and other institutions on field phenotyping for various field crops and under various conditions. The research on wheat traits will provide an example to other researchers on the use of the phenotypers with a typical sensor a digital camera. Once developed, the hand-held and robotic phenotypers will allow many types of sensors, including the digital camera, to conduct various phenotyping works.
Chapter 2 -
2.1 Phenotypic prediction model
Phenotypic prediction according to the genetic composition of lines is a fundamental step forward for plant science and crop improvement in the 21st century (Lorenz et al., 2011; White et al., 2012; Araus and Cairns, 2014). The ability of accurately predicting a phenotype could lead to better understanding of the genetic basis of complex traits such as yield (Cabrera Bosquet et al., 2012). Progress in breeding high-yielding crop plants for meeting the future food and fuel needs by 2050 would significantly accelerate if the prediction of phenotypic consequences of genetic makeup of an organism becomes available (Hammer et al., 2006; Furbank and Tester, 2011). Phenotypic data are considered high-dimension, s , which can be addressed with many potential models, such as partial least-squares regression, random decision forest, and support vector machines, although most genotype-phenotype mapping is inherently nonlinear (Houle et al., 2010). Rajasingh et al. (2008) proposed the concept of
causally cohesive genotype-phenotype mo , which has the quality of forcing components in a genotype-phenotype relation to cohere in a logically consistent and ordered way. However, in the standard population genetic models phenotypic data are assigned directly to genotype without involving intermediate process (Rajasingh et al., 2008; Houle et al., 2010).
2.2 Field-based phenotyping (FBP) platform
Field-based phenotyping (FBP) is an approach to deliver the requisite throughput for numbers of plants or populations, as well as an accurate description of trait expression in real-world cropping systems (White et al., 2012). The FBP platform is composed of multiple sets of
real-world conditions and with population sizes consistent with those needed for breeding programs and quantitative genetic studies (Yu et al., 2008; White et al., 2012).
Several high-throughput phenotyping (HTP) platforms, capable of generating large quantities of data quickly, have been reported at both the controlled (greenhouse and growth chamber) and field-based levels (Nagel et al., 2012; Tisné et al., 2013; Montes et al., 2011; Busemeyer et al., 2013; Andrade-Sanchez et al., 2014; Haberland et al., 2010; White and Bostelman, 2010;Albus et al., 1993; White and Bostelman, 2010; Zarco-Tejada et al., 2009; Merz and Chapman, 2011).
A tractor mounted platform developed by Monte et al. (2011) used light curtains and spectral reflectance sensors for nondestructive, high throughput phenotyping. Prashar et al. (2013) developed a mobile, in-field phenotyping platform to investigate the relationship between canopy temperature of potato and its final tuber yield. The platform included a ThermaCAM P25
infrared camera (FLIR systems with the spectral range of 7.5 13 mm, USA) and a
microbolometer detector with a spatial resolution of 320X240 pixels. Sankaran et al. (2015) developed an unmanned aerial phenotyping platform to evaluate the emergence rate and spring stand (an estimate of winter survival) of three winter wheat market classes. Allah et al. (2015) used an UAP (Unmanned Aerial Platform) equipped with a multispectral camera to assess the spatial field variability and detect low-nitrogen (low-N) stress tolerance of maize.
White et al. (2012) reviewed many of the field based systems, including tractor-mounted platforms, platforms operated on cranes, towers similar to sports stadium cameras, and aerial
2.3 Robotic vehicles for agricultural applications
Automation of agricultural machines and development of agricultural robots (smart machines) are essential for lowering production costs, increasing production efficiency,
enhancing the quality of fresh produce, and reducing the drudgery of manual labour in current and future field operations (Bakker et al., 2010; Choi et al., 2015).
Robots are of great complexity because they are comprised of several different sub-systems which are connected and correctly synchronized to execute tasks as a whole (Bechar and Vigneault, 2016). Most robots for industrial applications perform relatively simple, repetitive, well-defined, and pre-determined tasks in stable environment (Bechar and Vigneault, 2016). However, robots for agricultural applications need to have the abilities to deal with complex and highly variable environment and produce (Hiremath et al., 2014). The robotics systems used in agriculture are more sophisticated than those used in industry because they usually work with unstructured objects under unstructured environments (Bechar and Vigneault, 2016). Under such environment, autonomous robots can easily fail because of unexpected events. Thus, robotic systems used in agriculture need to be more sophisticated, making development of agricultural robots more difficult and expensive (Steinfeld, 2004).
Significant amounts of agricultural robot research worldwide have emerged in the past thirty years. Specialized sensors (Global Positioning Systems, laser-based sensors, and machine vision), actuators (hydraulic cylinder, linear or rotation electronic motor), and electronic
equipment (PLC, industrial PC, and embedded computers) have been integrated in varous agricultural robots with the aim of configuring autonomous systems to shift operator activities in agricultural tasks (Emmi et al., 2014). In the past three decades, there have been 255 published
robots, and 302 articles about (selective) harvesting robots (Bechar and Vigneault, 2016). Most of the agricultural robots have not yet been commercialized for field operation because of their production inefficiencies (Zhao et al., 2016). There are also some agricultural robots being put in practice with good performance for dedicated tasks. Examples include milking robots,
transplanting robots used in controlled environment, grafting robots, and autonomous combines and tractors (Yasushi et al., 2001; Thuilot et al., 2002; Kolbach et al., 2013).
Robotic agriculture, or utilization of robots equipped with proper agricultural tools to accomplish specific field tasks, is the developing trend of future farming (Blackmore et al., 2005; Luis et al., 2014). The development of agricultural robots has experienced an increasing interest, and many experts have been exploring the possibilities of developing more rational and
adaptable vehicles based on a behavioural approach (Pedersen et al.,2008). According to the crop production cycle, agricultural robots can be divided into three types - seedling robot, plant
protecting robot, and (selective) harvesting robot (Blackmore et al., 2005). For orchards and horticultural crops, there have been several prototypes developed, such as oranges harvesting robot, strawberries harvesting robot, tomatoes selective harvesting robot, apple harvesting robot, asparagus selective harvesting robot, weeding robot, and grafting robot (Hannan and Burks,2004; Chi & Ling, 2004; Cembali et al., 2005; Kondo et al., 2005; Zhao et al., 2011).
Crop scouting robots had the same function of collecting crop data as phenotyping robots, which have mainly assisted in weed and disease controll. For instance, Bak and Jacobsen (2004) developed an API (Accurate Positioning Interface) platform for patch spraying (Bak and
number of research has investigated robotic phenotyping platforms (Montes et al., 2011; Nagel et al., 2012; Tisné et al., 2013; Sankaran et al., 2015; Allah et al., 2015). Rubens et al. (2011) developed a phenotyping robot, and its height clearance could be manually adjusted.
Biber et al. (2012) developed an autonomous robot to perform repeated phenotyping tasks for plant breeders. Its chassis height and width are adjustable. However, because the adjustment range of the chassis height is from 0.4 to 0.8 meters, this phenotyper can only perform data collection at the early stage of crop growth. Thus, designing a flexible chassis to allow phenotyping of crops within their entire growth season is necessary.
2.4 Potential technologies for measuring the plant leaf traits
Digital-based system and sensor technologies have been used in various plant
phenotypers to allow a broad range of evaluation of complex traits, such as yield, growing period, resistance to diseases, plant architecture, and other fundamental quantitative parameters (Kumar et al., 2015). Digital RGB imaging, spectroscopy, thermography, fluorescence imaging, 3D stereo imaging and LIDAR (Light Detection and Ranging), and tomography have been tested for plant phenotyping (Großkinskyet al., 2015).
2.4.1 3D reconstructions by lasers, stereo cameras, and time of flight cameras
3D imaging systems are used to estimate biomass, canopy structures, and plant height in field experiments. In controlled environment, 3D imaging systems have been implemented to conduct detailed studies of plant morphology, such as leaf angles and surface, and overall growth rates (Großkinsky et al., 2015). Biskup et al. (2007) presented an area-based, binocular stereo system composed of commercially available components that allowed three-dimensional reconstruction of small- to medium-sized canopies on the level of single leaves under field
segmentation techniques (Biskup et al., 2007). Pengelly et al. (2010) used a 3D nondestructive imaging technique to measure the relative growth rate (RGR) of plants. Chaivivatrakul et al. (2014) proposed and demonstrated the efficacy of an automatic corn plant phenotyping system. They acquired 3D image data from a 3D time-of-flight camera integrated with a plant rotating table to form a screening station. By an experimental study with five corn plants at their early growth stage (V3), they obtained promising results with accurate 3D holographic reconstruction (Chaivivatrakul et al., 2014). Kempthorne et al. (2015) reconstructed the wheat leaf surface from three-dimensional scanned data using a parameter isolation technique.
2.4.2 Light curtain arrays
Light curtain (LC) is a recently introduced phenotyping technology. The setup consists of a pair of parallel bars, one radiating and the other receiving the emitted light. The receiving bar detects whether an object interruptes the light beams. By scanning the crop, LC arrays produce a
successfully used to assess canopy height in the field (Montes et al., 2011; Busemeyer et al. 2013). Fanourakis et al. (2014) explored the method of measuring the leaf area by LC scanning and evaluated the accuracy and applicability of LC in estimating the maximum height (from the base to the highest leaf tip) and leaf area on a phenotyping platform under controlled
environment.
2011; Großkinsky et al., 2015; Kloth et al., 2015). Bojacá et al. (2011) used a DX4530 digital camera to take field potato images to estimate canopy coverage by quantifying the percentage of pixels representing the plants within the total number of pixels in the image (Bojacá et al., 2011). Based on the RGB images, Ramfos et al. (2012) proposed a straightforward and inexpensive digital image analysis method to measure leaf area and the length of strapped-shaped seagrass leaves.
Image analysis algorithms are digital image processing techniques used to extract meaningful information from images. One website dedicated to plant biology describes 139 image analysis software tools that are manually operated, automated, or semi-automated (Plant Image Analysis, 2016). Image segmentation classifies or clusters an image into several disjointed parts by grouping the pixels to form regions of homogeneity based on pixel characteristics such as gray level, color, texture, intensity, and other features. Knowledge-based approaches such as intensity-based methods, discontinuity-based methods, similarity-based methods, clustering methods, graph-based methods, pixon-based methods, and hybrid methods can be utilized to segment an image (Khan and Ravi, 2013).
Intensity-based segmentation, or the threshold-based approach, is one of the simplest methods for segmenting an image. Images are classified based on the postulate that pixels belonging to a certain range of intensity values represent one class, and the rest of the pixels in the picture represent another class. Thresholding can be globally or locally implemented (Khan and Ravi, 2013). Wang et al. (2013) used OTSU (named after Nobuyuki Otsu) and CANNY (developed by John F. Canny in 1986) operators to segment an area of a target leaf by choosing thresholds with the mapping function, the shape identification algorithm, and pattern recognition.
identification algorithm, morphological methods, and logical operations, was designed to obtain the entire leaf edge precisely. Experiments showed that this algorithm feasibly and effectively segmented jujube leaf images from real-time video systems. Wang et al. (2013) proposed a thresholding method when they explored the relationship between rice image feature parameters and three plant indices (i.e., aboveground biomass, N content, and leaf area index). The threshold was set based on the magnitude and distribution of the green channel minus red channel values.
A geometric-optical (GO) model classified objects within an image scene into four categories: sunlit foliage, sunlit background, shaded foliage and shaded background (Fan et al., 2013). Zeng et al. (2015) proposed a new leaf area index (LAI) extraction method using sunlit foliage from downward-looking digital photography under clear-sky conditions. Using this method, an automated image classification algorithm called LAB2 extracted the sunlit foliage. A path length distribution-based method estimated the clumping index. Leveled digital images were used to quantify the leaf angle distribution (LAD) and G (leaf projection) function, and the LAI was eventually obtained by introducing a GO model that quantified the sunlit foliage
proportion (Zeng et al., 2015). Macfarlane and Ogden (2012) proposed the LAB2 method, which utilized a* and b* values of each pixel to classify green vegetation by a minimum-distance-to-means classifier, where a* and b* are parameters used in the CIE L*a*b* color space. (L* is the luminance component, a* represents color on the green-magenta axis, and b* represents color on the blue-yellow axis.).
Chapter 3 -
3.1 Introduction
In this chapter, we describe a handheld phenotyping platform developed in the Instrumenatation and Control Laboratory of the BAE Department at KSU. The phenotyper is
Phenocorn integrates spectral reflectance (Normalized Difference Vegetative Index, NDVI), canopy temperature (CT), plant video, and geo-referenced data collection. The Phenocorn was evaluated across three years of replicated trails consisting of 10 elite breeding lines of wheat (Triticum aestivum) in two countries Mexico and Bagladesh, and demonstrated the utility of this platform for rapid assessment of accurate plant phenotypes (Crain et al., 2016).
3.2 Material and Methods
3.2.1 Phenocorn design
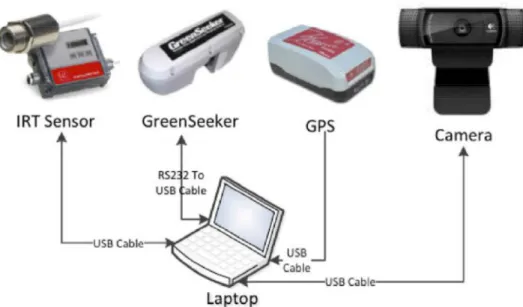
The Phenocorn integrates several pieces of hardware into one functional unit (Figure 3.1). At a basic level, the Phenocorn is comprised of an infrared thermometer (IRT) sensor to measure canopy temperature (CT), an NDVI sensor for spectral reflectance measurements, and a high-precision GPS unit to geo-reference all data. NDVI and CT were chosen as parameters to measure because of their documented relationship to yield (Amani, 1996; Babar and Reynolds, 2006; Gutierrez et al., 2010). Geo-referencing gives each sensor measurement a precise location and prevents assigning data to the wrong plot and entry. In 2014, we made an additional
modification by adding a web camera to record color images that were likewise geo-referenced. The sensors are all connected to a laptop computer serving as the main control unit for the
system. The model, technical specifications, and approximate cost for all components are listed in Appendix A.
Figure 3.1 Integrated hardware components of Phenocorn.
The system was operated through a custom-designed National Instruments LabView program. Within the program, data collection is initiated by pressing the GreenSeeker trigger and data is logged as long as the trigger is held. The software written in LabView 2012
(National Instruments, Austin, TX) had two main functions. The first function was to establish a connection with the sensors and the GPS unit and to collect the data from these devices. A separate module was built in LabView for each sensor because the connection parameters and output data for each device differ. Second, the GPS and sensors readings were processed and recorded into a useable file format. Each new set of data was written to a new line in a text file at a rate of 10 Hz, with each line having a unique index number along with sensor observation
Figure 3.2 Block diagram of the Phenocorn software system (A) and its Labview control platform (B) (Crain et al., 2016).
3.2.2 Phenocorn data acquisition
In the field each instrument (GPS, IRT, and camera) was mounted to the handheld GreenSeeker, using a custom fabricated mounting bracket. The bracket enclosed the head of the GreenSeeker sensor without blocking either the light source or the collector (Figure 3.3). All sensors were mounted so that they had a nadir field of view, and the GreenSeeker (base of the Phenocorn) was held approximately 80 cm above the crop canopy. Data were collected at a walking speed of approximately 1-2 m s-1 and were recorded from the entire experiment area, including plot borders and alleys. The Phenocorn records NDVI, CT, and GPS location at 10 Hz, and color photos were saved at 3 Hz (Crain et al., 2016).
Figure 3.3 A and B. Custom mounting bracket to hold individual sensors. C. Using the Phenocorn as a handheld platform in the field, Ciudad Obregon, Mexico (Crain et al., 2016).
3.2.3 Summary of raw data and derived parameters
As mentioned above, the handheld phenocorn was used to collect the indexes and
information related to wheat in the field, which included NDVI, CT, and wheat images. The raw data and their applications are shown in Table 3.1. Crain et al. (2016) studied the relationships of NDVI vs. wheat yield and CT vs. wheat yield respectively in 2014. The results will be
demonstrated in section 3.3.3.
Table 3.1 Raw data and their applications (White et al., 2012).
Index Instrument Target trait Applications or relevant traits Yield
NDVI GreenSeeker
Nitrogen Leaf area index Plant biomass
Plant nitrogen status especially
under stress;overall growth related
CT Thermometer Transpiration Instantaneous transpiration and
hence crop water status related
Image Camera Maturity
Multiple stages
Plant development; Leaf
orientation and size; Tracking leaf senescence;Seedling
emergence,onset of
grain-filling,senescence;Flower number; wheatheads number
related
3.3 Results and Discussion
3.3.1 Phenotyping platform test
To test the Phenocorn, an existing field trial was utilized at the International Maize and Wheat Improvement Center (CIMMYT), Ciudad Obregon, Mexico. The trial consisted of 10 genotypes selected from historical and current elite breeding lines. The plots were 10 meters long by 2.4 meters wide. Wheat was planted on raised beds with two rows per bed. The trial
by Dr. Jared Crain. Nineteen plots were measured using the handheld phenocorn, and the data files, including one text format file for storing the measured data and 19 corresponding videos, were saved in the specified folder. All values of the parameters were saved in one text file, including number of the plot, number of the set of data points, UTC-Time, longitude, latitude, NDVI, canopy temperature, and the path of video.
The data and video of the Plot1 were not used because they were only collected for testing the handheld phenocorn at the beginning of the experiment. The data and videos of the
sampling frequency is almost 9.8Hz, and the frame ratio of the videos is 1.6 frames per second, as shown in Table 3.2. For the plot2, the length of the plot was 44.7m calculated by the GPS coordinates. The total frames number was 59 (Table 3.2). If the condition was that the video could cover the whole plot by frames without overlap between the two neighboring frames, the mean width of each frame should be 0.75m during measuring with constant speed. In fact, the width of each frame was between 0.35m and 0.45m. So, the videos taken in the experiments
The conclusion through experimentation was that the laptop performance, especially the graphics performance, was limiting the frame rates.
Table 3.2 Data for calculating sampling frequency and frame ratio. Plots Starting Time* Time* End Time (s) Points Data Frames Frequency Sampling F/s
plot2 172522.4 172558.8 36.4 323 59 8.9 1.6
plot3 172602.4 172639 36.6 346 58 9.5 1.6
plot4 172642 172720.2 38.2 370 61 9.7 1.6
plot5 172724 172801 37 367 59 9.9 1.6
plot8 172927.4 173007.8 40.4 405 66 10.0 1.6 plot9 173011.8 173051.2 39.4 394 63 10.0 1.6 plot10 173054.2 173133.8 39.6 398 65 10.1 1.6 plot11 173137.6 173216 39.4 386 62 9.8 1.6 plot12 173229 173307 38 374 63 9.8 1.7 plot13 173311 173349.6 38.6 371 61 9.6 1.6 plot14 173353.2 173432.2 39 387 63 9.9 1.6 plot15 173435.8 173514.6 38.8 390 63 10.1 1.6 plot16 173517.4 173556.8 39.4 392 65 9.9 1.6 plot17 173600.8 173637.8 37 371 60 10.0 1.6 plot18 173640.6 173717.8 37.2 372 61 10.0 1.6 plot19 173721.6 173756.8 35.2 353 58 10.0 1.6 Mean 9.8 1.6 * UTC-Time, format: HHMMSS.S.
One developed Matlab program was used to process these data. The program functions included: doing image processing and estimating the percent vegetation coverage (PVC) at the corresponding GPS coordinates for 18 videos, normalizing the NDVI data, PVC data, and temperature data separately, and drawing the NDVI , PVC, and temperature distribution plots in the geographic space, as shown in Figures 3.4, 3.5, and 3.6. From Figures 3.4 and 3.5, we found that the surfaces of the 3D plots represented the wheat growing status, different status at different position, and especially the boundaries between two blocks were clearly showed in Figure 3.4. Similarly, the peaks in Figure 3.5 also represented the positions where boundaries between two blocks existed. In one word, the NDVI, PVC, and temperature data obtained by the handheld
Figure 3.4 Normalized NDVI distribution in the geographical space.
Figure 3.5 Normalized PVC distribution in the geographical space.
3.3.2 Phenocorn CT (Canopy Temperature) test
Crain et al. (2016) finished a series of experments to validate the readings of the Phenocorn CT to current instruments in 2013. They collected concurrent canopy temperatures with both the Phenocorn and a handgun IRT across five time points throughout the vegetative and grain fill growth period. As shown in Table 3.3, there was a high correlation (p<0.01) on four of the five days between instruments. The results indicated that the Phenocorn could provide reliable temperature data that was similar to current methods (Crain et al., 2016). Table 3.3 Correlation coefficient between Phenocorn CT vs. handgun IRT (Crain et al., 2016).
Date Growth Stage Phenocorn CT vs. Handgun CT
3/29/13 Vegetative -0.08
4/1/13 Vegetative 0.84***
4/4/13 Vegetative 0.52**
5/1/13 Grain Fill 0.67***
5/14/13 Grain Fill 0.74***
1)* Model significant at the 0.05 level of probability. 2)** Model significant at the 0.01 level of probability. 3)*** Model significant at the <0.001 level of probability.
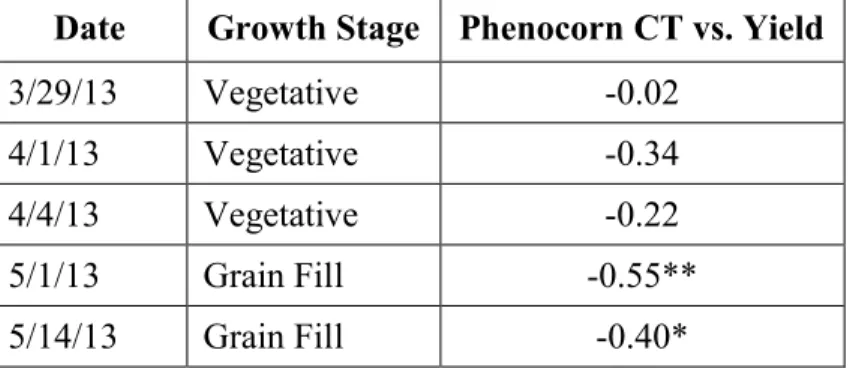
The correlation between canopy temperature and grain yield was evaluated by Crain et al. (2016) in 2013 as shown in Table 3.4. The results showed that there were significant negative correlations between canopy temperature and grain yield during grain fill, and non-significant negative correlations during the vegetative growth stages. By comparing to the results of the previous studies (Keener and Kircher, 1983; Balota et al., 2007), Crain et al. (2016) concluded
Table 3.4 Correlation coefficient between Phenocorn CT and grain yield for vegetative and grain filling growth stages in wheat (Crain et al., 2016).
Date Growth Stage Phenocorn CT vs. Yield
3/29/13 Vegetative -0.02
4/1/13 Vegetative -0.34
4/4/13 Vegetative -0.22
5/1/13 Grain Fill -0.55**
5/14/13 Grain Fill -0.40*
1)* Model significant at the 0.05 level of probability. 2)** Model significant at the 0.01 level of probability. 3)*** Model significant at the <0.001 level of probability.
3.3.3 NDVI vs. grain yield
Crain et al. (2016) also studied the relationship between NDVI and grain yield. They collected NDVI simultaneously with canopy temperature for each date of data observations. The results were shown in Table 3.5. NDVI was significantly correlated to grain yield (p<0.001) during the grain fill stages. They came to the same conclusion as other research (Babar and Reynolds, 2006) that the correlation of NDVI and grain yield increased throughout the growing season. That is, t
yield will allow researchers to make more informed selection decisions (Crain et al., 2016). Table 3.5 Correlation coefficient between Phenocorn NDVI and grain yield for vegetative and grain filling growth stages in wheat (Crain et al., 2016).
Date Growth Stage NDVI vs. Yield
3/29/13 Vegetative 0.09
4/1/13 Vegetative 0.24
4/4/13 Vegetative 0.46*
5/10/13 Grain Fill 0.65***
5/14/13 Grain Fill 0.65***
1)* Model significant at the 0.05 level of probability. 2)** Model significant at the 0.01 level of probability. 3)*** Model significant at the <0.001 level of probability.
3.3.4 Advantages and disadvantages of phenocorn
Phenocorn was designed to provide dense phenotypic data for genetic analysis and plant breeding. Some of the unique advantages in the Phenocorn are that it simultaneously collects multiple measurements including NDVI, CT, and images, but also data is geo-referenced. Geo-referencing will lead to less error in data transcription, and thus higher data integrity. The addition of image collection to the Phenocorn opens an entirely new avenue for high-throughput data collection that could add value to breeding programs. This also highlights the flexibility of the underlying software platform of the Phenocorn, which allows for modification and addition of new sensors (Crain et al., 2016). In addition, phenocorn still have the other advantages such as good for monitoring and resolution, flexible deployment, and low cost. However, because it is a kind of handheld instrument, it also has some disadvantages such as time consuming, limited with payload, and hard operation for large experiments.
3.3.5 Discussion about the total cost of phenocorn
The phenocorn was considerably less expensive than other phenotyping systems (Crain et al., 2016). The components integrated in the Phenocorn are listed in Table 3.6. The total cost of one Phenocorn is US$13,680 while high-clearance vehicle phenotyping platforms have been estimated at more than US$100,000 (White et al., 2012). A large propotion of the expense is from the SXBlue -L (US$8400), which is a high-precision differential correction GNSS with centimeter-level resolution. If the user does need high level of precision, less accurate and less expensive GNSS will be used and the total cost of the phenocorn will be reduced. In the same
Table 3.6 Phenocorn components and their prices.
3.4 Conclusions
The Phenocorn integrates two proximal sensors currently used in plant phenotyping as well as geo-referencing, which allows for a faster data collection in the field and streamlined data processing. The test results about the handheld phenocorn showed that the handheld phenocorn could be used as an instrument to do plant phenotyping information collection.
To further evaluate the Phenocorn, Crain et al. (2016) did a serial of field trials at the International Maize and Wheat Improvement Center (CIMMYT), Ciudad Obregon, Mexico. Validation of the Phenocorn shows that it performs as well as current methods for canopy temperature; additionally, NDVI and CT data from the Phenocorn were significantly correlated to grain yield. The Phenocorn is a robust, affordable platform that can be modified to fit needs and should help close the gap between genomics and phenomics.
3.5 Future work
As a first-generation system, the phenocorn has been able to simultaneously collect
Instrument Company Specifications Price
Aspire 4830 Acer Inc., San Jose, CA Windows 7, 2.4 Ghz process, 8
GB RAM, 64 bit $750
GreenSeeker Trimble, CA RS-232 to USB converter used $4,000 SXBlue -L Geneq, Montreal,
Canada
Omnistar HP for 95% accuracy
<= 10cm $8,400
CT Serial Thermometer
MicroEpsilon, NC Analog to Digital (AD) converter, Temperature resolution 0.1 °C, System accuracy: ±1 °C $430 C920 Camera Logitech HD 1080p $100 Total cost $13,680
with precise assignment of all measurements to plot location by georeferenced data points (Crain et al., 2016). However, the improved design to reduce the total cost and instrument weight according to the requirements of practice research will be the work in the future, which will promote rapid dissemination and utilization of the phenocorn in the plant breeding field.
Chapter 4 -
4.1 Introduction
The robotic phenotyper is designed for varous types of field crops, including wheat and other small grains, soybean, corn, grain sorghum, cotton, and forage crops. The average height of corn is about 2.4m. The average height of grain sorghum, soybean, wheat, cotton, and other small grain or forage crops is 1.0 1.4m. The robotic phenotyper is designed for most of the field crops. Thus, a proper chassis height needs to be determined. The height of the chassis should be the crop height plus a space for the sensors to perform properly. An example is the focal length of a digital camera. Excessive chassis height would require a large base of the phenotyper to maintain the stability, which may not be desirable. Therefore, the selected chassis height should allow field phenotyping for most interested crops except corn, for which the phenotyper can only be used during the vegetative growth stage. The minimum chassis height is limited by the drive mechanism of the robot.
In Kansas, the row spacing for most field crops is either 25.4 or 76.2 cm. To achieve high throughtput phenotyping, multiple crop rows need to be covered simultaneously. Design of the chassis width should allow simultaneous phenotyping of five rows for crops planted at 25.4 cm spacing, and two rows for those planted at 76.2 cm. Exessive chassis width not only will increase the weight of the phenotyper, thus causing soil compaction, it will also reduce the
maneuverability of the robot.
The chassis height and width need to be adjustable to allow the robotic phenotyper to work on different crops and under different conditions.
An advantage of a ground-based phenotyper over an aerial-based phenotyper is the much larger payload capability. Many sensors prohibited for aerial applications can be used on ground-based phenotypers. However, there is still a limit on the payload on a ground-ground-based phenotyper. Excessive weight mounted on the chassis of the robotic phenotyper may slow down, even stall the robot. Many sensors have been used in phenotyping and many more will be attempted in the future. These sensors have different weights. Many sensors are light in weight (below 10 kg), but some heavier sensors such as a light detection and ranging (LiDAR) sensor or a electromagnetic induction (EMI) sensor may weigh up to 20 kg. In addition, some sensors may need special mounting brackets which would further increase the weight. To provide the flexibility for sensor selection, a reasonably high payload capability that allows up to 10 sensors to be mounted is desirable.
The ground speed of the phenotyper direcly determines its throughput. Ideally, a fast ground speed is preferred. However, because each sensor has its response time, the robot should move at a speed that would allow all the sensors mounted on the robot to yield reliable
measurements at a proper sampling frequency. From the experience we obtained in developing the vehicle-based phenotyper, we learned that most sensors used on that phenotyper were able to collect stable measurement data at a sampling frequency of 10 Hz, while the GPS unit used to georefernce the measurement data could reliably update the location data at a sampling
frequency of 5 Hz (Barker et al., 2016). At a ground speed of 3.2 km/h and a sampling frequency of 10 Hz, the robot would move 0.89m each second and the spatial distance between adjacent
the spatial distance between adjacent image frames would be 3.56cm, which is also sufficnet for most image processing schemes, such as leave size measurement. A higher ground speed of the robot may result in insufficient measurement resolution and accuracy.
Optical sensors, including most image sensors, are sensitive to ambient light. Thus, it is desirable for the phenotyper to have a flexible shading mechanism. Depending on the location of the sun and the time of the day, the shading area should be adjustable, from partial shading to complete sahding so that consistent measurements can be made for most sensors.
To allow the robot to follow complicated routing in field, including headland turns, the robot must have a four-wheel drive, with each wheel controlled individually. Because the robot is completely powered by batteries, power consumption for each electric and electronic
component needs to be minimized, and the period for continuous operation of the robot needs to be sufficiently long. Finally, the robotic phenotyper must have a manual shutoff function so that when danger is present, the robot can be immediately stopped.
Based on these considerations, the following design specifications were determined: Adjustable chassis height: from 0.9 to 1.7m;
Manually adjustable chassis width: from 0.5 to 1.5m. Load capacity:80kg;
Traveling speed in field: 3.2 km/h; Adjustable shades;
Four-wheel drive and four-wheel steering with two motors per wheel system; Continuous operating period for the four hubmotors, four steering motors, other DC motors, the control system, data acquisition system, and all sensors: 6 hours;
The main design tasks include designing the mechanical structures using a modular design approach, developing a communication and control system among multiple
microcontrollers based on CAN bus, and testing basic function performances - steering, load lifting, and movement. These functions are evaluated through tests.
4.2 Material and Methods
The robotic phenotyper used a modular design approach. The modular design method typically decomposes a large system into smaller subsystems, or modules, with specific functions (You and Smith, 2016). In addition to cost reduction and design flexibility, modular design offers benefits such as flexible augmentation and exclusion. The subdivision of modules is based on the minimum interaction between modules but the maximum interaction between components
within the modules (You and Smith, 2016). Modules in the robotic phenotyper are shown in Figure 4.1.
The robotic phenotyper is designed to possess crop-sensing capacities and autonomous operations in order to achieve high-throughput data collection of crop phenotypes with
continuous operation in the field. The system consisted of five principal components: a light chassis with adjustable clearance and width, a four-wheel-drive system, a shade system, a control system, and a phenotyping sensor station.
4.2.1 Chassis
Usually, there are two basic robot chassises used in agriculture as shown in Figure 4.2. One kind of robot chassis is designed for robot easily running between two crop rows as the Rowbot system in Figure 4.2 (a), and another one for robot easily moving over the crop in the field (Figure 4.2 (b)). The designed chassis for phenotyping robot is similar to the BoniRob2, but its mechanical structure should be more flexible and its clearance height and width should be adjustable in order to meet the measuring need of covering the crop whole growth cycle.
Figure 4.2 Two kinds of robot chassis (M. Berducat, 2015). (a) Rowbot system (b) BoniRob2
As shown in Figure 4.3, the designed chassis consisted of brackets, telescopic bars, lifters, and beams. The brackets on both sides supported the robotic phenotyper, and the wheel systems, lifters, control systems, and batteries were attached to the brackets. The beams connected and secured the two sides of the chassis. The width and height of the chassis were designed to be adjustable, and the telescope bars attached to the bracket and beam stabilized the robotic
phenotyper after the lifter adjusted the beam height. As the yellow arrows show in Figure 4.2, the left side of the chassis was able to move along the beams after the beam-fastening screws were removed, and the lifter systems adjusted the height of the robotic phenotyper. The height of the robotic phenotyper was adjustable from 0.9 m to 1.7 m. Two scissors units were built into each side of the lifter; the adjustable height of each unit was 0.4 m. The number of scissors units in the lifters could be changed based on the final crop heights. The width of the chassis ranged from 0.9 m to 1.6 m.
4.2.1.1 Lifter design
There are two kinds of adjustable robot chassis reported in the literatures (Rubens et al., 2011; Biber et al., 2012). One clearance height of robot chassis is manually adjustable (Figure 4.4 (a)), and that of another one is automatically adjustable (Figure 4.4 (b)). The designed lifter with scissor-type mechanical structure in the chassis is used to adjust the clearance height with electrical linear actuator. There isn t any one literature reported about this design idea by now.
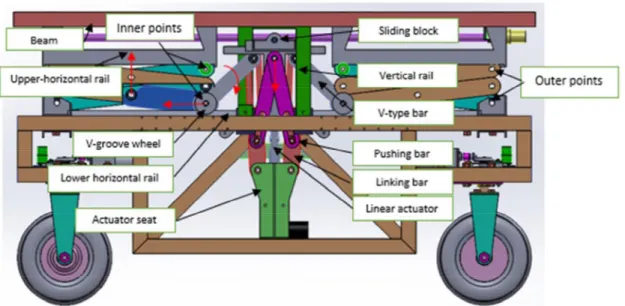
Figure 4.5 Scissor-type lifter in chassis.
Figure 4.4 Two types of adjustable robot chassis for phenotyping (Rubens et al., 2011; Biber et al., 2012).
The technical details were shown in Figure 4.5. The chassis contained a symmetrical lifter on each side of the robot. Each lifter included a linear actuator, actuator seat, linking bars, pushing bars, v-type bars, lower horizontal bars, v-groove wheels, vertical rails, sliding block, upper-horizontal rails, and beam (Figure 4.5). The two outer points at the upper and lower corners of the scissors-type parts were fixed on outer corners of the upper horizontal rail and bracket, respectively. The linear actuator drove the two inner points of the scissors-type parts moving along the upper horizontal rails and lower horizontal rails. The beam connected the two sides of the lifter in order to maintain simultaneous movement of the two sides. The red arrows in Figure 4.5 indicate movement directions of corresponding components during lifting.
4.2.1.2 T&W-type bar design
A T&W mechanism was used for the lifter design. The T&W-type michanism connected a T-type pressing part connected to the linear actuator and screwed a W-type pushing bars to the T-type part. As shown in Figure 4.5, the T&W-type driving structure is comprised of a T-type sliding block, pushing bar, and linking bar. Based on bracket dimensions and design objectives, dimensions of key components are determined and labeled in Figure 4.6. The design of this driving structure attempted to ensure that the lifting range exceeded 0.35 m per scissors unit and that the maximum lift load exceeded 40 kg per side of the robotic phenotyper. The bracket length was 1.8 m, as shown in Figure 4.6. The stroke of the 24V linear actuator was 250 millimeters, of which 200 mm was used; its maximum thrust was 2500N.
Figure 4.7 (a) shows a design sketch of the lifter, and Figure 4.7 (b) and (c) show a two-phase lifting process in which the T-type bar causes the pressing two-phase and the pushing bar causes the pushing phase, respectively. Because a smooth transition from the pressing phase to the pushing phase during lifting is essential, the design aimed to determine the moving length Dx (Figure 4.8 (a)) of the end of the V-type bar that was connected to the T-type bar so that the pushing bar was in the working position before the end of the v-type bar arrived at the end of the T-type bar, as shown in Figure 4.7 (b).
Figure 4.7 Lifting process: (a) initial position, (b) change of critical driving position from pressing to pushing, and (c) final position.
Figure 4.8 (a) Partial sketch, (b) movement locus of the V-type end during lifting.
The movement locus of the end of the V-type bar was initially calculated. As shown in Figure 4.8 (a), the initial slope angle of the right scissors bar
initial angle of the v- V-type
.
(a)