Gateshead and Newcastle
Viability and Deliverability Report
(February 2014)
ANNEX Update
April 2015
20/04/15
Contents
1.0 Viability Assumptions Review
2.0 Viability Results Update
Appendices
Appendix 1
Building Cost Information Service Data Extracts
Appendix 2
Report of Consultation Events
Appendix 3
House Values- Price Paid 2005-14
Please note the following should be read in conjunction with all Appraisal summaries in 2.0: The financial information provided in appraisals are hypothetical, high level and prepared for the purposes of setting CIL only. They are based on a set of general assumptions, quantum of development and policy requirements as contained within the Core Strategy and urban Core Plan and supporting evidence. Although appropriate to use these figures for CIL rates setting, it does not mean that they necessarily represent the form of eventual development. The residual land value represents the potential sum available to purchase current interests in the land, but no investigation has been carried out of costs required to obtain vacant possession of the site nor does it indicate the willingness of owners or occupiers to dispose of their interests. The appraisals that are summarised in this report are not formal ‘Red Book’ (RICS Valuation Professional Standards, Global and UK 2014) valuations and should not be relied upon as such.
No account has been taken of any potential title or other legal issues, nor in any further specific demolition costs over and above the abnormal costs detailed herein. It does not take into account the likelihood or otherwise of any demand at the present time for end uses. The extent of the scheme contemplated in this evidence is not defined in terms of any particular land ownerships.
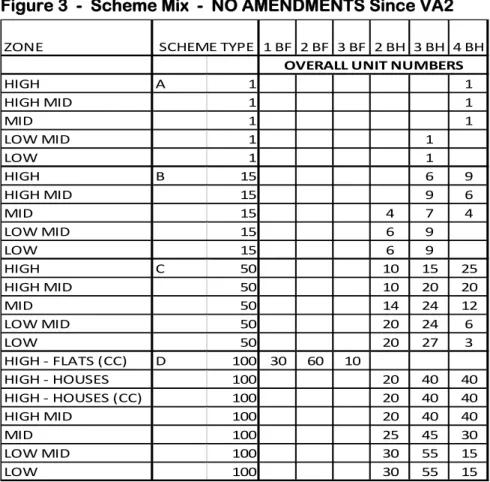
ZONE 1 BF 2 BF 3 BF 2 BH 3 BH 4 BH HIGH A 1 1 HIGH MID 1 1 MID 1 1 LOW MID 1 1 LOW 1 1 HIGH B 15 6 9 HIGH MID 15 9 6 MID 15 4 7 4 LOW MID 15 6 9 LOW 15 6 9 HIGH C 50 10 15 25 HIGH MID 50 10 20 20 MID 50 14 24 12 LOW MID 50 20 24 6 LOW 50 20 27 3 HIGH ‐ FLATS (CC) D 100 30 60 10 HIGH ‐ HOUSES 100 20 40 40 HIGH ‐ HOUSES (CC) 100 20 40 40 HIGH MID 100 20 40 40 MID 100 25 45 30 LOW MID 100 30 55 15
OVERALL UNIT NUMBERS
SCHEME TYPE
1.0 Viability Assumptions Review: Viability Appraisal Stage 3.
The following paper provides an update on any amended assumptions used in the Viability Appraisal Version 3 which forms part of the consultation document for the implementation of the Community Infrastructure Levy.
A number of scheme specific appraisals have been carried out for the allocation sites. Whilst residential mixes will vary on these schemes, the main assumptions are constant throughout the residential appraisals and are consistent with the evidence used to support the progress of the Core Strategy and Urban Core Plan.
For ease of reference the tables below indicate the chronology of changes and updates to the joint published viability assumptions underpinning the Core Strategy and Urban Core Plan and CIL methodology since 2012, the stages are as follows:
Viability Appraisal Stage 1 Report (May 2012) is referred to as VA1
Viability Assumptions Review which formed Appendix 4 of the Gateshead and Newcastle
Viability and Deliverability Report ( February 2014) is referred to as VA2
This current Viability Appraisal Stage 3 is referred to as VA3
For ease of read across the data the figure numbers have remained the same wherever possible.
- RESIDENTIAL -
Figure 3 - Scheme Mix - NO AMENDMENTS Since VA2
Figure 4.1 - Net Site Areas - VA3 AMENDMENTS SET OUT BELOW
Newcastle SLR sites all assume a 65% net: gross site area ratio as used in VA 1& 2.- NO Change
Gateshead SLR sites have been amended since VA2 as Figure 4.2 below:
SITE NAME Gross:Net
Site Area in ha Gross:Net % Dunston Hill 22.2/17.75 79 Crawcrook North 7.16/5.80 81 Crawcrook South 7.99/6.55 82 Highfield 3.18/2.45 77
High Spen West 1.65/1.452 88
High Spen East 6.3/4.41 70
Kibblesworth 13.25/8.5 64 Ryton 32.4/17.17 53 Sunniside NE 2.05/1.558 76 Sunniside SE 3.84/2.73 71 Middle Chopwell 3.79/2.88 76 South Chopwell 7.74/7.198 93
NET SITE AREAS (HA)
LOW LOW‐ MID MID HIGH‐MID HIGH
HIGH ‐CITY
CENTRE Update Note
1 UNIT SCHEME 0.03 0.03 0.04 0.04 0.04 No Change 15 UNIT SCHEME 0.30 0.30 0.33 0.33 0.33 No Change 50 UNIT SCHEME 1.20 1.20 1.25 1.25 1.25 No Change 100 UNIT SCHEME 2.50 2.50 3.00 3.00 3.00 3.00 No Change Sheltered housing
0.40 0.40 0.40 0.40 0.40 0. 40Additional Residential Use
Type
100 UNIT FLATTED SCHEME
0.25
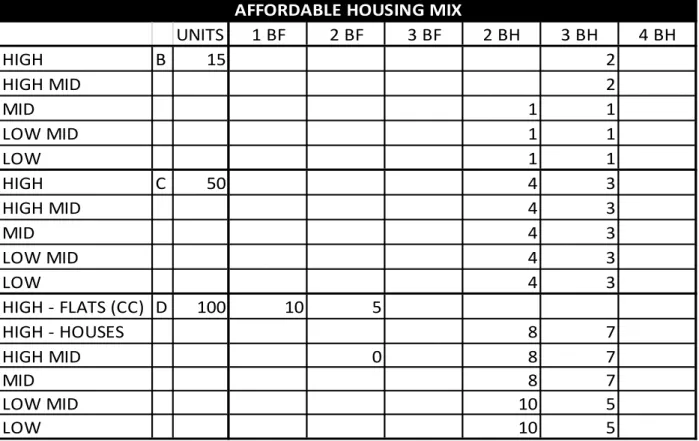
Figure 4 .3 - Affordable Housing Mix - NO AMENDMENTS since VA2
Figure 5 - Residential Unit Sizes Gross Internal Area - AMENDMENTS Since VA2
Figure 7 - Residential Values
Further investigations have been carried out to re-base values to September 2014, and in recognition of up to date Land Registry data 4Q 2014 the updates for VA3 are shown in the table below.
UNITS
1
BF
2
BF
3
BF
2
BH
3
BH
4
BH
HIGH
B
15
2
HIGH
MID
2
MID
1
1
LOW
MID
1
1
LOW
1
1
HIGH
C
50
4
3
HIGH
MID
4
3
MID
4
3
LOW
MID
4
3
LOW
4
3
HIGH
‐
FLATS
(CC) D
100
10
5
HIGH
‐
HOUSES
8
7
HIGH
MID
0
8
7
MID
8
7
LOW
MID
10
5
LOW
10
5
AFFORDABLE
HOUSING
MIX
UNIT
TYPE
VA2
AMENDED
1
bed
flat
45m2
No
change
2
bed
flat
60m2
No
change
3
bed
flat
75m2
No
change
2
bed
house
70m2
No
change
3
bed
house
84m2
No
change
Affordable housing schemes have been included at 15% to comply with Plan Policy CS 11 and have assumed a reduction in gross development value per unit of 41.25%.
In respect of sheltered housing schemes, we have following a review of evidence, added a premium to sales prices of 30%. A net to gross ratio of 70% has been adopted. Base Construction Cost of £984/m2 has been adopted.
HIGH HIGH-MID MID LOW-MID LOW Zone 1 Zone 2 Zone 3 Zone 4 Zone 5 AVERAGE RATE £/m2 2,700 2,250 1,875 1,650 1,450 Stage 2 2,500 2,100 1,800 1,425 1,200 Size (m2) 1 bed flat 45 121,500 101,250 84,375 74,250 65,250 VA2 45 112,500 94,500 81,000 64,125 54,000 2 bed flat 60 162,000 135,000 112,500 99,000 87,000 Stage 2 60 150,000 126,000 108,000 85,500 72,000 3 bed flat 75 202,500 168,750 140,625 123,750 108,750 Stage 2 75 187,500 157,500 135,000 106,875 90,000 2 bed house 70 189,000 157,500 131,250 115,500 101,500 Stage 2 70 175,000 147,000 126,000 99,750 84,000 3 bed house 84 226,800 189,000 157,500 138,600 121,800 Stage 2 84 210,000 176,400 151,200 119,700 100,800 4 bed house 121 326,700 272,250 226,875 199,650 175,450 Stage 2 121 302,500 254,100 217,800 172,425 145,200 Sales Values (£/unit)
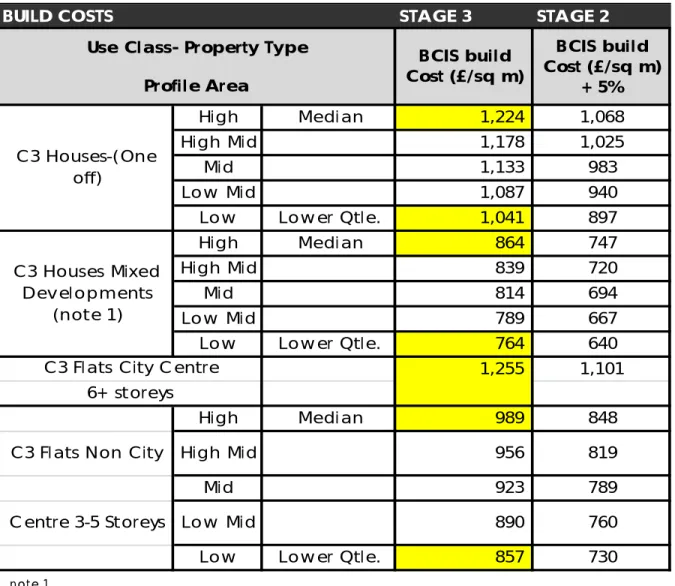
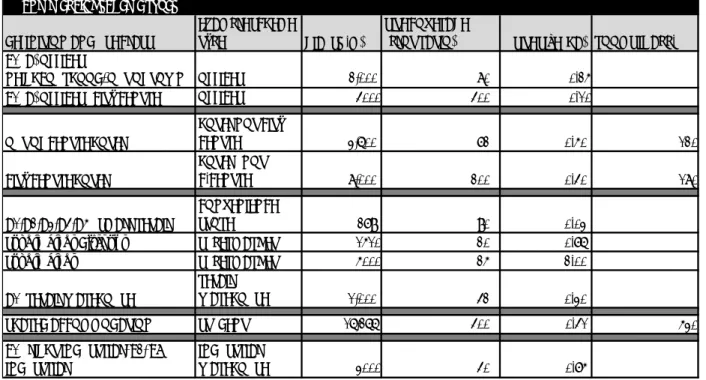
BUILD COSTS STAGE 3 STAGE 2
High Median 1,224 1,068
High Mid 1,178 1,025
Mid 1,133 983
Low Mid 1,087 940
Low Lower Qtle. 1,041 897
High Median 864 747
High Mid 839 720
Mid 814 694
Low Mid 789 667
Low Lower Qtle. 764 640 1,255
1,101
High Median 989 848
C3 Flats Non City High Mid 956 819
Mid 923 789
Centre 3-5 Storeys Low Mid 890 760
Low Lower Qtle. 857 730
Profile Area C3 Houses-(One off) C3 Houses Mixed Developments (note 1)
C3 Flats City Centre 6+ storeys
Use Class- Property Type BCIS build
Cost (£/sq m)
BCIS build Cost (£/sq m)
+ 5%
Figure 10 - Development Costs – Build Costs – Residential
These figures have been re-based to BCIS as September 2014. Gross to net floorspace
ratios have not been amended.
It is therefore proposed that this additional percentage can contain the suggested 2% uplift in cost for future proofing. See DCLG, Next steps to zero carbon homes Impact assessment – Allowable Solutions (August 2013).
note 1
We have adopted BCIS Residential "Housing Mixed Developments" (HMD) as at 1st September 2014. The table below compares this to "Estate Housing Generally" (EHG)
HMD EHG Difference
High Median 864 836 3.35%
High Mid 839 811 3.42%
Mid 814 787 3.50%
Low Mid 789 762 3.58%
Low Lower Qtle. 764
737
Figure 11 - Externals Allowance
Residential
10%. No amendment from VA2
Figure 12 - Other Costs - Residential
Item VA2 VA3 Comments
Professional Fees 10% 10%
Site Acquisition Fees – Agents 1% 1%
Site Acquisition Fees – Legal 0.75% 0.75%
Finance 6.5% 6.5%
Marketing Costs (Sales Agents
Fess) 3.0% 3.5%
Legal Fees £600/unit £600/unit
Developer Profit – Private for Sale 20% on GDV 20% on GDV Developer Profit – Affordable
Housing 6% of GDV 6% of GDV
s.106 cost – Urban Sites1 £1,000/unit £1,000/unit
s.106 cost – Non Urban Sites2 £6,000/unit £6,500/unit
Abnormals Allowance 5% 5%
Externals 10% 10% See Figure 11 above
Contingency 5% 5%
NHBC and EPC Costs £1,000/unit £1,000/unit
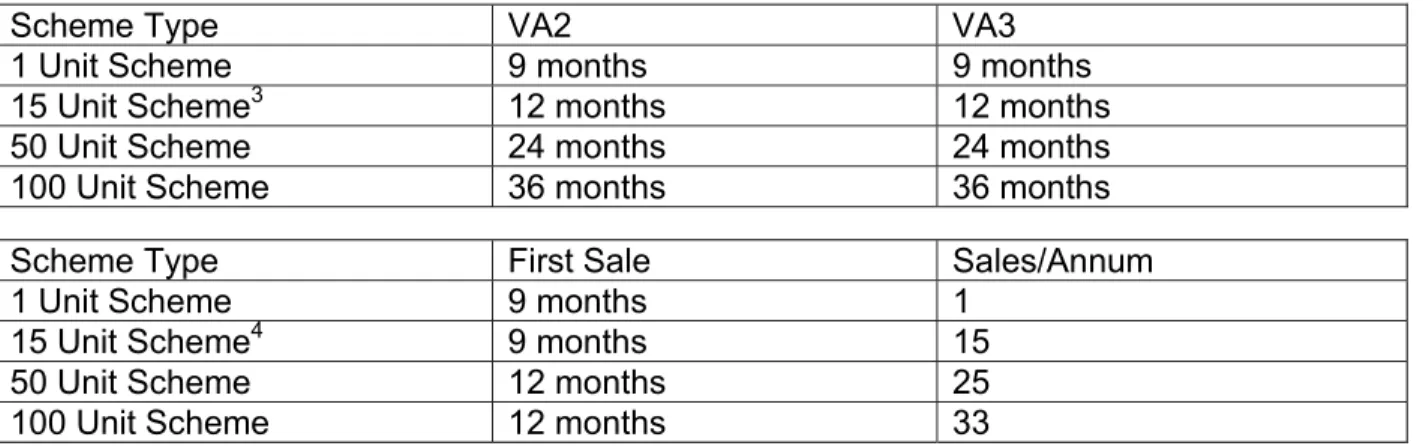
Figure 13 - Build Period and Sales Timings - Residential
No amendments
Scheme Type VA2 VA3
1 Unit Scheme 9 months 9 months
15 Unit Scheme3 12 months 12 months
50 Unit Scheme 24 months 24 months
100 Unit Scheme 36 months 36 months
Scheme Type First Sale Sales/Annum
1 Unit Scheme 9 months 1
15 Unit Scheme4 9 months 15
50 Unit Scheme 12 months 25
100 Unit Scheme 12 months 33
1 s.106 costs added in after Argus appraisals to enable comprehensive sensitivity analysis 2 S.106 costs added in after Argus appraisals to enable comprehensive sensitivity analysis 3 Amended from 25 units
4 Amended from 25 units
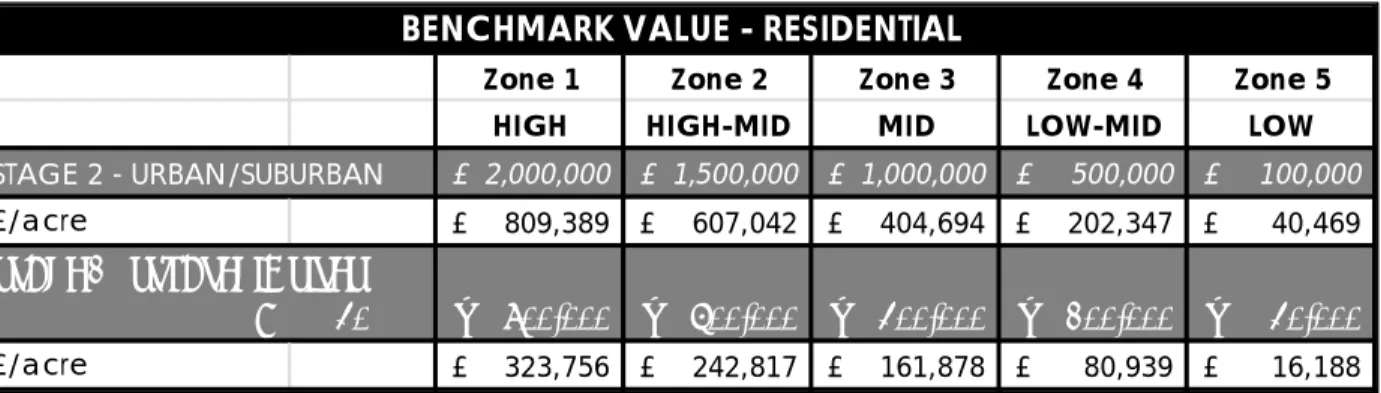
Figure 15 - Threshold Value - Residential
The establishment of a Threshold value for the non urban sites is the most challenging
aspect in the viability appraisals as it requires the valuer to estimate what a land owner would be willing to treat for in the disposal of land.
The Stage 2 (VA2) report set out the following Threshold values (Net):-
We have updated the Urban Threshold Values as follows (VA3)
(Net):-
We have reviewed the Threshold Figures against Viability reviews published in the North East. Analysis of Durham CC viability review (Local Plan & CIL Development Viability Study , October 2013) produced a table following the methodology adopted there. We have also tried to obtain evidence of transactions of such areas of land, but this is difficult to gather. This is summarised below:-
Zone 1 Zone 2 Zone 3 Zone 4 Zone 5
HIGH HIGH-MID MID LOW-MID LOW
STAGE 2 - URBAN/SUBURBAN £ 2,000,000 £ 1,500,000 £ 1,000,000 £ 500,000 £ 100,000 £/acre £ 809,389 £ 607,042 £ 404,694 £ 202,347 £ 40,469
STAGE 2 ‐ STRATEGIC SITES
@ 40% £ 800,000 £ 600,000 £ 400,000 £ 200,000 £ 40,000
£/acre £ 323,756 £ 242,817 £ 161,878 £ 80,939 £ 16,188
BENCHMARK VALUE - RESIDENTIAL
Zone 1 Zone 2 Zone 3 Zone 4 Zone 5
HIGH HIGH-MID MID LOW-MID LOW
Urban/Suburban
£/ha £ 2,100,000 £ 1,600,000 £ 1,000,000 £ 600,000 £ 200,000
BENCHMARK VALUE - RESIDENTIAL
We have also had regard to the CIL Viability Study prepared for Stockton-on-Tees Borough Council (SBC) to compare the approach taken to Threshold Values. SBC have 2 value zones – High with a sales value of £2,100/m2 and Low with a sales value of £1,725/m2. These values approximate those in the Councils’ High-Mid Zone (£2,250/m2) and a mid-point between the Councils’ Mid Zone (£1,875/m2) and Low-Mid Zone (£1,650). SBC have also adopted a sliding scale of Threshold Value to account for quantum. It is considered
appropriate to have regard to the ‘Large’ sites which in the SBC modelling are 100 units on 2.86 hectares.
For the High-Mid zone SBC has adopted a threshold value at £500,000/hectare which is 4% higher than the Council’s at £480,000 and is therefore consistent with our approach. This same figure of £500,000/hectare has been adopted by SBC for the Low area. This is some 20% higher than the figure adopted by the Councils’, but would have no significance to the outcome of the viability testing in this report or the CIL chargeable zones, as adopting a similarly higher threshold value in Gateshead and Newcastle in Mid, Low-Mid or Low value areas would reduce the headroom in areas which are already outwith the proposed CIL charging zones.
NON URBAN AREAS
Zone 1 Zone 2 Zone 3 Zone 4 Zone 5
HIGH HIGH-MID MID LOW-MID LOW
EXISTING PROPOSED see note 1 £ 840,000 £ 640,000 £ 400,000 £ 240,000 £ 80,000 DURHAM CC - TEXT see note 2 £ 250,000 £ 250,000 £ 250,000 £ 250,000 £ 250,000 DURHAM CC - TABLE see note 3 £ 360,000 £ 360,000 £ 310,000 £ 280,000 £ 280,000
PUBLIC DATA see note 4 £ 280,000
ADJUSTED IN LINE WITH SALES VALUES see note 5 £ 336,000 £ 280,000 £ 242,667 £ 217,778 £ 199,111
AVERAGE - (HIGHEST DCC +COMP) £ 350,000 £ 320,000 £ 280,000 £ 250,000 £ 240,000
ADD IN CONTINGENCY BUFFER see note 6 50% £ 530,000 £ 480,000 £ 420,000 £ 380,000 £ 360,000
Notes
note 1 Based on 40% of adjusted headroom in line with VA2 note 2 LPCIL14 PG. 25
note 3 LPCIL14 PG. 21 - ADJUSTED TO REFLECT THREE BAND AS USED BY DCC note 4 BASED ON REPORTED HMLR FIGURE - KENTON BANK FOOT, 2014 note 5 Figure in note 4, adjusted to value bands in line with sales values
note 6 The Councils recognise that care should be exercised so that viability of schemes is not compromised accordingly a margin of error of 1/2 has been applied
- COMMERCIAL -
Figure 6 - Commercial Scheme Types
Figure 8 - Rental and Capital Values for Commercial Schemes
It will be noted that the only figures reported in the Stage 2 (VA2) report were on offices. These have been amended from the following figures:-
Low - No change in rent, yield amended from 8.0% to 8.5%
Medium - No change in rent, yield amended from 8.0% to 8.5%
High - No change in rent, yield amended from 8.0% to 7.5%
COMMERCIAL SCHEME TYPES DEFINITION AND USE CLASS
EXAMPLE SCHEME
TYPE GIA (SQ.M)
SITE COVERAGE
(PLOT RATIO) SITE SIZE (HA) ROOMS IF APP. B1 (A) OFFICES ‐
NEIGHBOURHOOD/OUT OF TOWN OFFICES 2,000 80% 0.25 B1 (A) OFFICES ‐ CITY CENTRE OFFICES 4000 400% 0.10
OUT OF CENTRE HOTEL
HOTEL NOT CITY
CENTRE 3,600 72% 0.50 120
CITY CENTRE HOTEL
HOTEL ‐ NOT
C.CENTRE 8,000 200% 0.40 180
A1,A2,A3,A4,A5 ‐ SMALL RETAIL
CONVENIENCE
STORE 279 90% 0.03 Supermarket‐Discount SUPERMARKET 1510 20% 0.76 Supermarket SUPERMARKET 5000 25% 2.00
A1‐ RETAIL WAREHOUSE
RETAIL
WAREHOUSE 1,000 42% 0.30
SHARED ACCOMMODATION STUDENT 16,266 400% 0.41 530 B1 ‐ LIGHT INDUSTRIAL, B2, B8
INDUSTRIAL
INDUSTRIAL
WAREHOUSE 3000 40% 0.75
Scheme Type
Low Med High City Centre
1000m2 GIA retail warehouse 119 149 179
Yield 6.50% 6.50% 6.50%
279m2 net trading area & small scale A1-A5 units 60 88 237 645
Yield 8.50% 8.50% 7.50% 7.50%
5000m2 GIA supermarket 150 195 215 215
Yield 6.75% 6.75% 6.75% 6.75%
1510m2 gross (1125 net) convenience (discount) 130 130 130 130
Yield 6.75% 6.75% 6.75% 6.75% OFFICES 86 108 161 226 Yield 8.50% 8.50% 7.50% 7.00% B2 Industrial 35 45 60 Yield 10.00% 8.00% 7.50% HOTELS 65,000 65,000 90,000 145,000
CAPITAL VALUE PER ROOM
Student Housing 2856 3672 5916 5916
Yield 8.50% 8.50% 7.50% 7.50%
RENTAL AND CAPITAL VALUES AND YIELDS FOR COMMERCIAL SCHEMES Rental Value £/m2
City Centre - Rent amended from £215/m2 to £226/m2 and yield moved from 6.5% to 7.0%
Figure 9 - Typical Rent Free Periods
Figure 10 - Development Costs/Build Costs
Build costs have been updated to BCIS September 2014.
Figure 11 - Externals
A figure of 11.25% has been adopted across all non-residential types. This is a mean of the range previously adopted of 7.5% to 15%. This is for the purpose of continuity across the use types. Each site will have individual external works depending on individual
circumstances.
Scheme Type MONTHS
1250m2 GIA retail warehouse 9
279m2 net trading area & small scale A1-A5 units 12
5000m2 GIA supermarket 15
1510m2 gross (1125 net) convenience (discount) 12
OFFICES 10
B2 INDUSTRIAL 10
HOTELS
-SHARED ACCOMMODATION
-TYPICAL RENT FREE PERIODS
Use Class Property Type
BCIS Build Cost
(£/sq.m.) Gross to Net A1, A2, A3, A4, A5 ‐ Small Retail Convenience Store ‐ not in City Centre 731 78%
City Centre 1,133 78%
Supermarket‐Discount Supermarket 826 95%
Supermarket Supermarket 1,084 95%
A1 ‐ Shops Retail Warehouse (non‐food) 566 95%
Offices Not City Centre 1,185 85%
City Centre 1,304 80%
B1 Light Industrial B2, B8 ‐ Industrial Industrial Warehouse (Purpose Built) 471 100% Hotel Not City Centre LOWER QUARTILE 1,198 100% City Centre UPPER QUARTILE 1,657 100%
Shared Accommodation LOW/MED/HIGH 1,270 100%
CITY CENTRE 1,270 100%
Figure 12 - Development Costs – Fees, Finance and Profit (Commercial)
The above remains unchanged from VA2, save the office profit, which has been amended to 15% from 20%.
Figure 16 - Development Costs – Commercial Threshold Values
These follow the value patterns of the residential zones.
Item Description
Professional Fees 10% of build costs including planning, building regs, insurances etc Site Acquisition Fees 1.00% of purchase price - Agents Fees
0.75% of purchase price - Legal Fees 4% of purchase Price - SDLT
Finance 6.50% per annum
Finance Arrangement Fee 0.10% of cost
Marketing Costs 1.00% sales fees where applicable
0.00% advertsing fees (percentage of annual income) 10% letting fees (percentage of annual income) Legals on Lettings 5.00% percentage of annual income
Legals on Sale 0.25% percentage GDV
Developer Profit 20% on costs (save shared ACC & Offices at 15%)
s.106 0
EPC/m2 £ 0.50
Abnormals Allowance 5% on build costs
City Centre Abnormals Allowance 5% on build costs
Contingency 5% on build costs
Externals 7.50% on build costs
to 15% on build costs
DEVELOPMENT COSTS - FEES, FINANCE & PROFIT - COMMERCIAL
CITY CENTRE
HIGH MID LOW
Urban/Suburban £/ha £ 2,100,000 £ 1,000,000 £ 200,000
BENCHMARK VALUE - COMMERCIAL
Other Assumptions
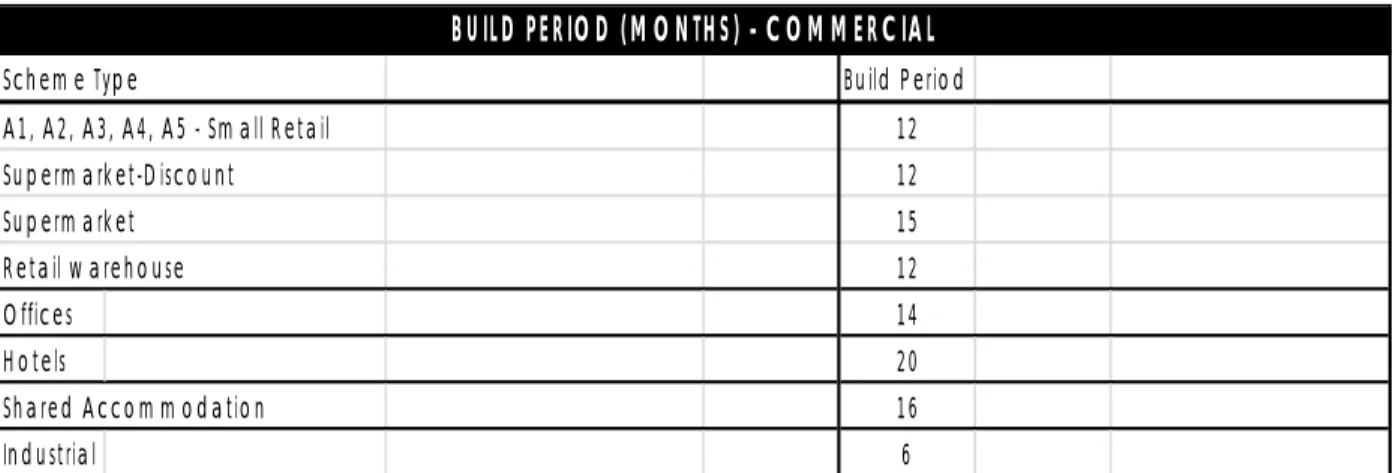
Figure 17 - Commercial Build Periods
It will be noted that Residential Institutions have been removed from the Commercial
Development Section and has been included within the residential areas.
2.0
Viability Results
Section 1.0 establishes the appropriate variables to indicate if there is sufficient ‘headroom’ to enable the payment of CIL whilst not jeopardising the viability and delivery of
development.
2.1
Residential Appraisal Results
Argus Appraisals have been carried out for each of the 5 residential value areas for 1, 15, 50 and 100 unit schemes and for a sheltered housing scheme. We have also carried out an appraisal on a 100 unit flatted scheme specifically in Newcastle City Centre. In addition to the generic schemes we have also tested the specific strategic land release sites that are contained within the Mid-High and Mid value bands.
Where there is a significant conflict between results – Generic against SLR sites we have adopted the results of the SLR sites as these have been tested as ‘real’ examples of the developments likely to come forward. Further strategic land releases would only be permitted in exceptional circumstances and given an up to date Local Plan are not
anticipated for either authority. It is important to note that all appraisals have been carried out in a necessarily high level way as no site inspections or ground investigations have taken place and no onerous legal or other constraints have been assumed. It will be noted that the appraisal have built in levels of contingency, additional abnormal contingencies and for the city centre in Newcastle a specific additional city centre abnormals contingency.
The Councils’ surveyors in establishing the land Threshold Values in the non-urban areas adopted a conservative approach. The establishment of a Threshold Value is especially difficult in the absence of transactional data from purchasers. This is because the Threshold
Scheme Type Build Period
A1, A2, A3, A4, A5 - Small Retail 12
Supermarket-Discount 12 Supermarket 15 Retail warehouse 12 Offices 14 Hotels 20 Shared Accommodation 16 Industrial 6
Value is the land value at which a landowner would be willing to treat in respect of their land holdings. Existing agricultural land value is around £15,000/hectare, so the question is with the possibility of residential development value being realised at what level did landowners ‘option’ land to purchasers. The calculus of how the Councils’ surveyors reached a
conclusion on appropriate Threshold Values is set out on page 5 above. To ensure that viability of development is not jeopardised we have then added a 50% margin of error (i.e. the Threshold value we have arrived at contains within it a 33% buffer).
The detailed results are set out below, but a schematic of the distribution of the Gross Development Value of one of the SLR sites is set out below.
A typical SLR site cost profile is indicated in the bar graph below.
Also for the SLR sites we have added in the appropriate likely specific s.106 requirements for infrastructure for a particular site, the non CIL costs varied from £2,900 to £17,000 in addition to affordable housing provision .This ensures that a realistic headroom is established. We have therefore applied more weight to the results for SLR sites.
The summary of results is as follows. This shows the Land Residual after affordable housing, generic and estimated specific infrastructure cost, the Threshold Value and consequently the Headroom. It is from the headroom that the CIL payment can sought. £32,400,000 £31,180,000 £8,040,000 £14,540,000 £78,120,000 £‐ £20,000,000 £40,000,000 £60,000,000 £80,000,000 £100,000,000 £120,000,000 £140,000,000 £160,000,000 £180,000,000 CONSTRUCTION COST FEES FINANCE PROFIT
RESIDUAL LAND VALUE KINGSTON PARK/KENTON BANK FOOT
£13,584,000 £10,441,600 £8,374,400 VIABILITY CUSHION S.106 @ £15,360 / OM UNIT BENCHMARK VALUE
High and High-Mid Area-SLR Sites
Newcastle
Gateshead
(note – all of above sites in Mid‐High Area)
CALLERTON PARK KINGSTON PARK / KENTON BANK
FOOT GREAT PARK CELL A
GREAT PARK
Extensions DINNINGTON WIDEOPEN
Site Land Residual with Affordable Housing
Land Residual with Affordable Housing
Land Residual with Affordable Housing
Land Residual with Affordable Housing
Land Residual with Affordable Housing
Land Residual with Affordable Housing A RESIDUAL VALUE 120,489,000 32,402,000 35,519,000 24,215,000 10,102,000 3,999,000 B THRESHOLD VALUE 51,840,000 13,584,000 12,576,000 9,600,000 3,264,000 2,400,000 C HEADROOM (A ‐ B) 68,649,000 18,818,000 22,943,000 14,615,000 6,838,000 1,599,000 D
S.106 PLUS EST. SPECIFIC
INFRASTRUCTURE 46,981,000 10,441,600 5,958,480 4,128,200 1,856,750 742,700 E
Headroom after s.106 for CIL (C
‐ D) 21,668,000 8,376,400 16,984,520 10,486,800 4,981,250 856,300 Dunston Hill Crawcrook North Crawcrook South
Highfield High Spen
West
High Spen
East
Kibblesworth Ryton Sunniside
NE
Sunniside
SE
LAND RESIDUAL WITH AFFORDABLE HOUSING
a Residual Value 23,307,082 5,551,878 6,732,430 3,442,941 1,813,202 5,712,090 9,602,885 23,773,298 2,141,945 3,911,904 b Threshold Value 8,728,269 2,784,002 3,143,999 1,176,000 696,961 2,417,630 4,080,000 8,241,600 747,840 1,310,400 c Headroom (a‐b) 14,578,813 2,767,876 3,588,431 2,266,941 1,116,241 3,294,460 5,522,885 15,531,698 1,394,105 2,601,504 d S106 + est specific infrastructur e 3,240,000 725,000 593,000 210,000 177,000 508,000 1,927,000 2, 100,000 146,000 271,000 e Headroom after S106 for CIL (d‐e) 11,338,813 2,042,876 2,995,431 2,056,941 939241 2786460 3,595,885 13,431,698 1,248,105 2,330,504
Generic Appraisals
For the generic appraisals, the table below shows the overall residual value, but due to the need to compare the different site typologies, this table shows the Residual Value with affordable housing and the Headroom/m2. The headroom calculation is carried out after the deduction of an allowance of £1,000 for s.106 per private unit.
Note- the ‘weighted average’ been calculated as follows:- ((15 unit scheme headroom/
m2*15)+(50 unit scheme headroom/m2*50) + (100 unit scheme headroom/m2*100))/165
Mid Area SLR Sites
Newcastle
Site
Residual
Value
with
Affordable
Housing
Headroom
per
sq
m
URBAN
Headroom
per
sq
m
NON
‐
URBAN
High Mid
1 unit scheme negative ‐537.0 ‐230
15 units 773,000 177.0 383 50 units 2,293,000 59.0 309 100 units 4,078,000 ‐96.0 224 Assisted Living 466,000 ‐70.0 ‐7 weighted average ‐24.0 265 High
1 unit scheme negative ‐702.0 ‐247
15 units 1,204,000 349.0 644
50 units 3,707,000 233.0 600
100 units 6,449,000 8.0 487
Assisted Living 1,637,000 258.0 381
weighted average (excludes 1 bed as deminimis) 107.0 536
NEWBIGGIN HALL HAZLERIGG THROCKLEY
NEWBURN
RIVERSIDE
Site Land Residual with
Affordable Housing
Land Residual with
Affordable Housing
Land Residual with
Affordable Housing
Land Residual with
Affordable Housing A RESIDUAL VALUE 7,326,000 10,329,000 13,451,000 12,229,000
B THRESHOLD VALUE 4,956,000 6,720,000 9,156,000 6,300,000 C HEADROOM (A ‐ B) 2,370,000 3,609,000 4,295,000 5,929,000 D
S.106 PLUS EST. SPECIFIC
INFRASTRUCTURE 2,754,800 2,902,400 5,163,400 3,713,500 E
Headroom after s.106 for CIL (C
Gateshead
Middle Chopwell South Chopwell
LAND RESIDUAL WITH AFFORDABLE HOUSING
a Residual Value 1,181,536 2,961,022
b Threshold Value 1,191,280 2,998,461
c Headroom (a‐b) ‐9,744 ‐37,439
d S106 + est specific infrastructure 257,000 622,000
e Headroom after S106 for CIL (d‐e) ‐257, 001 ‐622,002
There is a mixed picture for the ability of schemes in the Mid area to the extent that the Councils consider that an additional development cost could potentially have an effect on the viability and deliverability of the schemes.
2.2 Commercial Appraisal Results
We have undertaken a further set of appraisals on each of the commercial use types. These have been carried out using a bespoke spreadsheet based appraisal model. As detailed above these have used inputs considered to be valid as at September 2014.
HEADROOM/m2 (RESIDUAL MINUS BENHMARK VALUE)
LOW MEDIUM HIGH HIGH ‐ CITY CENTRE
INDUSTRIAL URBAN NIL NIL NIL N/A
NON‐URBAN NIL NIL NIL N/A
OFFICES URBAN NIL NIL NIL NEGLIGIBLE
NON‐URBAN NIL NIL NIL N/A
HOTELS URBAN NIL NIL 196NIL
NON‐URBAN NIL NIL 494N/A
SHARED URBAN NIL NIL 188 124
ACCOMMODATION NON‐URBAN NIL NIL 227N/A
RETAIL
RETAIL WAREHOUSE URBAN 280 370 182N/A
NON‐URBAN 322 580 623N/A
SUPERMARKET URBAN NIL 19NIL NIL
NON‐URBAN NIL 251 389 N/A
DISCOUNTER URBAN 59NIL NIL NIL
NON‐URBAN NIL NIL NIL N/A
SMALL RETAIL URBAN NIL NIL 370N/A
The Councils’ surveyors have, as can be seen above, undertaken separate appraisals in relation to discount supermarkets and ‘other’ supermarkets. In appraisal terms there is a rationale, as can be seen from the appraisal inputs, for undertaking this by in town and country planning terms and also in the terms of the classification by the Valuation Office Agency for Business Rates assessment. There appears to be some correlation between the discount supermarkets in lower value areas and other supermarkets in higher value areas. Also in higher value areas outside of the city centre small retail also appears to have potential headroom. On this basis of the difficulties in providing ‘splits’ based on size and more specific use, we would recommend to the LPA that a simple rate is applied to convenience retail in the charging areas.
Newcastle City Centre
We have carried out a specific detailed Argus appraisal on a notional City Centre Scheme. Throughout the appraisals for all city centre development types we have applied an
additional 5% City Centre abnormals. The specific detailed scheme has utilised, in terms of layout an example of a new 'mall' type. This produces a positive land value and consequent headroom. However, the nature of such development in the immediate city centre core, has further additional costs which include potential further business acquisition costs - sites in the immediate core are likely to be in, at least part, beneficial use, potential oversailing issues, legal restrictions on development and the like.
Therefore the Council's surveyors have stepped back to consider accuracy of identifying a reliable and cautious threshold value for mixed use city centre schemes. On balance it is our opinion that in the city centre the viability is such and the variability in costs means that there is limited scope to provide reasonable certainty as to the appropriate headroom.
The results contained on the page are as published on 01-Sep-2014
Description: Rate per m2 gross internal floor area for the building Cost including prelims. Last updated: 23-Aug-2014 12:19
Rebased to Tyne and Wear £/m2 study
Maximum age of results: Default period Building function
(Maximum age of projects)
£/m² gross internal floor area
Sample
Mean Lowest Lower quartiles Median Upper quartiles Highest
New build Purpose built warehouses/stores Generally (15) 619 190 376 470 695 2,913 47 Up to 500m2 GFA (15) 1,183 470 708 838 1,393 2,913 8 500 to 2000m2 GFA (15) 538 303 369 417 584 1,101 14 Over 2000m2 GFA (15) 484 190 372 463 548 976 25 Offices Generally (15) 1,256 525 934 1,183 1,429 3,967 203 Air-conditioned Generally (15) 1,375 525 1,093 1,273 1,501 3,967 74 1-2 storey (15) 1,176 525 918 1,167 1,265 2,351 25 3-5 storey (15) 1,415 850 1,146 1,301 1,545 3,967 39 6+ storey (15) 1,700 1,201 1,376 1,501 1,918 2,994 9 Not air-conditioned Generally (15) 1,177 598 876 1,101 1,324 2,221 87 1-2 storey (15) 1,081 598 841 1,034 1,235 2,134 47 3-5 storey (15) 1,264 647 1,008 1,245 1,361 2,221 37 6+ storey (20) 1,633 1,242 - 1,706 - 1,876 4 Retail warehouses Generally (20) 610 304 472 536 638 1,875 60 Up to 1000m2 (20) 692 466 515 586 651 1,875 11 1000 to 7000m2 GFA (20) 603 304 457 536 644 1,334 39 7000 to 15000m2 (20) 551 369 454 503 612 825 8 Over 15000m2 GFA (25) 482 369 - 474 - 604 3 Hypermarkets, supermarkets Generally (30) 1,106 184 778 1,013 1,435 1,921 62 Up to 1000m2 (25) 1,142 766 - 1,004 - 1,794 4 1000 to 7000m2 GFA (30) 1,143 184 816 1,230 1,461 1,921 50
7000 to 15000m2 (30) 798 718 739 777 845 923 7 Shops Generally (30) 867 370 554 705 997 2,884 62 1-2 storey (30) 878 370 544 699 1,114 2,884 56 3-5 storey (30) 764 608 635 746 869 977 6 Housing, mixed developments (15) 889 428 764 864 992 1,959 913 Flats (apartments) Generally (15) 1,032 508 860 993 1,163 3,110 769 1-2 storey (15) 972 576 842 948 1,089 1,869 188 3-5 storey (15) 1,017 508 857 989 1,157 2,086 509 6+ storey (15) 1,303 762 1,049 1,255 1,442 3,110 68 Sheltered housing Generally (15) 1,083 538 923 1,022 1,165 2,300 102 Single storey (15) 1,224 706 995 1,146 1,347 2,300 17 2-storey (15) 1,048 538 871 964 1,160 1,790 33 3-storey (15) 1,055 824 951 992 1,119 1,549 29 4-storey or above (15) 1,048 721 913 1,040 1,098 1,507 18 Hotels (15) 1,390 830 1,196 1,353 1,654 2,119 21
Students' residences, halls of residence, etc (15)
1,268 803 1,015 1,267 1,428 2,066 43
Building function (Maximum age of projects)
£/m² gross internal floor area
Sample
Appendix 2 - Previous Joint CIL and Viability Consultation Events
There were 2 key consultation events undertaken in 2012-13. The first was an open stakeholder and public consultation breakfast meeting organised during the PDCS CIL consultation ( 2012) and the second was a roundtable event with stakeholders organised by RICS on viability and CIL matters in 2013.
2.1 Joint Gateshead Council and Newcastle City Council Community Infrastructure Levy Breakfast Consultation Meeting (19 July 2012)
Attendance Name Organisation
Heather Markham Ward Hadaway
Peter Kay Ouseburn Trust
Sophie Evans Environment Agency
Lucy Mo Environment Agency
Neil Barker MacKellar Architecture
Stephen Jobey S·A·J Transport Consultants Ltd
Paul Whiteley S·A·J Transport Consultants Ltd
Sarah Armstrong Barratt Homes NE
Steve Willcock Taylor Wimpey NE
Caroline Mulloy Northumberland County Council
Alan Hunter English Heritage
Lee Crawford W A Fairhurst & Partners
Tom Quiqley Newcastle Citizens Advice Bureau
Cllr Nelis Blakelaw & N Fenham Parish Council
Gerry Choat Story Homes
Stephen Potts
Richard Serra Savills
Philip James Taylor Wimpey NE
Nick Graham Nathaniel Lichfield & Partners
Linzi Milley Sunderland Council
Joe Ridgeon George F. White
Phil Toal Keepmoat
Gillian Roll NELEP
Andrea King South Tyneside
Gill Telford-Cooke South Tyneside
Neil Smith Ward Hadaway
Tom Collins Signet Planning
John Urquhart Save Gosforth Wildlife
Jane Wallis Gentoo Homes
Emma Bond Gentoo Homes
Chris Checkley Checkley Planning
Robin Atkin Ward Hadaway
Jon Clapham Department for Work and Pensions
Trevor Thurlow Northumbria University
Questions and Answers
Question Answer John Urquhart – Save Gosforth WildlifeIf you propose that CIL contributions will be
£1000 per property and the levy will be
£88 per Sq/m then how do those figures tally? What is the effect on the resulting profits? In regards to sewage problems in Newcastle what percentage of the levy will go towards a new sewerage
system?
Any problems with surface water and sewage will normally be met by the developers. CIL is intended for the added extras,
for example, new schools, health centres, roads, etc.
The figure of £1000 quoted in the presentation refers to the historic average amount of S106 contributed per property in our higher value areas.
Richard Serra -
Savills In relation to retail, there are different charging zones for
convenience and
comparison, are you sure this is sound following recent decision in Poole, Dorset?
Regulation 13 in CIL states that you can set different rates by use and area based on viability.
Richard Serra -
Savills In areas such as Manchester they have decided not to
charge CIL on commercial land, could CIL impact on potential development here?
Within the Viability Report, appraisals were undertaken that could be compared against historic values, and potential changes to values in the future. Therefore, these rates should not put us at a disadvantage when it comes to future development.
Steve Willcock –
Taylor Wimpey In residential areas properties in Zone B have
higher values than those in Zone A
but the charges are the opposite way round.
There is a lower rate in Zone B as it covers established residential areas and hence land for residential development will have a higher benchmark value than land in unestablished areas
This seems like an anomaly. There are some areas in Zone A are good but not all
are. The Zone A figure of £9000 per plot and
£110000 per acre is a big chunk. Will land owners accept this?
- the Viability Report details this. It is a necessarily broadbrush approach that can’t take every site issue into account - we need to strike the correct balance in respect of viability. The viability appraisals indicate that there is sufficient head room in Zone A to enable the absorption of these extra costs. The Viability Report details this
Sophie Evans – Environment Agency
Which projects will the CIL revenues be used for? Other Councils have looked at infrastructure needs first before looking at viability, you have looked at it the other way round.
CIL won’t pay for everything, the Infrastructure Delivery Plan will identify key projects for the CIL revenues. There will be a balance struck between collecting CIL and attracting development. We are not working out the cost of potential projects and basing the CIL charges based on those figures.
Neil Barker – MacKellar Architecture
Outside of Zones 1&2 there will be no CIL charges, so will Section 106’s be increased in these areas to compensate?
The Section 106 regulations mitigate against the impact of development, and can still be negotiated on an individual basis. The regulations will stay the same and not be increased to
compensate. Gerry Choat –
Story Homes When will the CIL revenues be collected? The timeframes and details for collecting CIL are all detailed in the
draft developers guide. We are proposing that CIL will be paid in instalments.
2.2 RICS Roundtable Event on Viability in Newcastle Gateshead (3 June 2013)
Event Organiser: RICS Policy Manager - Geoff White Chair – David Furniss- BNP Paribas
Aims for the event
1. To make the most of collective knowledge
2. To provide strategic advice on the viability assumptions developed by NewcastleGateshead.
3. To reach consensus on residential and commercial viability assumptions. 4. Open and honest discussion, informed by appropriate evidence.
5. To reach a cross section of surveyors and representatives of lenders, small and large scale developers, land owners and investors.
Timescales
The conclusions of the roundtable will inform the drafting of the Newcastle Gateshead Viability Assessment (stage 2), supporting technical evidence underpinning the joint Core Strategy and Urban Core Plan (Local Plan) and the Community Infrastructure Levy (CIL) Draft Charging schedules for both authorities.
Attendance:
Chair David Furniss, BNP Paribas
Stephen Litherland (Bellway); Steve Wilcock (Taylor Wimpey), Nick Graham (NLP), Chris Harrison (NLP), Neil Milburn (Barratts), Adrian Hicks (Muckle LLP), Adam Surfontein (Hanro), Rebecca Howe (Saville), Greg Davidson (Knight Frank), Phil Barnes (NLP), James Platts (Knight Frank), Bill Naylor, Geoff White (RICS NE), Neil Wilkinson (Gateshead Council), Andrew Sloan (Gateshead Council), Paul Scaplehorn (Newcastle City Council), Kathy Verlander (Newcastle City Council), Paul Scaplehorn outlined the residual valuation methodology adopted in the development Newcastle City Council’s Viability Model , and as used by both Gateshead and Newcastle Councils.
Points of Discussion on Viability Assumptions
There was a general discussion on the proposed approach to be taken by the authorities in setting CIL rates and the following comments were raised:
A) Clarification that the Local Plan (LP) strategy would be realistic, with growth related infrastructure needs planned and costed rather than a strategy developed to pay for current strategic infrastructure needs was sought. CIL rates should not be set at rates where development is stymied.
It was indicated that CIL rates were to be set in accordance with CIL legislation and guidance, thus ensuring that developers contribute to the mitigation of the impact of development on strategic infrastructure whilst not adversely affecting the economic viability of development overall.
The Councils’ have followed the Harman approach in setting a viability’
cushion’ or buffer so as not to set a CIL rate at the margin of viability. B) It was also indicated that viability assumptions varies from site to site so that
setting general assumptions was quite difficult.
C) It was acknowledged that engagement forums such as this could be really
powerful. In Leeds it was alleged that commercial engagement through a property forum contributed the evidence that led the City council to reduce its proposed office rate from £90 to £40 p.m.
It was accepted that CIL would be challenging, however, varying rates could be justified for instances, such as, varying valuation by geography.
D) The approach taken by the authorities is to aim to in general not charge CIL at a rate higher than current S106 pooled contributions. However, they are 2 different mechanisms and they are applied differently.
Residential Values
1. There was a discussion between stakeholders with no overall consensus of opinion on how best to set valuation for CIL purposes.
2. Reference was made to a recent appeal decision in Reading (no reference
provided) and cautioned against setting geographic profile areas where this would stifle higher value residential schemes coming forward in lower value profile areas.
However, it was indicated that CIL would not prejudice such a high value
scheme coming forward as any CIL rate in a low profile area would tend to be low or zero.
3. Another stakeholder indicated he was preparing some evidence ion revenues to send to the Councils shortly.
Residential Threshold/Benchmark Values
1. 2 stakeholders queried the difference between urban and greenfield threshold values. With the urban threshold values considerably higher than the greenfield sites
It was acknowledged that the infrastructure costs for the development of a
greenfield strategic site was capable of being higher than a site in the urban area served by existing infrastructure.
2. The lack of transaction comparables evidence in Newcastle was accepted as a hindrance in setting realistic threshold values.
3. One suggestion was to use £242/ac. (£600,000/ha.) for High Mid greenfield sites before tax for net site area. Another indicated the value should be nearer to the corresponding urban threshold for the profile area. And a further stakeholder thought £800,000/ha. would be about right.
Paul Scaplehorn displayed a graph illustrating % GDV costs for a notional
residential scheme for a strategic greenfield site. The graph would be used in the forthcoming Council Viability report. It was thought to be about right.
Commercial Assumptions
1. There was a general discussion regarding the Councils’’ request for any further up to date comparables that stakeholders could provide to ensure assumptions are realistic.
It was considered by a number of individuals that the data was out of date. For instance there was a discussion on the average void period for offices. One suggestion was 3 years another 45 months (on a 10 year period).
A stakeholder indicated offices were roughly 50:50 speculative/prelet currently. Typically at 18 mth. letting void and 30 month incentive on a 10 year lease. Rentals and Yields for Commercial Schemes
1. A stakeholder indicated that office rentals were recently £10 at Baltic Park and £15 at Baltic Place (Gateshead). This could be converted to £107- 161/sq. m.
Build Costs Data
1. There was a general agreement that BCIS was the correct data source to use. 2. However, one stakeholder was concerned that the residential costs would be too
low. It was indicated that BCIS is measure of cost above the DPC only and if costs are too low externals allowance could also be too low. He had indicated an all in one cost of £140 p sqm in his representations to Durham County Council
previously.
3. A further stakeholder indicated warehouse costs were too low.
Next Steps
The Chair suggested and this was greed that:
- On residential schemes as stakeholders were already providing responses to the Council they continue to do so.
- On commercial office & retail schemes, as Leeds stakeholders were able to influence a change in CIL rates- should local stakeholders be prepared to undertake some work to provide a consensus view from commercial property
sector to the Councils this would be beneficial. This could be through the existing G9 and Developing Consensus Fora.
- The Chair offered to co-ordinate further focused sessions on commercial uses (retail and office) either with the Councils or feeding back to the Councils, if there was interest to do so.
- Paul Scaplehorn agreed to provide a pack of commercial data for the commercial property groups to consider.
Note to Reader- The Councils’ would still welcome the input of the commercial stakeholders to help review the current PDCS documents and evidence.
Appendix 3 - House Values- Price Paid Data
3.1 Newcastle City Council3.1.1 Newcastle City wide– Land Registry Price Paid Data 2007-14
Average of price
paid Column Labels
Row Labels Detached Flat
Semi detached Terrace Grand Total 2007 £326,999 £139,916 £168,526 £170,390 £170,250 2008 £357,663 £142,645 £175,408 £169,544 £177,217 2009 £310,074 £128,762 £167,118 £159,253 £168,954 2010 £299,722 £125,648 £180,288 £168,436 £172,857 2011 £294,773 £118,857 £160,600 £160,286 £163,619 2012 £293,490 £116,397 £170,871 £158,742 £168,023 2013 £281,030 £119,494 £167,509 £163,663 £169,517 2014 £302,925 £120,121 £181,443 £171,115 £174,320 Grand Total £307,200 £129,218 £171,472 £165,965 £170,742
3.1.2 Newcastle Number of House Sales by Type 2007-14
0 500 1,000 1,500 2,000 2,500 2007 2008 2009 2010 2011 2012 2013 2014 Detached Flat Semi detached Terrace
3.1.3 Newcastle Average House Prices by Type 2007-14
3.2 Gateshead Council
3.2.1 Gateshead– Land Registry Price Paid Data 2007-14
2007 2008 2009 2010 2011 2012 2013 2014 Detached £214,112 £228,008 £199,143 £189,668 £211,840 £209,872 £209,372 £239,710 Flat £101,830 £96,715 £93,166 £91,058 £85,587 £91,726 £90,859 £95,992 Semi £143,194 £135,122 £131,475 £131,849 £126,349 £128,401 £135,044 £145,313 Terrace £130,840 £123,718 £123,291 £124,418 £117,253 £125,499 £132,696 £128,212 £0 £50,000 £100,000 £150,000 £200,000 £250,000 £300,000 £350,000 £400,000 2007 2008 2009 2010 2011 2012 2013 2014 Detached Flat Semi detached Terrace
3.2.2 Gateshead Average House Prices by Type 2007-14 £0 £50,000 £100,000 £150,000 £200,000 £250,000 £300,000 2007 2008 2009 2010 2011 2012 2013 2014
Gateshead
House
Prices
by
Type
Detached Flat Semi Terrace