Equity Valuation
Cofina, SGPS
Gonçalo Guimarães
Nº 152108208
Advisor:
Prof. José Carlos Tudela Martins
Dissertation submitted in partial fulfillment of requirements for the degree of MSc in Business Administration, at the Universidade Católica Portuguesa, March 2014
Catolica Lisbon School 2
A
BSTRACT
Equity valuation has been highly debated among academics and practitioners. There are many approaches and choosing the right one can be a challenge, making valuation to be considered more an art than a science. This dissertation aims to obtain the price target of Cofina, a Portuguese leading company in media sector. To achieve this goal we had to understand how equity valuation can be conducted and search the best approach to value Cofina. By discussing the main valuation literature and Cofina’s characteristics, we chose to apply the Discount Cash-Flow method, using Adjusted Present Value approach. A relative valuation was also performed which revealed to be useful as a complement of the DCF valuation. Our results were compared to Caixa BI Investment Banking. Different methods and assumptions were used but quite similar results were obtained. While we reached a final price target of 0.78€, Caixa BI set a price target of 0.70€. Consequently, we recommend investors to buy. With this valuation we can conclude that Cofina’s shares are undervalued and trading at a discount, since they were listed in 0.62€ in 31st January of 2014.
Keywords: valuation, adjusted present value, enterprise value, price target, Cofina, media segment.
Catolica Lisbon School 3
A
CKNOWLEDGMENTS
During the path of writing a dissertation it seems like individual journey, although it is not possible without the support and feedback from others. For these reason I would like to thank all the support and comments from Professor José Tudela Martins, to Helena Barbosa and Guido Santos from Caixa BI, and other colleagues how helped me during the process.
Finally, I would like to give special thank to Nadine Côrte-Real from giving me motivation and encouragement whenever I needed. I will also like to thank to my family and friends from the support received.
Catolica Lisbon School 4
T
ABLE OF CONTENTS
Abstract ... 2 Acknowledgments ... 3 Table of contents ... 4 1. Introduction ... 6 2. Literature review ... 8 2.1. Valuation ... 8 2.2. Valuation Methods ... 9 2.3. Relative Valuation ... 112.4. Discounted cash flow approach ... 12
2.4.1. Free Cash Flow to the Firm... 13
2.4.2. Adjusted Present Value ... 14
2.4.3. Cost of capital estimation ... 16
2.4.3.1. Cost of equity ... 16 2.4.3.2. Cost of debt ... 17 3. Industry analysis ... 18 3.1. Macroeconomic environment ... 18 3.2. Media industry ... 19 3.2.1. Global Market ... 19 3.2.2. Portuguese Market ... 22
3.2.3. Challenges and opportunities for the future ... 24
4. Company analysis ... 25
4.1. Cofina overview ... 25
4.1.1. Cofina Group’s structure ... 27
4.1.2. History ... 27
4.1.3. Strategy ... 28
4.2. Performance in the stock market ... 28
5. Valuation methodology ... 29
6. Valuation assumptions ... 30
6.1. Operating revenues ... 30
6.1.1. Circulation ... 32
6.1.2. Advertising... 32
Catolica Lisbon School 5
6.2. Operating Expenses ... 33
6.3. Capital expenditures and depreciation ... 35
6.4. Net Working Capital ... 35
6.5. Dividends distribution ... 37
6.6. Debt ... 37
6.7. Income tax ... 40
7. Valuation results ... 40
7.1. Unlevered value ... 40
7.2. Debt financing side effects ... 41
7.2.1. Tax Shields ... 41
7.2.2. Cost of financial distress ... 42
7.3. Terminal Value ... 42
7.4. Price Target ... 43
7.5. Sensitivity Analysis ... 44
8. Relative valuation ... 45
9. Valuation comparison with Caixa BI report ... 46
10. Conclusion ... 49 Appendices ... 51 List of Figures ... 62 List of Graphics ... 62 List of Tables ... 62 References ... 63
Catolica Lisbon School 6
1.
I
NTRODUCTION
The recent financial crisis caused tremendous impacts on Portuguese stock index. Particularly, Cofina as one of the leading media groups in Portugal, listed on PSI 20 was affected. In the last years, with the economic recovering, Cofina is assisting to a turn over period and trying to optimize functional structures and control costs to reinforce the profitability of the existent assets.
Valuation is considered an important issue for strategic decisions in a company and to provide correct advises to investors. The motivation to select this company as an object study is threefold. The ability of the company to overcome economical difficulties due to financial crises is the primary reason. Also, being in the era of information, the media sector has a crucial role in society that we live in. Finally, the leading position in segment of newspapers, magazines and more recently TV makes it very interesting to analyze and value this company. The main purpose and contribution of this dissertation is to make an independent valuation providing a recommendation to investors. In order to achieve this goal, a hybrid combination of two valuation methods was performed. Firstly, due to its richness, robustness and used by a considerable number of researchers, we choose to apply the Discount Cash Flows (DCF) model with an Adjusted Present Value (APV) approach, selected because Cofina’s unstable capital structure. Secondly, a peer-group analysis was conducted to complement the study. Finally, we compare our valuation model to Caixa BI research note.
This work can contribute as an instrument to managers and investors and a way to assess the value in order to justify future investments strategies. Nevertheless this study can have some limitations. This type of analysis can be defined based on subjective assumptions, which can lead to biased results. Also, the uncertainty of the actual market and some constraints in getting information makes it very difficult to make an accurate valuation.
The structure of the dissertation is organized as follows. In the next section, to support our study we conducted a literature review, to understand what are the basilar concepts of equity valuation and the underlined methods that can be used to realize this analysis. Next, to have a background of the study object, a company and industry analysis was made. In section 3, several assumptions were defined based on theoretical foundation of equity valuation and the company specificities. In section 4, we analyzed the results obtained concerning the DCF method and assumptions defined. Section 5 presents a peer group analysis. After that, we are
Catolica Lisbon School 7 in conditions to compare our results to a well-established investment bank, Caixa BI. The last section we conclude analyzing the findings of this work under the scope of company valuation.
Catolica Lisbon School 8
2.
L
ITERATURE REVIEW
2.1.
Valuation
According to Damodaran (2006), “valuation can be considered the heart of finance”. It can be used in corporate finance, when we make a decision to make an investment, change financing or dividend policies in order to increase firm value. In portfolio management, in order to take advantages on arbitrage opportunities, we try to find firms that are undervalued. Moreover, when studying market efficiency, we analyze firm’s value and measure if they deviate from market prices and how long they take to revert to normal.
Nowadays, value should be measured to support decision making. The success of a manager’s financial decision when investing and managing resources, whether the decision is to build a new factory, release a new product, enter a new market segment, or even invest in information technology, depends on his or her ability to estimate and identify the sources of value in those decisions. Thus, a company’s overall performance depends on those resource allocations (Luehrman 1997). Koller et al., (2010) also acknowledged that the ability to manage value is essential to develop business strategies in order to gain competitive advantage and to create value to shareholders. Furthermore, it is also crucial to determine value, since any investment decision implies an opportunity cost (e.g. the cost of not investing in an alternative solution).
Accordingly, the key in financing operations is to understand the value of those operations, “what is worth?” (Luehrman 1997). It is possible to value any asset, but for each of them we have to assume different valuations methods and make new assumptions, since they may have their own characteristics (Damodaran 2002). As Young et al., (1999) stated the problem is not that there are few valuation methods, it is that there are too many and we are reaching the point of “valuation overload”. Thus, choosing the most appropriate valuation method can be a real challenge.
However, despite of the numerous existing valuation methods, valuation is not an exact science, but instead an opinion of the valuator who is performing it (Fernandez 2013). In fact, the method that we choose may be quantitative, but the inputs can be defined based on subjective assumptions. Additionally, the valuation outcome obtained could be affected by the bias that we bring into the analysis (Damodaran 2002).
Catolica Lisbon School 9 In the next section, due to the subjectivity of the value measurement we will expose and compare different valuation methods.
2.2.
Valuation Methods
As referred above, there are several valuation methods and choosing the right one can be a real challenge. The choice will depend on the nature of the situation that we intend to value. Moreover there is no method that is best suitable for each situation, we can choose simpler or more complex ones, and some will need more data or provide more information insights. Additionally, companies as well as the industry sector may have their own characteristics that may require different valuation methodologies.
Although, these models can have very different assumptions about the principles that determine value, they share some common characteristics and can be organized through a wider classification (Damodaran 2006).
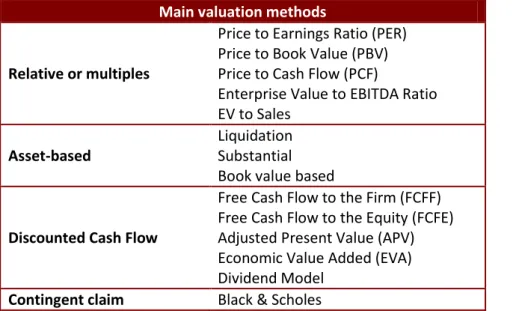
Grounded on academic literature (Damodaran 2002; Fernández 2013; Young et al., 1999), we have segmented the valuation methods in four main categories: relative valuation, asset-based, discounted cash flow (DCF) and contingent claim valuation. Hence, we can provide a broader picture of the valuation frameworks that is summarized in the following table:
Main valuation methods
Relative or multiples
Price to Earnings Ratio (PER) Price to Book Value (PBV) Price to Cash Flow (PCF)
Enterprise Value to EBITDA Ratio EV to Sales
Asset-based
Liquidation Substantial Book value based
Discounted Cash Flow
Free Cash Flow to the Firm (FCFF) Free Cash Flow to the Equity (FCFE) Adjusted Present Value (APV) Economic Value Added (EVA) Dividend Model
Contingent claim Black & Scholes
Table 1 - Main valuation methods (source adapted from: Damodaran 2006; Fernández 2013; Young et al. 1999)
In relative valuation, the value of the firm can be estimated quickly and easily, without making numerous assumptions. For that we have to find in the market, firms with similar
Catolica Lisbon School 10 characteristics, often called the peer group, and compute value by using a set of multiples based on cash flows, sales, profits, or book-value.
In the context of asset-based valuation, firm’s value can be estimated through its balance sheets. So values that do not appear in the accounting statements - such as firm´s future cash flows or industry’s macroeconomic factors - are not taken into consideration. Moreover, the book value almost never matches the market value (Fernández, 2013). Examples of application are related with cases of bankruptcy or liquidation, which is not the case at stake.
In discounted cash flow methods, a firm’s value is estimated by discounting its expected future cash flows with a rate that reflects the business risk and growth expectations. This model is considered by Fernández (2013) as the proper valuation method to use, since detailed assumptions and careful forecasts are made for each of the firm’s assets that are being valued. Additionally, Damodaran (2006) stated that this approach relies on a rich theoretical foundation used by most researchers. Thus, a good valuation should be based on Discounted Cash Flows methods.
Last but not least, the contingent claim models are used to value assets which have similar characteristics to options and are dependent of future events. These models can be estimated with option pricing models (e.g. Black and Scholes). For the purpose of this dissertation, due to the characteristics of this approach we considered it inappropriate for the present analysis. Despite these different valuation methods Young et al., (1999) defend that “virtually every popular valuation approach is simply a different way of expressing the same underlying model”. Their research has based in mathematical studies comparing methods like Dividend Discount Model, Free Cash Flow to the Firm, Dynamic ROE and Economic Value Added, reaching the conclusion that the methods could be mathematically equivalent and the final value could be the same, as long as the assumptions made remain constant. Fernández (2013) also shows in his research the equivalence between ten methods. The author argues that the result is logical, as the methods considered in the study analyzed the same situation based on the same set of assumptions. Moreover, Ruback (2002) postulates that the valuation technique choice could be influenced by the characteristics of the company being valued, as some models could be easier to apply and with fewer flaws.
As a consequence, since the objective of this dissertation is not to give an extensive explanation of all the existing valuation methods, in the next chapter we intend to focus on the main methods applicable in valuing listed companies, especially in those that are going to be used in Cofina’s valuation: Discounted cash flow and relative valuation.
Catolica Lisbon School 11
2.3.
Relative Valuation
In relative valuation, the value is estimated by comparing the firm under analysis to other similar firms. In a general way when someone wants to sell a house they determined the value by comparing how much was paid for similar houses in the neighborhood. The same can happen in the stock market when a shareholder decides the value of his stocks by comparing it with similar ones.
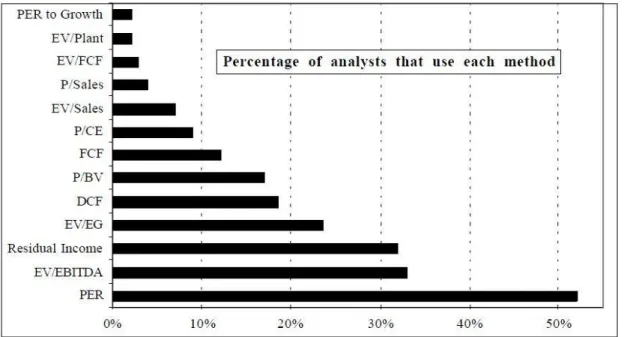
Lie and Lie (2002) asserts that to estimate a firm’s value, this method requires computing multiples for a group of comparable firms and then estimate value based on those benchmark multiples. Accordingly, this method has two basic steps to determine value. Firstly, we need do identify comparable firms, often called the peer group. This task can be very challenging and demanding. Generally, in order to minimize estimation errors, comparables of the same industry must be chosen (Lie and Lie 2002; Alford 1992). However, this choice must take in consideration peers with similar returns on invested capital (ROIC) and growth expectations (Goedhart et al., 2005). Secondly, choose the right multiple to use. As illustrated in Graphic 1 bellow the most commonly used multiples are the Price-Earnings Ratio (PER) and Enterprise Value to EBTIDA (EV/EBTIDA). Goedhart et al., (2005) argues that in order to apply multiples properly the practitioners should use forward-looking multiples and enterprise-value multiples. According to Fernández (2013), the most commonly use multiples in the media sector (the industry of Cofina) are PER relative and EV/EBITDA.
All in all, value is estimated by multiplying the average multiple of the comparable firms by a relevant firm value, depending of the multiple used (e.g., earnings when PER is used or EBITDA when EV/EBTIDA).
Often, researchers and analysts choose this method for valuation purposes. Damodaran (2002) notes that 90% of equity research’s and 50% of acquisitions valuations use relative valuations and Fernández (2013) showed on is research that Morgan Stanley analysts use these type of method more often compared to other methods like the DCF (Graphic 1). The reason behind these could be due to its simplicity, with fewer assumptions compared to the other methods, which could be easily explained to shareholders or clients. Additionally, since is based on others firms it can reflect the current market reality, which in turn, helps managers to understand why their multiples differ from the others. Finally, it can also create value by giving insights of the market key factors (Goedhart et al., 2005).
Catolica Lisbon School 12
Graphic 1 - Most widely used valuation methods (Source: Morgan Stanley Dean Witter)
However, these advantages can also mislead. When using comparable firms we often overlook the fact that companies, even in the same industry, can have different characteristics in variables like growth rates, ROIC, or capital structures (Goedhart el al, 2005). Damoradan (2002) also stated that multiples valuation is susceptible to manipulation since there is a lack of transparency in the assumption made and it can also lead to undervalue or overvalue valuation results, as it is affected by the market trends. Additionally, we can observe inconsistent final results by choosing different comparable firms or multiples. All in all, a valuation that only uses multiples could be controversial, as it can lead to wide dispersed results (Fernández 2013).
Despite this weakness, some researchers (Fernández 2013; Goedhart el al, 2005) defend that relative valuation can be used as a complement of the discounted cash flow method. By using a relative valuation at a later stage, it can help not only to adjust and justify some of the underlying assumptions, but also can help to test the valuation final result.
2.4.
Discounted cash flow approach
Discounted cash flow method is based on a firm’s intrinsic value. Meaning that, it relies on an exhaustive and cautious forecast, for each period, of each financial caption related with the generation of a firm’s cash flows (Fernández 2013). After the forecast, firm’s value is estimated by discounting its expected future cash flows with a rate that reflects the business risk and
Catolica Lisbon School 13 growth expectations. Accordingly, this method is dependent on three variables: cash flow generating capacity, growth and risk (Damodaran 2006).
Due to the fact that this method needs a more detailed and careful analysis, it is regularly claimed by researchers and analyst as the best practice for valuation purposes (Luehrman1997), being generally considered as the only conceptually correct valuation method (Fernández 2013).
Notwithstanding, it should be noted that the DCF approach, like in the relative valuation, is susceptible to manipulation since the assumptions may be influenced by analyst bias and a simple adjustments to the model can cause a huge impact on the final result.
As showed above (Table 1), there are many variants of the DCF methodology, since illustrating all of them falls outside the scope of this Dissertation and for simplification’s sake, the next section will be focused on Free Cash Flow to the Firm and Adjusted Present Value.
2.4.1.
Free Cash Flow to the FirmAccording to Froot and Kester (1995) and Damodaran (2006) the Free Cash Flow to the Firm (FCFF) model is the most commonly used valuation approach among practitioners. This method pretends to value a firm’s entire business (equity and debt). Therefore, the value of a firm is estimated by discounting the expected free cash flow to the firm at the weighted average cost of capital (WACC).
Where the FCFF stands for the amount of cash generated from the firm’s operations deducted from all operational expenses, taxes and reinvestments needs (e.g., changes in net working capital and capital expenditures). Moreover, it is an important measure to debtholders and equityholders as it can express the cash available, as well as the well-being and the firm’s profitability. The FCFF can be estimated as follows:
After measuring the FCFF the next step is to determine the rate for which the cash flows should be discounted. Since the FCFF approach pretends to value the entire firm, the discount rate has to take into consideration both of the required return rate of the equityholders and debtholders, weighted to the extent to which the company is financed (Fernandez 2013). Thus,
Catolica Lisbon School 14 the WACC is estimated by weighting the cost of equity (ke) and the cost of debt (kd) according to the firm’s capital structure:
Where D stands for debt and E stands for equity, both measured using market values. The equation also considers the marginal tax rate (T), which is the rate at which the last Euro of income is taxed. Accordingly, it is implicit in the formula both the tax benefits of debt and the expected bankruptcy cost.
The main challenge in WACC computation could be the capital structure. This approach is most suitable and accurate for companies with a stable capital structure (Koller et al. 2010). However, in some cases it could be unrealistic to consider that the capital structure remains unchanged in the forecast period or even in perpetuity. Although, it is possible to use WACC in these situations, adjusting the rate every year, the process is very complex and demanding. In such cases, Koller et al. (2010) recommends to use the adjusted present value (APV) approach.
2.4.2.
Adjusted Present ValueThe adjusted present value (APV) was first introduced by Myers (1974). In this method firm’s value is achieved by computing the unlevered value (i.e., value of the firm with no debt), and then add the side effects of debt financing separately. Generally, when a company increases leverage through debt financing it generates tax shields (i.e., interest expenses are tax deductible) and also increases the bankruptcy risk (Damodaran 2006).
Accordingly, one of the main differences between the APV approach and the WACC approach is the fact that, when measuring the value of the operating assets the discount rate does not take in consideration the debt financing effects. As a result, the benefits and costs of debt financing are measured separately (Damodaran 2006).
Under this approach, the enterprise value will be the sum of the unlevered value with the side effects of debt and can be estimated as follows:
The unlevered value (Vu) is estimated with the same expected cash flow used in the WACC approach, the FCFF. In what regards the discount rate to apply, since the model pretends to value the firm as if it had no debt, the expected free cash flows are discounted through the unlevered cost of equity (ku).
Catolica Lisbon School 15
The tax shields are a controversial issue, since the academics diverge in the discount rate that should be used. Myres (1974) argues that, under the scenario of constant debt level, debt and tax savings are perfectly correlated, which implies that they have the same risk. Thus tax shields should be discounted at the cost of debt (kd). Luehrman (1997) refers that the cost of debt is the most common approach and the best practice. However, he argues that tax shields are more uncertain, so upward adjustment to the discount rate should be made.
On the other hand, Fernandez (2004) states that tax savings should be calculated as the difference between the levered and unlevered firm value and not by the present value of tax shields related with interest. Cooper and Nyborg (2006) showed in his research that Fernandez is not correct and the value of tax shields is the present value of the tax savings from interest, discounted at the cost of debt.
Simply stated the expected bankruptcy cost is the difference between the firm value when is normally operating and the firm’s value in a financial distress situation, multiplied by the probability of default. Thus, in order to estimate these costs, two parameters are required, the bankruptcy costs as a percentage of the firm value (%CFD) and the probability of default [P(D)].
The bankruptcy costs can be direct costs, such as court-related fees, and indirect costs, such as the loss of customers and suppliers (Koller et al., 2010). Damodaran (2006) asserts that the bankruptcy costs percentage relative to the firm value is estimated based on firm’s bankruptcies research. In Korteweg (2007) study the bankruptcy costs on average can range from 12% to 28% of the firm value. Moreover, Andrade and Kaplan (1998) estimated that the preferred percentage should be 10% and a more conservative percentage should not exceed 23% of the firm value.
Catolica Lisbon School 16 As for the probability of default it can also be estimated through default studies. For each level of debt a bond rating is associated and then use default studies to determine the default rate associated to each rating.
2.4.3.
Cost of capital estimationAfter illustrating some of the most common approaches used in the DCF valuation method it is also crucial to explain the cost of capital estimation. This concept corresponds to the “opportunity cost that investors face for investing their funds in one particular business instead of others with similar risk”. It is also important to mention that in order to be consistent it must include all investing sources, namely debt and equity (Koller et al., 2010). For simplification’s sake this section will not be focused on the academic discussion, instead it will be focused on the best practice for implementation.
2.4.3.1.
Cost of equityCost of equity is the return rate that an investor requires to compensate for the risk in investing in the company’s assets. This rate is often used in DCF models as the cash flow discount rate.
The most common and accepted model among practitioners to determine the cost of equity is through the Capital Asset Pricing Model (CAPM) (Damodaran 2002). Despite some disagreement between academics, so far, no practical alternative has emerged (Koller et al. 2010). Brotherson et al. (2013) also postulate that currently CAPM is still the preferred model to estimate the cost of equity. Although, they note that when implementing the model there is some divergences in the components choice, namely the market risk premium.
The CAPM assumes that the expected rate of return on an asset equals the risk-free rate (rf)
plus the asset’s beta (βi) multiplied by the market risk premium (rm-rf): β
In order to identify the “best practice” in the cost of capital estimation Brotherson et al. (2013) made a survey with leading corporations and financial advisors. In their research they believed that the “best current practice” in CAPM estimation is the following:
i) The appropriate risk free rate should be based on government treasury bonds and the maturity should match the valuation explicit period
Catolica Lisbon School 17 ii) Betas should be picked from published sources and further judgment should be considered when the publisher’s beta diverge (e.g., benchmark beta with data from comparable companies)
iii) The market risk premium is the most controversy component. The average risk premium used by the respondents is about 6,5%, varying from 4% to 9%.
In addition, Damodaran (2013) postulates that an additional country risk premium should be added to the market risk premium, reflecting the extra risk in that specific country. The most straightforward and common method to estimate the country risk premium is to use the default spreads associated to the country’s rating (Damodaran 2013). Thus, the market risk premium is given by the following formula:
[9] Market Risk Premium = Base Premium for Mature Equity Market + Country Risk Premium
2.4.3.2.
Cost of debtAs for the cost of debt estimation when a firm’s debt is publicly traded the bond’s yield to maturity should be calculated and used as reference. On the other hand, in cases where the debt is not often traded the firm’s debt rating should be used to estimate the cost of debt (Koller et al. 2010). Damodaran (2002) besides considering both ways explained before, he also suggests the use of a firm’s recent borrowing history to estimate the cost of debt. By doing this we can perceive the type of default spreads the firm is paying.
Catolica Lisbon School 18
3.
I
NDUSTRY ANALYSIS
3.1.
Macroeconomic environment
After being affected by a global financial crisis, Portugal economy today is gradually recovering. With the positive growth rates of GDP and employment, the economy appears to have turned the corner in the second half of 2013. In 2014 and 2015 it is expected that economy continue to recover. Still, the Portuguese economic recovery remains vulnerable to external risks and its high private sector indebtedness (European Commission 2014).
The economic indicators for the last quarter of 2013 demonstrate that we are assisting to a stabilization of the economic recovery. The real GDP increased by 0.2% in the third quarter of 2013 comparing with the previous quarter. These positive developments can be explained by an increase of goods and services exports as well a strong domestic demand (specifically in private consumptions and gross fixed investment) comparing with the previous year (Bank of Portugal 2013). With the restructuring of the economy still in progress, future projections indicate growth rates in GDP of 0.8% in 2014 and 1.5% in 2015 (European Commission 2014). In 2014 and 2015, Portuguese economy will tend to be closer to the current projections for the euro area. However, a set of structural obstacles will continue to limit its potential growth in the near future (Bank of Portugal 2013).
The confidence surveys from European Commission reinforce the idea that Portugal is in recovery. In matter of consumer confidence, although it is still below the historical average (-37.9), comparing the second quarter of 2013 with the previous quarter the average moved from -55 to -53.8 (European Commission 2014).
Also, the labor market situation is observing positive improvements. The total employment increased 0.2% in the last quarter of 2013, comparing with the previous quarter (European Commission 2014). Although the unemployment rate is expected to stay above 16% in 2015, the trend will be to register a gradual decrease in the future (OECD 2013).
In what concerns prices, after a significant decline in 2013 a slight rise in inflation is expect in 2014-2015. The decrease in inflation in 2013 can be majorly explained by the impact of fiscal consolidation policies implemented in 2012, such indirect taxation and of the price of some goods and services (Bank of Portugal 2013). The Harmonized Index of Consumer Prices (HICP) deceleration is observed in year-on-year terms across most of its main components.
Catolica Lisbon School 19 Regarding investments, the relations of Portugal with financial markets remain vulnerable due to several uncertainties caused by the financial market sentiment (Bank of Portugal 2013). Also, in banking industry, Portugal is exposed to high level credit risk. The non performing loans are increasing particularly in corporate sector. Consequently, banks are reducing their credit products and reinforcing their capital buffers (OECD 2013).
3.2.
Media industry
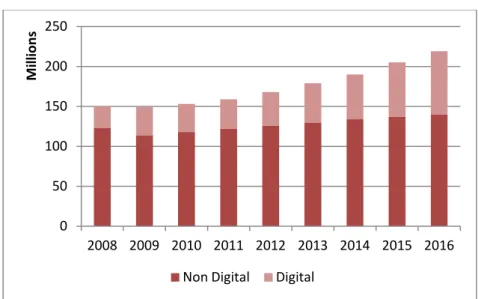
The media industry is constituted by digital and non digital media. Although non digital is considered dominant in the industry, in the next years the major growth will be on digital media (Graphic 2). In many markets, the entertainment and media (E&M) industry escape from the recession and is in a revolutionary change, with ongoing consumer migration to digital (PwC 2011). It’s the golden age of the empowered consumer. According to PwC Global E&M Outlook 2013, the sector needs to constantly innovate in products and services to meet consumer needs. This study analyzed the E&M segments such as: television, internet, advertising, cinema /video and publishing (newspapers and magazines).
3.2.1.
Global MarketThe global economy started to show recovery signs in 2010 with E&M consumer spending rising to 4.6%, after the 2.4% decrease in 2009 (Graphic 2). Also the global nominal GDP increased to 6.1% compared with a 1.7% in 2009. The introduction of digital products and services (e.g., electronic reading) provided a boost to E&M digital spending (PwC 2011). In the next year, the digital business is expected to continue to expand opportunities for new services, business models and consumer relationships (Graphic 2).
Catolica Lisbon School 20
Graphic 2 - Digital consumer spending drives global growth (Source: PwC 2013; Dissertation analysis)
The global market of magazines has been affected by the economical crisis. Comparing 2008 with a global market of 71.3 billion euros, 2012 registered a decrease of 2.8% annually. Although, the circulation revenues were severely affected by the economical crisis, the worst impact was observed in advertising revenues.
Nowadays, several countries are still assisting to a slow growth, but in the next five year the magazine sector is expected to recover. An increase of 0.3% annually is expected which represents 64.8 million euros in 2017. Hence, the growth of digital circulation will be determinant to this slight recovery and more visible in short term. In long term with the deceleration of mobile wave and broadband penetration it is expected to diminish the effect on this industry (PwC 2013). As we can observed in Graphic 3, the magazines are changing the way they are conceived. If in 2012 only 2% of magazines were digital, in 2017 it is expected that this representation increases 11%.
Graphic 3 - Percentage of consumer spending in magazines (Source: PwC 2013; Dissertation analysis) 0 50 100 150 200 250 2008 2009 2010 2011 2012 2013 2014 2015 2016 M ill io n s
Non Digital Digital
98% 2%
Magazines Digital Magazines
2012
87%
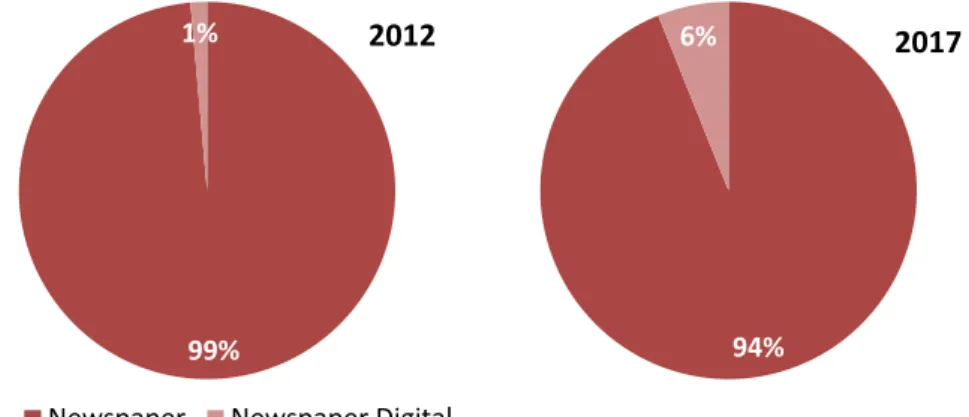
Catolica Lisbon School 21 Regarding the newspapers segment a global reading culture is increasing and today more than 550 million of newspapers are daily distributed. A future trend will be a paywall digital, which means, charging readers for online content. The decline of advertising revenues is explained by the online alternatives. From 2008 to 2012 the advertising revenues decreased from 85.54 to 66.92 billion euros. This decreasing trend will still be verified in the future with an annual decrease of 0.8% annual. However, the digital newspapers will increase in the same period by 10.8% annually.
Observing Graphic 4 we can conclude that the trend is quite similar to magazines. While in 2012, only 1% of digital newspapers exist, in 2017 this new product will have 6% weight in the segment of newspapers.
Graphic 4 - Percentage of consumer spending in magazines (Source: PwC 2013; Dissertation analysis)
Notwithstanding, according to the MarketLine1 study on the Publishing sector in Europe, which includes newspaper, magazines and books, the forecast is slightly different. In this report the compound annual growth rate for the industry until 2016 is predicted to be 1.6%. Additionally, the study states that “the success of the publishing market, wholly dependent on consumer spending, is strongly related to measurable factors such as economic growth and employment
levels and these factors will also affect competition in this market”.
In what concerns television, the subscription-based television services are an actual attraction and until 2017 it is expected a 3.8% annual growth. The competition between the different subscription-based platforms (cable, satellite and IP TV) will significantly vary across regions and is highly dependent on infrastructures and geographical factors. Interestingly, this was one of the segments that were less affected by crisis. Although the advertising revenues have
1
MarketLine Industry Profile (2012), Publishing in Europe 99%
1%
Newspaper Newspaper Digital
2012
94%
Catolica Lisbon School 22 assisted to a significant decrease of 8% in 2012, the TV advertising will also grow with an annual average rate of 5% until 2017 (PwC 2013).
3.2.2.
Portuguese MarketThe traditional media is facing several challenges related not only with the economical crisis but also with digital era and subsequent migration. Consequently, this market is in a profound change in the way they create revenues and execute their business models. Not only the competition is now broader but consumer is also more informed2.
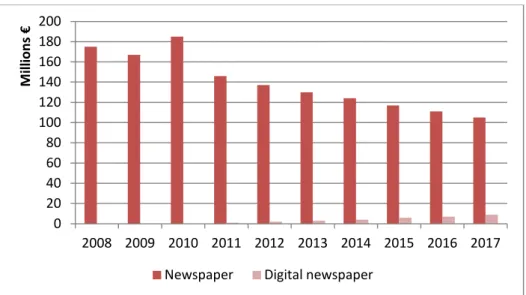
The newspaper segment was also affected by financial crisis with a reduction of the circulation and a significantly decrease of advertising revenues from 183.53 million euros to 124.43 million euros in 2012. Newspapers’ companies are facing an adverse economical environment. In 2012, “Público” and “Agência Lusa” were subjected to significant cuts. The news agencies need to be agile to generate revenues through merchandising or contract publishing. In the future, although the physical newspaper circulation will decrease the digital newspaper will continue to grow in Portugal (Graphic 5).
Graphic 5 - Newspaper circulation in Portugal (Source: PwC 2013; Dissertation analysis)
Hence, the future of digital newspapers is inevitable. This segment needs to be digitalized in order to survive to the evolution of information era. Also, the expansion to other markets that use Portuguese language such as Brazil constitutes a future trend (PwC 2013).
2
ERC report (2008), Media revenues in Portugal, Deloitte 0 20 40 60 80 100 120 140 160 180 200 2008 2009 2010 2011 2012 2013 2014 2015 2016 2017 M ill io n s €
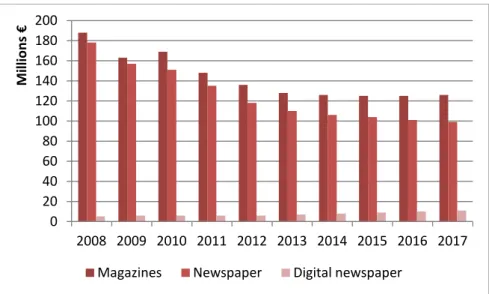
Catolica Lisbon School 23 Regarding the magazine sector, after a fast recovery from 2009 to 2010, a decreasing trend emerged in this sector. In the future, it is expected that the magazine’s circulation will decrease and begin to recover in 2016 reaching 158 million euros in 2017 (Graphic 6).
Graphic 6 - Magazines circulation in Portugal (Source: PwC 2013; Dissertation analysis)
The magazine market was considered to value 301.7 million euros in 2012. In the future, more specifically in 2017, this market will decrease to 284.63 million euros, which represent a 1.2% decrease. Several reasons can be behind this future projection. First, digital revenues do not cover the decrease of print magazines. In 2012, the digital revenues represent only 2%. In 2017 it is expected to assume a superior role with 10%. Second, advertising expenses will reduce significantly until 2017 (Graphic 7). Finally the stagnation of advertising is explained by the relocation of investments to online advertising and social communities (e.g., Facebook) (PwC 2013).
Graphic 7 - Advertising expenses in Portugal (Source: PwC 2013; Dissertation analysis)
In 2012, the TV subscription-based service reached a penetration rate of 60% with 3.1 million subscriptions. This is explained by the recent growth of the satellite services and IP TV of
140 145 150 155 160 165 170 175 2008 2009 2010 2011 2012 2013 2014 2015 2016 2017 M illi o n s € 0 20 40 60 80 100 120 140 160 180 200 2008 2009 2010 2011 2012 2013 2014 2015 2016 2017 M ill io n s €
Catolica Lisbon School 24 Portugal Telecom (PT). On the other hand, ZON Optimus has been losing subscriptions in cable and satellite platforms. This market is composed by three operators: PT and ZON Optimus (recently merged in 2013) and with a lower representation, Vodafone. In 2017 it is expected an increase of subscriptions to 3.8 million and a revenue volume of 521.7 million euros (Pwc 2013).
In Portugal, the TV advertising market as one of the smallest in Europe has been significantly affected by the economical situation and its recovery could be in line with the economical evolution in the future. The advertising revenues volume decrease 13% in 2009. After a marginal recover in 2010 it continued to decrease in the subsequent two years. In 2013, it is expected the worst performance with 237.97 million euros in advertising revenues. After 2014, it is expected an annual growth of 1.7% until reach 262.86 million euros in 2017 (PwC 2013).
3.2.3.
Challenges and opportunities for the futureIn the era of information society, agility and knowledge about the consumer constitute the main pillars to stay competitive in this industry. With the proliferation of Internet and a tremendous growth of intelligent devices the future trend is to become digital. Digital technologies are progressively increasing their influence across the industry and that rapid change in technologies and consumer behaviors will continue across all E&M segments (PwC 2013).
Also, the role of the E&M industry is changing. In the past the business model allowed to control every step since the content creation to distribution. Today is not about contents but about digital experiences in different distribution channels. Consumers want to access information through their mobile phones, tablets or computers. They decide where, when and how then want to see their contents. According to PwC Outlook 2013-2017, the consumer demand for E&M is empowered by the adoption of internet connected devices and it is expect to grow in line to GDP global trend during the period of 2013-2017 (PwC 2013).
To achieve competitive advantage the success in emerging digital environment lies in harnessing three industry wide dynamics: digitalization of contents, business processes and product innovation; demand of E&M products that respond to the needs of empowered consumers; and data-centric approach with the ability to mine and analyze useful information (PwC 2013).
Catolica Lisbon School 25 As a final note it is important to refer that, although digital is expanding the traditional media will still have a dominant position in revenues in future.
4.
C
OMPANY ANALYSIS
4.1.
Cofina overview
Founded in 1995, Cofina SGPS, SA (hereinafter refered as “Cofina” or “Group”) is a Portuguese holding company that operates in the media sector, particularly in newspapers and magazines publishing.
Listed on Euronext Lisbon since 1998, Cofina is currently the market leader in the Portuguese press segment and the third largest media company listed in the PSI stock index. Their ambition is to reinforce the competitive position adding value to stakeholders, as well as to have a significant presence in all media areas in Portugal.
To achieve that goal the Group strategy aims to maximize the value of the existing portfolio and continue to growth in all media segments, either through acquisitions or through new releases.
Cofina’s main business is the newspaper and magazines publishing. Currently their portfolio includes five newspaper and eight magazines:
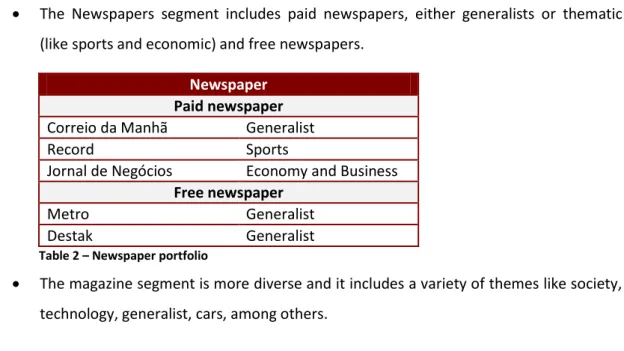
The Newspapers segment includes paid newspapers, either generalists or thematic (like sports and economic) and free newspapers.
Newspaper Paid newspaper
Correio da Manhã Generalist
Record Sports
Jornal de Negócios Economy and Business
Free newspaper
Metro Generalist
Destak Generalist
Table 2 – Newspaper portfolio
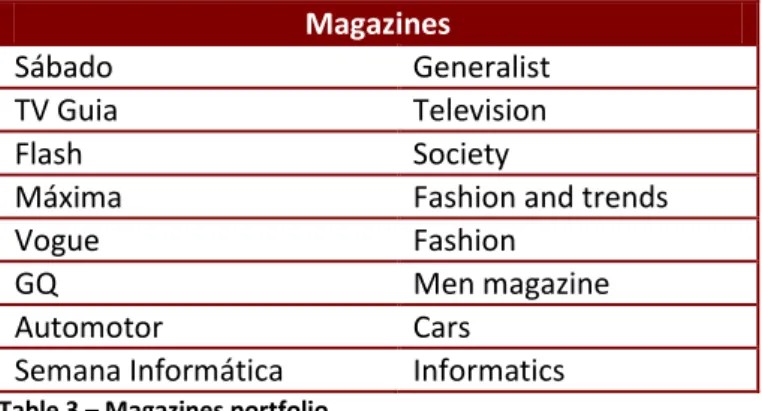
The magazine segment is more diverse and it includes a variety of themes like society, technology, generalist, cars, among others.
Catolica Lisbon School 26 Magazines
Sábado Generalist
TV Guia Television
Flash Society
Máxima Fashion and trends
Vogue Fashion
GQ Men magazine
Automotor Cars
Semana Informática Informatics
Table 3 – Magazines portfolio
Notwithstanding, with the internet evolution the publishing sector is facing some changes, as an increasing number of readers are abandoning print publications in favor of online content alternatives. Thus, Cofina is also present in the online market, which offers several websites mainly related with the newspapers and magazines portfolio.
Additionally, following the company strategy to be present in all media segments, in March 2013 the company lunched the first television channel, the “CMTV”. The channel for now is only available through “Meo”, which was been considered the best subscription-based television service in Portugal. According to the company, the channel exceeded the expectations in the first six months of existence, and is already one of the most viewed channels on subscription-based television service. This recent success is expected to have significant impact in the Company revenues in 2013 and in the future.
It is the Group intention to continue to expand in the TV segment. The CEO of Cofina, Paulo Fernandes, said that the television sector represents 75% of the publicity market. Thus, they recently formalized the desire to compete for future contests for free-to-air channels on DTT with the regulatory authority for media (“ERC”)3.
3
Source: Nobre, A (2013), Cofina quer canal de TV para acabar com "discriminação", Expresso (on-line). Available at:
Catolica Lisbon School 27
4.1.1.
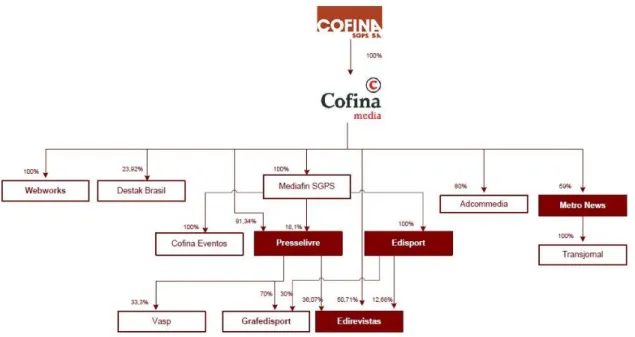
Cofina Group’s structureNowadays, the Cofina’s corporate structure is as follows:
Figure 1 - Cofina Group’s structure (Source Cofina report)
The main company is Cofina Media SGPS – the sub-holding company – which is the owner of the subsidiaries of the Group. Among the subsidiaries it is important to highlight the following:
Presselivre, which is responsible for editing the neswspaper “Correio da Manhã” and the magazine “Sábado”
Edisport which is responsible for editing the neswspapers “Record” and “Jornal de Negócios”
Edirevistas which is responsible for editing several magazines
Metro News which is responsible for editing the neswspapers “Destak” e “Meia-hora”
4.1.2.
HistoryCofina began its activity as a holding group of several businesses (e.g., pulp and forest, steel and media) in 1995. Ten years later, a division of business segments were made leading to the creation of a new company (Altri), which turns to be responsible by industrial assets. Consequently Cofina was now focused on the media sector.
During the period of 1995 until now, Cofina acquired and release several magazines: “Correio da Manhã” (2000), “TV Guia” (2002), “Sábado” (2004), “Destak” (2006), “Destak São Paulo”
Catolica Lisbon School 28 (2007), “Metro” (2009), “Destak Rio de Janeiro” (2009), and “Destak Brasília” (2010). More recently, with its expansion strategy Cofina released a TV channel named “CMTV”.
4.1.3.
StrategyCofina, as leading company in the media sector supports its strategy in two essential vectors: organic and non-organic growth. Yet, with a strong ambitious to attain a competitive position in all media sectors, Cofina has experienced a sustainable development achieved not only by organic growth and non-organic growth through acquisitions.
In what concerns organic growth, Cofina is committed to increase profitability of the existing portfolio by increase the EBITDA. Concretely, Cofina expects to maintain the investments in the oldest business segments (newspapers and magazines) and control the costs in order to optimize the functional structure.
In terms of non-organic growth, Cofina top line strategy is expanding focusing on its recent businesses to increase its size and financial strength. Cofina is positioned on other media business such TV but is also concentrate to reinforce its investments in international natural markets and domestic consolidation.
4.2.
Performance in the stock market
Cofina’s stock returned to the Portuguese PSI-20 stock Index in August 2012, after five years in PSI all-share. The share’s price of Cofina decreased over 16% between 31st January 2014 and the opening price of the 2012, while the main benchmark of the Portuguese stock market (PSI 20) increased 19% in the same period. Cofina’s stocks had traded at a maximum price of 0.77 € in January 2012 and at a minimum of 0.30 € in June of the same year.
During this period Cofina’s stocks were characterized by low liquidity, although with an increasing trend verified in 2013, where the volume of trades increased by 264%, between 2012 and 2013 increased by 264%.
Catolica Lisbon School 29
Graphic 8 – Cofina’s Historical Stock Prices
5.
V
ALUATION METHODOLOGY
According to what has been described in the literature review and the characteristics of Cofina, the valuation will be measured through two different models: Adjusted Present Value (APV) and relative valuation.
Additionally, the valuation will follow a sum of the parts approach with the valuation of each business units separately (journals and magazines). This task could be a challenge as the information provided by the company sometimes is not segregated by segments. For instance, in the company’s report the segregation of the operating expenses is not available by segments, so additional assumptions will be required to perform the sum-of the parts approach.
Even though the WACC approach is the most commonly used by practitioners, the APV approach will be followed mainly due to Cofina’s financial structure. During the historic period, the financial structure of the company was not stable and it is not expected that it will be in the future. Since one of the main assumptions of the WACC approach is a stable financial structure and that is not ensured, choosing this technique could lead to inaccurate results. With the APV approach the financial structure is not one of the main drivers, making it more reasonable to use. Besides, it can demonstrate in which parts the company is creating or destroying value. 0 2 4 6 8 10 0,0 € 0,1 € 0,2 € 0,3 € 0,4 € 0,5 € 0,6 € 0,7 € 0,8 € 0,9 € 1,0 € Ja n -12 Fe b -12 M ar -12 A p r-12 M ay -12 Ju n -12 Ju l-12 A u g-12 Se p -12 O ct -12 N o v-12 De c-12 Ja n -13 Fe b -13 M ar -13 A p r-13 M ay -13 Ju n -13 Ju l-13 A u g-13 Se p -13 O ct -13 N o v-13 De c-13 Ja n -14 M ill ion s
Catolica Lisbon School 30
6.
V
ALUATION ASSUMPTIONS
In order to perform the valuation of Cofina one needs to estimate the Free Cash Flows to the Firm (FCFF). Therefore, in this section, we intend to present and justify objectively the assumptions for the main drivers of the FCFF: operating revenues, operating expenses, depreciations, capital expenditures and investments in net working capital. Additionally, the assumptions regarding debt and dividend distribution will be also presented.
6.1.
Operating revenues
The company’s operating revenues will be segregated by segment and will be driven by three types of revenues: circulation of newspapers and magazines, advertising and alternative marketing products.
As illustrated below (Graphic 9), the company’s revenues registered a decreasing trend between 2008 and 2012, with a compounded annual growth rate (CAGR) of -5.8%. This trend could be related with the beginning of the 2008 financial crisis, which caused an adverse economic environment surrounding Cofina. Namely the readers who face difficulties with diminishing disposable income and purchasing power, as well as the companies with less spending in advertising caused by the tight budgets.
Graphic 9- Operating revenue (source: Cofina's report and dissertation analysis)
43% 47% 48% 51% 53% 42% 41% 40% 39% 35% 15% 12% 12% 10% 12% 0 20.000 40.000 60.000 80.000 100.000 120.000 140.000 160.000 2008 2009 2010 2011 2012
Circulation Advertising Alternative marketing products and others CAGR -5,8%
Catolica Lisbon School 31 It can also be observed (Graphic 9) that advertising and alternative marketing products revenues show a decreasing trend in values (with a CAGR of -10.3% and -10.6%, respectively). Moreover, the importance of those revenues in the total amount of operating revenues is also decreasing. In 2008 the advertising revenues was 42% of the operating revenue and in 2012 it was only 35%. On the other hand, the circulation revenues, despite the unfavorable economic environment, show an increasing trend both in values and in importance in total operating revenue, with the exception of 2012 that registered a considerable reduction in values around -7.1%.
Accordingly, the tables below illustrate the growth rate projections by segments assumed in this dissertation:
Table 4 – Newspaper growth projections
Table 5 – Magazines growth projections
Concerning 2013, the assumptions were based on Cofina’s reports of the first semester and third trimester of the same year. In the referred reports it is possible to observe that in 2013 the company is still facing some difficulties reflected by the decreasing revenues. As a result, a negative outlook is expected until the year end. Additionally, a brief explanation of each type of revenue will be made in the following sections.
It is important to note that despite the negative outlook for the traditional newspaper and magazines sector, described in the industry analysis, Cofina’s revenues will be influenced as well by the positive outlook and the company perspectives of the digital media and television markets.
Newspapers
Growth rate projections 2013 2014 2015 2016 2017 2018 2019 2020 2021 2022
Circulation -2,00% 0,60% 1,50% 1,80% 1,80% 1,80% 1,80% 2,00% 2,00% 2,00% Advertising -4,00% -1,00% 2,00% 1,50% 1,80% 1,80% 1,80% 2,00% 2,00% 2,00% Alternative marketing products -2,50% -1,00% 1,50% 1,80% 1,80% 1,80% 1,80% 2,00% 2,00% 2,00%
Magazines
Growth rate projections 2013 2014 2015 2016 2017 2018 2019 2020 2021 2022
Circulation -3,30% 0,10% 1,00% 1,10% 1,10% 1,10% 1,10% 1,10% 2,00% 2,00% Advertising -6,50% -2,00% 1,50% 1,80% 1,80% 1,80% 1,80% 2,00% 2,00% 2,00% Alternative marketing products -4,00% -1,00% 1,50% 1,80% 1,80% 1,80% 1,80% 2,00% 2,00% 2,00%
Catolica Lisbon School 32
6.1.1.
Circulation
The circulation of newspaper and magazines is one of the main types of revenues of the company, especially in the last few years with the advertising and alternative marketing revenues’ decreasing trend.
Overall, a consistent relationship between the circulation revenues and the Portuguese economy can be observed. When the economy is in recession a decrease in revenues is expected (and vice-versa). The newspaper and magazines prices have remained relatively constant among the years. Also, to the best of our knowledge, the company does not have a specific price policy. Therefore, we assumed the variation in circulation revenues is not dependent on prices, but instead depends on consumer purchasing power. The MarketLine (2012) report also asserts that this sector, by being dependent on consumer spending, is strongly related with the economy growth rates. Accordingly, growth rate projections were based on the International Monetary Fund (IMF) forecasts of the real gross domestic product (GDP)4 (Appendix 1).
Since magazines can be seen as non-essential goods, their demand, especially considering the actual economic crisis context, can be highly influenced by consumer income or purchase power. Hence, their circulation revenues, observed in the projected assumptions, are expected to be lower than newspapers.
6.1.2.
Advertising
As previously mentioned, advertising revenues presented a decreasing trend in the historic period. This behavior could be related with the present economic recession. Due to the tight budget policies, companies are willing to spend less in advertising.
Based on the IMF projections, we assumed the consequences of the economic crisis in advertising will remain at least until 2014. After that, with economic recovery, it is expected that advertising revenues will have a similar behavior as the real GDP growth.
6.1.3.
Alternative marketing products and others
This component is constituted by cross-selling products used (e.g., fashion accessories, DVD’s and others) as a way to attract consumers to buy core products (magazines and newspapers).
4 International Monetary Fund (2013), Portugal: Seventh Review Under the Extended Arrangement and Request for Modification of End-June Performance Criteria, IMF Country Report No. 13/160
Catolica Lisbon School 33 Although its representativeness is low and its volatility high, it is a way to slightly increase the sales revenues.
Due to its high volatility, it is quite difficult to forecast the evolution. This volatile behavior is related with marketing policies that are applied according to consumer trends, depending on sales objectives. While circulation and advertising are correlated with real GDP growth, the temporary characteristic of this component turns to create an irregular behavior on the projection. Thus, considering that this type of revenue has a small contribution and representativeness, we also assumed an increase rate projection in line with real GDP growth (Appendix 1).
6.2.
Operating Expenses
Due to the lack of detailed operating expenses information by segments (newspaper and magazines) in Cofina’s annual reports, additional assumptions had to be made in the historical period.
Cofina only provides the operating expenses total amount by segment. In order to estimate the operating expenses by type (i.e., cost of sales , external supplies and services, payroll expenses, provisions and impairment losses and other expenses), a percentage of the total operating expenses was determined.
Subsequently, a similar behavior between the operating revenues and their corresponding expenses was observed. Therefore, a representative proportion between each type of expenses and total revenues was calculated. After that, in the explicit forecast period, the various types of operating expenses were estimated using the operating revenues as reference, multiplied by the average representative proportion referred above.
% in Operating Revenue Newspaper Magazines
Cost of sales 14.0% 17.2%
External supplies and services 37.2% 45.5% Provisions and impairment losses 0.4% 0.5%
Other expenses 0.5% 0.7%
Table 6 - Operating Expenses explicit period assumptions
Notwithstanding, the payroll expenses were an exception and were estimated otherwise. The estimation was made considering the company’s number of workers assigned to each segment and the average cost per worker.
Catolica Lisbon School 34 The first step was to find out the number of workers by segments and its trend. Since 2008 Cofina has been reducing the number of workers (with the exception of 2009). This fact could be explained by the closure of publications in 2011 (e.g., “PC Guia” and “Máxima Interiores”) and in 2012 (e.g., “Automotor” and “Semana Informática”), motivated by decreasing advertising revenues as well as a lower circulation.
The reduction of workers might be justified as well by the government policies that promote youth employment. These policies support part of the worker’s salaries reducing the company costs and since the workers do not have effective contracts, they do not contribute for worker’s statistics.
Additionally, employment is positively correlated with the economic environment. Economic indicators show a recessive environment, with the appearance of recovery signs in 2014. For that reason, it was assumed that the number of workers will follow the employment projections trend of IMF (Appendix 1). Graphic 10 illustrate the evolution of Cofina’s workers during the historic and explicit period:
Graphic 10 - Historical and estimated average number of workers
Finally, the average cost per worker was achieved by dividing the payroll expenses by the number of Cofina’s workers. In the explicit period, the projections will follow the compensation per worker predicted by the IMF5 (Appendix 1).
5
International Monetary Fund (2014), Portugal: IMF Country Report No. 14/56 460 510 560 610 660 710 760 810 860 910 960
Catolica Lisbon School 35
6.3.
Capital expenditures and depreciation
Capital expenditures (capex) are investments made by companies in assets, either to acquire new assets or replace/renew outdated ones. Capex investment decisions are very important as they can compromise the future of the company and in most cases are not reversible. Often the main objective in capex investments decisions is to maintain production, in order to keep the business running, or to expand business through acquisitions.
Due to the fact that the company investment plan is unavailable, further assumptions regarding investments in capex had to be postulated. Firstly, it was assumed that Cofina will continue to invest similarly to what has been done in the past. Secondly, expansion investments are not going to be considered, the investments will be to renew or replace outdated assets to assure competitive advantages, technological development and continuous growth.
Considering the historical information, it was assumed that investments in capex were related to the company's revenues due to the regular trend and correlation between them. While concerning tangible assets, the percentage used was 2% of the total revenues, for the intangible assets the percentage was 0.5%. However, in the two final years of the explicit period, the rates were gradually increased to the same level of the depreciation, meaning that in the terminal period, capex will be offset by depreciation.
Concerning the depreciation, similar assumptions to the capex were considered. Hence, the projections were also based in the company’s revenues. Observing the depreciation of tangible and intangible assets, a percentage of 2.1% and 0.4% respectively were assumed. As a final step, it was necessary to proceed with the distribution of total capex and depreciation by segments. Thus, the assumption took into consideration the average percentage (from 2008 to 2012 period) for capex by segments, made available in Cofina’s annual reports6. The same reasoning was used for the depreciation.
6.4.
Net Working Capital
Working capital comprises all current assets minus current liabilities necessary for the business operations. Therefore, Cofina’s current assets considered from the computation of the working capital were: inventories, customers, state and other public entities, other current
6
Catolica Lisbon School 36 debtors and other current assets. For the current liabilities the accounts considered were: suppliers, state and other public entities, other current creditors and other current liabilities. In what regards the assumption made, only the main ones are going to be described. The others will be summarized in a table below.
The inventories registered in the companies balance sheets are mostly paper used for printing Cofina’s publications. The projections were based on the average days sales of inventory (DSI), computed in the historic period, and then multiplied by the projections for cost of sales (Table 7).
For the customers and suppliers, a similar approach was used. Instead of using the days sales inventory, the projections were estimated based on the days sales outstanding (DSO) and days payable outstanding (DPO) respectively (Table 7).
Average
Days sales of inventory (DSI) 58
Days sales outstanding (DSO) 29
Operating cycle 86
Days payable outstanding (DPO) 56
Cash conversion cycle (CCC) 31 Table 7 – Cash conversion cycle
As it was referred above, the summary of the rest of the items considered as working capital are briefly explained below:
Table 8 - Working capital assumptions
Working capital item Assumption Value
Current assets
State and other public entities Cost of sales + External supplies and services 0,4%
Other current debtors Operating Revenue 0,6%
Other current assets:
Newspapers and magazines to invoice Circulation 8,7%
Operating expenses paid in advance External supplies and services 0,5%
Charges related to subsequent year editions Cost of sales 2,6%
Others Constant
-Current liabilities
State and other public entities Operating Revenue 5,4%
Other current creditors Constant
-Other current liabilities:
Accrued payroll Payroll expenses 13,5%
Commissions payable Payroll expenses 4,9%
Rappel Circulation 2,8%
Supplies and external services External supplies and services 1,9%
Deferred income from alternative marketing Alternative marketing products and others 2,5%
-Catolica Lisbon School 37
6.5.
Dividends distribution
Cofina’s dividend distribution policy has been changing along the years. In 2006 and 2007 distribution was 0.035€ per share, with a payout ratio around 38.9% and 35.0%, respectively. However, with the beginning of the financial crisis, due to the negative net income in 2008, the company did not distribute dividends. As of 2009, the distribution has been 0.01€ per share.
Graphic 11 – Dividend per share and payout ratio (source: Cofina’s reports; dissertation analysis)
In the explicit period, it was assumed that the company is still going to distribute dividends to the shareholders. For the first years, since Cofina’s results are still recovering from the economic recession, the dividend distribution will continue to be 0.01€ per share. As of 2017, with net income still increasing, a dividend payout ratio of 30% was assumed.
6.6.
Debt
According to the historic period, Cofina was financed through a variety of types of debt, namely, bond loans, commercial paper, bank overdrafts and bank loans (short and long term). Additionally, by analyzing the company’s financial statements it is possible to see a debt decreasing trend, which may imply Cofina’s attempt to decrease its financial leverage (see Graphic 12 below). 0,000 € 0,005 € 0,010 € 0,015 € 0,020 € 0,025 € 0,030 € 0,035 € 0,040 € 2006 2007 2008 2009 2010 2011 2012 Dividends per share
0% 5% 10% 15% 20% 25% 30% 35% 40% 45% 2006 2007 2008 2009 2010 2011 2012 Payout ratio