Chapter 1
Introduction
New lightweight structures capable of supporting a multiplicity of functions are needed as cores for sandwich panel constructions. Currently, stochastic foam materials and prismatic structures such as corrugations and honeycombs are used. Each of these materials / structures possesses certain strengths and weaknesses inherent to their respective topologies. For example, honeycombs provide the best combinations of stiffness and strength, but their closed cell nature makes them susceptible to corrosion and delamination, and requires costly inspection methods when they are used in primary structure applications. Millimeter length scale 3-dimensional lattice truss structures are being created to replace these foams and honeycombs by offering new combinations of stiffness, strength, robust performance and multifunctionality. However, they are currently made from steel and aluminum casting alloys. This thesis explores their extension to high strength (heat treatable) aluminum.1.1 Background
Efforts to create structural materials that maximize combinations of stiffness and strength and minimize weight have increasingly turned towards sandwich panel concepts that utilize engineered cellular materials for their cores. Interest in these materials has intensified throughout the twentieth century driven largely by the need for improved land, marine and aerospace vehicles [1,2]. Insights about the mechanical performance of structural materials can be gained by examining materials selection maps that rank the stiffness and strength of structural materials as a function of their density [3]. Figure 1 shows two such maps created using software developed by Ashby and colleagues [4]. The charts reveal that in order to escape the lower density bound of bulk solids (the lightly green shaded region where the density is less than ~1 g/cm3) some form of
porosity must be introduced. However, there is a concomitant loss of stiffness and strength, the exact extent of which depends upon the topology of the material in the porous structure and intrinsic properties of the material from which it is made. Understanding how to shape the porosity to maximize mechanical performance and
devising methods to affordably fabricate such structures represent two of the most fundamental challenges facing new lightweight structural materials development today.
Figure 1. (a) Stiffness property chart used for materials selection. (b) Shown is the strength property materials selection chart. In both charts the upper left corner represents goodness. Materials of densities less than ~1 g / cm3 (light green region) all possess cellular topologies.
1.1.1 Cellular Metals
In bulk metallic structural materials, porosity is invariably avoided since it results in unacceptable losses of mechanical performance [5]. However, observations of natural materials (e.g., bone, and wood) have long indicated that weight efficient load bearing members have a cellular structure consisting of either reticulated ligaments (i.e., open cell) or encapsulated membranes (i.e., closed cell). Examples from the work of Gibson and Ashby are shown in Fig. 2 [6]. These observations led to the identification of a class of materials known as cellular solids. A significant body of research into the structure and properties of these natural materials has now been accumulated and organized [6].
Figure 2. Examples of cellular solids found in biological systems. These materials generally consist of reticulated (open cell) materials such as sponge and bone, and membrane (closed cell) materials such as the various wood based materials (courtesy L.J. Gibson, Cellular Solids, 1997).
Synthetic cellular materials from polymers, metals, and ceramics have also begun to be developed. Intentional manufacture of metal foams can be traced to J.C. Elliot (1956)
Sponge Cancellous bone
Coral Cuttlefish bone
who describes the method of particle decomposition in molten alloys [7]. Extensive research and industrial development has occurred since the 1970’s and has led to numerous methods for making metal foams and several emerging applications [5]. Figure 3 shows examples of the topology of several metal foam products now available. A recently published design guide by Ashby et al. reviews ways of making metal foams, their fundamental properties and some of their current applications [5].
Figure 3. Examples of several metal foams currently available. The Cymat, Alporas and ERG Duocel foams are made from aluminum alloys by particle decomposition (Cymat), gas melt injection (Alporas), and pressure casting (ERG Duocel). The nickel based Incofoam is made by an electroless deposition process.
1.1.2 Topological Optimization and Multifunctionality
Natural cellular materials achieved optimal load support and added function (e.g., fluid transport) over time through growth and mass redistribution processes. This is a form of
(a) Cymat (b) Alporas
(d) Incofoam (c) ERG Duocel
5 mm
5 mm 5 mm
natural topological optimization in which the density, location, shape and connectivity of the pores is optimized to achieve certain functions [8], In nature this phenomenon is accomplished by an internal dynamic material redistribution around a genetically encoded blue print of previously successful designs. It has resulted in sophisticated structures that accomplish a multiplicity of functions (e.g., bone that provides load support, a calcium repository and a medium for blood cell growth). Figure 4 is an example of a natural multifunctional topologically optimized cellular structure – an avian bone. Notice its resemblance to a sandwich panel structure (i.e., a structure with a pair of widely spaced high strength facesheets kept separated by a low density cellular structure).
Figure 4. Cross-section view of an avian wing bone [9].
The dynamic optimization (adaptation) processes used by nature have yet to be achieved synthetically. Today, identifying and implementing static optimized topologies for predetermined loadings is the current state-of-the-art in structural design [8]. Developing optimal engineered cellular solids represents current research efforts, while successfully extending this approach to the dynamic regime via nastic-like [10] or other processes may be the next great leap in scientific understanding and technological mastery of
cellular materials, but for now we focus upon developing a fundamental understanding of the structure – property relations of the static structures that can be fabricated today.
1.1.3 Classification of Cellular Metals
Metallic foams may be considered the first attempt at creating engineered cellular solids, but as seen in Fig. 3 the structures are generally stochastic and little if any attempt to create an optimal load supporting topology has been evident in their development. There is another class of cellular solids that have characteristic 2-dimensional (2-D) periodicity. Hexagonal honeycombs providing a common example of a prismatic cellular solid [6]. It should be noted that honeycomb is a highly efficient 2-D load supporting topology, but nearly optimal for only a few loading conditions [6], as is the case for all prismatic cellular solids. Other 2-D topologies have been devised and are widely used for a variety of applications [2,11]. Figure 5 shows a schematic profile representation of some common and less common prismatic cellular solids.
Figure 5. Five samples of prismatic cellular topologies, of these only (a) hexagonal honeycomb has seen widespread application as core material for sandwich panel constructions. (b) triangulated, (c) square, (d) Kagomé, (e) Star-hex [12].
A new class of cellular solids has emerged based upon 3-dimensional lattices of trusses [13,14]. These lattice truss structures offer the means to achieve the mechanical efficiency of prismatic cellular solids, and the potential to create optimal load supporting multifunctional materials due to their open cell topologies.
1.1.4 Lattice Truss Structures
Recent efforts continue to improve the weight to stiffness and/or strength ratios of multifunctional cellular solids have begun to investigate lattice truss structures [15]. If the criterion for multifunctionality requires a quasi-isotropic open cell topology [15], then these open truss structures appear much more promising than closed cell foams, honeycombs and other prismatic structures.
Historically lattice truss structures are found at large length scales (e.g., civil engineering structures such as sports stadium roofs). Lattice truss plates gained widespread adoption in the 1970’s following the patented inventions of the Octet Truss and related structures by R. Buckminster Fuller, Fig. 6 [16].
Figure 6. Patented Octet Truss by Buckminster Fuller for civil applications [23].
These lattice truss structures reduce the “dead load” and allow for much greater unsupported spans (hundreds of meters) to be achieved [17]. The improvements are based on the principle that the trusses within the structures predominately experience axial stresses (tension or compression) when loaded (i.e., they are stretch dominated)
[18]. This mode of loading is capable of higher load support than bending dominated concepts.
M. Lake appears to be the first to apply the techniques of crystallographic symmetry to develop a wholly deterministic approach for predicting the globalized elastic stiffness and strength properties of large space filling lattices [19]. More recently V.S. Deshpande et al., have applied Maxwell rules for assessing the necessary (but not sufficient) topological requirements for obtaining stretch dominated lattices [20]. After scaling these structures to millimeter lengths and smaller, substantial improvements in strength and stiffness compared to metallic foams have been predicted [20]. Indeed, micro-lattice truss structures are the first to take the concepts of 3-D shaping and make progress towards the achievement of minimum weight quasi-isotropic materials (which would fill the desired vacant regions in the top-left portion of Figure 1).
It has been shown that open cell metal foams (the topological sibling of lattice trusses) have macroscopic mechanical behaviors governed by beam bending [5]. Thus their stiffness, when scaled by their relative density parameter (i.e., the ratio of the volume of a unit cell occupied by material to that of the cell volume, or equivalently the unit density to the solid density from which it is made), , scales by
2, and the best case the strength scales with
3/2. The stiffness and strength properties at low relative densities (< 0.10) limit their usefulness (due also impart to low measured scaling coefficient values) in applications requiring high structural load support [5] and provide the impetusfor seeking lattice truss topologies with improved mechanical properties that are predicted to scale linearly with in both stiffness and strength.
Utilizing lattice truss structures for the cores of sandwich panels has been suggested as a means to achieve efficient load support and other functionality such as cross flow heat exchange or high intensity dynamic load mitigation. The lattice truss topologies (Fig. 7) of interest include the Octet-truss [21], its derivative mono-layer tetrahedral structure [22-24], the lattice-block [25-27], and its mono-layer pyramidal derivative [28], and the 3-D Kagomé structure [29, 30], a variant of the tetrahedral topology.
(a) OCTET TRUSS (c) LATTICE BLOCK
(b) TETRAHEDRAL LATTICE TRUSS (d) PYRAMIDAL LATTICE TRUSS
(e) 3D KAGOMÉ
Figure 7. Lattice truss topologies recently investigated. All have been made by investment casting. The tetrahedral (b) and pyramidal (d) trusses have also been fabricated by the folding of perforated sheet. In (b),(d) and (e) the lattice truss structure is bounded by solid face sheets.
Development of suitable methods for the manufacture of these lattice truss structures from high performance light alloys has paced their application [31]. Initial efforts utilized
investment casting of high fluidity non-ferrous casting alloys such as copper/beryllium (Cu-2Be wt.%) [29] aluminium/silicon (Al-7Si-0.3Mg wt.%) [21, 22, 26, 27], and silicon brass (Cu-4Si-14Zn wt.%) [22]. However, the intricacy of the lattice paths made it difficult to fabricate porosity free structures. These cast lattice materials lack the mechanical robustness required for many structural applications [31,32]. This has led to the development of other approaches by Sypeck and Wadley that exploit the ductility of wrought metals [33]. They include perforated sheet folding [33] and wire lay-up techniques [34]. These resulting structures can be bonded to each other or to facesheets by transient liquid phase (TLP) bonding, brazing, micro welding, or other metal fusion techniques.
To date, austenitic stainless steel structures with tetrahedral [33] and pyramidal truss [28] geometries have been made by this method. However, lattice truss structures made from austenitic stainless steels remain in an annealed (i.e., low strength) condition after the bonding process. While they are much more robust than their investment cast counterparts [31], their low specific strength reduces their desirability for weight sensitive structural applications. Extensions to light alloys are therefore desired.
1.2 Goals of the Thesis
Previous studies of lattice truss structures manufactured via the investment-casting route were unable to experimentally probe the mechanical properties at low relative densities because of manufacturing limitations. This approach also precluded a thorough investigation of the relationship between alloy mechanical properties and those of the
lattice truss structure. Here we show that the newly invented perforated sheet folding can be applied to age hardenable aluminium alloys (e.g., AA6061) and affords an opportunity to examine the role of the mechanical properties of the parent material upon the specific strength of the lattice truss structures over a wide range of relative densities.
1.2.1 Thesis Outline
The thesis is organized as follows: Chapter 2 presents the mechanical property predictions for tetrahedral lattice truss cores. Chapter 3 reports on lattice truss fabrication technologies developed during the course of the research. Chapter 4 details the fabrication methodology for making age hardenable Al-Mg-Si alloy tetrahedral lattice truss sandwich panels. Chapter 5 gives the experimental methods used to determine the lattice truss mechanical response. Chapter 6 reports the experimental lattice truss compressive and shear response results for both annealed and age-hardened alloy tempers. In Chapter 7 the measured stiffnesses and strengths are compared to the model predictions and to competing cellular metal topologies. Chapter 8 summarizes the study’s findings while Chapter 9 provides a brief outline of future work.
Chapter 2
Mechanical Behavior Predictions
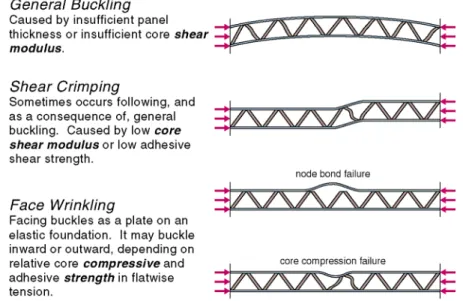
Sandwich panels made with thin strong facesheets are being increasingly utilized in weight sensitive structural applications [2]. The core structures of these panels must simultaneously meet several requirements to ensure the successful mechanical performance of the sandwich design [2,11]. These functions include, (i) maintaining the allowable separation between facesheets (ii) prevention of the facesheets from sliding past one another, and (iii) ensuring the facesheets remain nearly flat (with respect to their original configurations) [2]. When the loads exceed the ability of the core to sustain these requirements, failures of various forms may occur. Whether or not these failures are catastrophic (i.e., sudden and substantial loss of load support) depends largely upon the topology for a given core relative density [11]. Moreover, the magnitudes of the loads that are sustained also depend upon the topology of the core structure. Figure 8 shows some of the more commonly encountered types of core influenced failures, and the mechanical properties that determine the onset of these failures [11].
Figure 8. Schematic of the common core dependent failure modes of sandwich panels. With the wide availability of strong facesheet materials it is the properties of the core that now drive the performance of many sandwich panels and identifying the best candidate requires both topological and material considerations [35]. The tetrahedral lattice is one of the most weight efficient quasi-isotropic topologies known, with predicted strengths varying less than 15% in the out-of-plane shear directions [22, 28]. This provides the basis for characterizing the tetrahedral lattice truss performance over a range of practical relative densities.
The mechanical properties of tetrahedral lattice truss sandwich core constructed from elastic perfectly plastic and plastic strain hardening materials have been reported by Desphande and Fleck [22]. The analytical predictions for stiffness and collapse strength of the tetrahedral lattice are based upon the treatment of truss members as individual axially loaded columns comprising the tetrahedral unit cell. The mechanical properties are then globalized via the introduction of the relative density.
2.1 Relative density
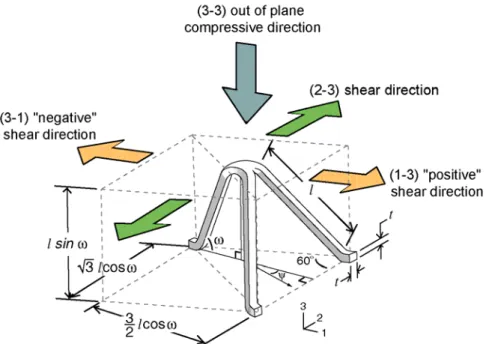
The relative density has been used to characterize the properties (mechanical and otherwise) of porous materials [6]. It also may be used to characterize the properties of lattice truss structures, and to make comparisons with other cellular topologies [5,6]. Simple expressions can be derived linking the relative density to the topology of a representative unit cell. Consider the tetrahedral lattice truss unit cell defined in Fig. 9. The relative density, of the lattice truss is the volume fraction of the truss members occupying the unit cell. Appendix A.I derives an expression relating the relative density of the free (design) parameters of the tetrahedral lattice, shown in Fig. 9. For square cross-section truss members it has the form:
2 2 1 3 2 l t sin cos (1)
where is the included angle (the angle between the truss members and the base tetrahedron) and t and l are the thickness and strut length, respectively.
2.2 Elastic Stiffness
For lattice truss materials that are stretch dominated the elastic properties are predicted to scale linearly with the relative density [20]. For a single layer tetrahedral lattice truss two independent stiffness constants (the out-of-plane compression and shear stiffness) are important for the mechanical performance of a sandwich panel [22]. The out of plane compression stiffness, E33, can be written (Appendix A.II):
4 33 Es sin E (2)
where Es is the Young’s modulus of the parent alloy, is again the included angle
defined in Fig. 9, and is the relative density defined by equation (1). The out-of-plane shear stiffness (Appendix A.III) of tetrahedral lattice truss is given by [22]:
sin 2 8 2 23 13 s E G G (3) 2.3 Strength Predictions
Here we specify the compressive and shear strengths of the tetrahedral lattice trusses, respectively. Of the several sandwich panel failure modes possible, the compressive strength of the lattice determines the failure loads for flexural crushing, local crushing and facesheet wrinkling, while the shear strength of the truss controls the transverse shear panel failure, Fig. 8.
In determining the compressive strength, first consider the tetrahedral lattice truss made from rigid perfectly plastic material with tensile yield strength, y. In this case yielding
(of the entire lattice) is coincident with the peak strength, pk
33
, and is given by (Appendix A.IV): 2 33 ysin pk (4)
A linear dependence of compressive strength upon parent alloy yield strength and truss relative density is predicted.
Next, consider the case where elastic buckling of the constituent truss members controls core collapse. The peak compressive strength is obtained by replacing y in equation (4)
with the elastic buckling strength of a truss member. Written explicitly, the predicted peak compressive strength becomes:
2 2 3 2 2 33 sin cos 3 8 pk s E k (5) where Es is the Young’s modulus of the solid (parent) material and k is a factor
accounting for the rotational stiffness of the ends of the struts: k 1 or 2 for pin-ended or
built-in end conditions, respectively.
Very slender (low ) truss members will fail by elastic buckling whereas stocky trusses will fail by plastic yielding. By equating (4) and (5) it is possible to define the that partitions which failure controls the compressive strength of the core. Tetrahedral lattice trusses made from an elastic ideally-plastic material will collapse by elastic buckling of the constituent truss members when the relative density:
s y E cos sin k 2 2 8 3 2 (6)
Now consider a tetrahedral lattice made from an elastic-strain hardening material. Compressively loaded trusses begin to plastically deform (yield) at a strength given by (4), but the lattice can continue to support increased load because the flow stress of the truss material increases due to parent alloy strain hardening effects. In such cases, as discussed in [22], the trusses of the tetrahedral lattice eventually collapse by plastic buckling at a plastic bifurcation stress,cr, given by Shanley-Engesser tangent modulus theory [36,37]: 2 2 2 12 l t E k t cr (7)
where Et is the tangent modulus defined as the slope d/d of the uniaxial stress versus
strain curve of the solid material at a stress level cr [37]. The compressive strength of the lattice truss is obtained by replacing y in (4) bycr. Note that in the case of a material with a linear strain hardening response Et is a constant and 33pk again scales with2, whereas pk
33
of a tetrahedral core made from ideally-plastic solid material scales linearly with relative density.
We proceed to specify the minimum out-of-plane shear strength of the tetrahedral lattice truss. Consider the load application in the 1-2 plane of Fig.9. Using methods analogous to the compression case enables expressions for the lattice truss shear strength for an elastic perfectly plastic parent material to be derived. From symmetry of the tetrahedral arrangement in the 1-2 plane the lattice truss shear strength is periodic (period of 2/3) with respect to the load orientation angle (Fig. 9). The out-of-plane shear strength
therefore has a minimum and maximum strength direction. The minimum out-of-plane lattice truss shear strength lies in the 1-3 type directions and is given by (Appendix A.V):
sin2 4 13 min y y (8)
where y is the material yield strength, is the included angle and is the relative
density. The maximum out-of-plane lattice truss shear strength is: sin2 3 2 23 max y y (9)
Next, consider the case for a plastic strain hardening material with tensile strength, TS. Here the shear strength of the lattice in the 1-3 shear direction is now given by replacing
y in (8) byTS : sin2 4 13 TS pk (10)
whereas in the 3-1 shear direction, Fig. 9, the shear strength is given by replacing y in (8) bycr: sin2 4 31 cr pk (11)
where cr again corresponds to the column (truss member) bifurcation stress. Note that a difference in TS and cr associated with strain hardening materials will lead to
asymmetric shear strength of the tetrahedral lattice truss in the 1-3 (minimum strength) type directions [22].
With these predictions in hand a perforated sheet folding method was devised for fabricating samples from a heat treatable 6061 aluminum alloy (Chapter 4). A series of experiments were then designed and conducted (Chapters 5 and 6) to probe the lattice compressive and shear stiffness expressions (2) and (3), as well as the compressive strength (4) and the shear strengths corresponding to (10) and (11). First, however, we explore technologies developed for creating lattice structures then detail the methodology used to make tetrahedral lattice truss sandwich panels using an age hardenable aluminum alloy (AA6061).
Chapter 3
Fabrication Methodologies
3.1 Development of Lattice Truss Fabrication Technologies
The use of lattice trusses as core structures in ultralight sandwich panels has been paced by the methods of their manufacture. Therefore, an important component of the thesis research task involved inventing and developing new and improved approaches for making lattice structures from light alloys. A guiding theme has been the maximization of the fraction of original starting material incorporated in the structure while maintaining mechanical performance.
3.1.1 Multilayer/Full-Occupancy Tetrahedral Lattice Trusses
Four new processes for creating lattice truss structures have been developed. The first, Figure 10, is an extension of the perforating and folding of metal sheets developed by Sypeck and Wadley for pyramidal and tetrahedral lattices [33]. Here a 2-dimensional perforation pattern was created which, upon folding resulted in a tetrahedral lattice with all sites occupied. Previous tetrahedral lattice trusses (as shown in Fig. 7(b)) have only 50% of available tetrahedral sites occupied by trusses. Figure 9 shows the two available sites per unit cell. Folding was accomplished with an interleaving comb punch/die (Fig. 10). The resultant lattice may take the form of either two 50% occupancy tetrahedral layers, or a fully occupied single layer depending upon the configuration of the punch/die tooling [38]. Figure 11 shows an example of the double layer lattice truss made from AA6061.
Figure 10. Schematic of the manufacturing process of a generalized perforation and folding process for making multilayer tetrahedral lattice truss structures. The punch and die sets may be reconfigured such that the bottom tetrahedral layer is folded upwards resulting in a fully occupied single layer lattice.
Figure 11. Photograph of the double layer tetrahedral lattice made from AA6061.
Simple estimates can be made for the fraction of material utilized by the perforated sheet method and its dependence upon This is done by relating the relative density of the flat perforated sheet,2D to the relative density of the folded lattice structure, . To a
first approximation (i.e., ignoring overlapping truss member volumes at the nodes) the general relationship for fraction of material utilized is given by:
C
U 2D (12)
where C is a topology specific proportionality constant. The materials utilization expression for a tetrahedral lattice (assuming regular tetrahedrons, = 54.7°) as shown in Fig. 9, becomes: 97 . 0 U (13)
If we apply the same considerations to the multilayer / full occupancy tetrahedral lattice approach of Fig. 10 we may write:
94 . 1 U (14)
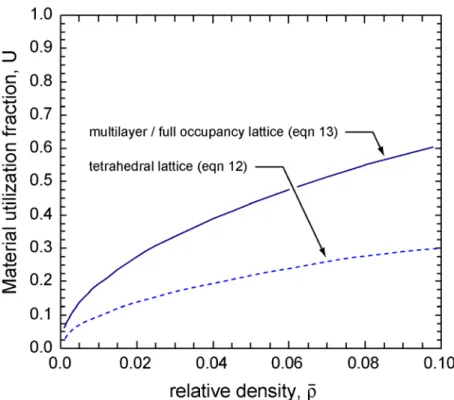
Appendix B details the derivations for eqns (13) and (14). Figure 12 shows the utilization improvements garnered by multilayer / full occupancy lattice compared to the tetrahedral lattice. From Fig. 12 we observe that for a tetrahedral lattice with a relative density of 1% only 10% of starting material is used, but for the same relative density the full occupancy method will double the amount of material utilized to 20%.
Figure 12. Materials utilization improvement between the single-layer folding method (Figure 15), and the multilayer/full occupancy folding method shown in Figure 10.
3.1.2 Lattices from Expanded Metal Sheet
A second method for manufacturing pyramidal lattices was devised that yields close to ~100% materials utilization. In this approach, a metal sheet was slit and expanded by stretching [39] (Fig.13). A cold rolling step was used to flatten the expanded sheet. Finally, the bending locations were assigned and the sheet was folded with a finger-brake to create a 3-D pyramidal lattice.
Figure 13. Schematic of the manufacturing process for the expanded pyramidal lattice truss cores. The primary steps involve slitting, flattening, and folding the metal sheet.
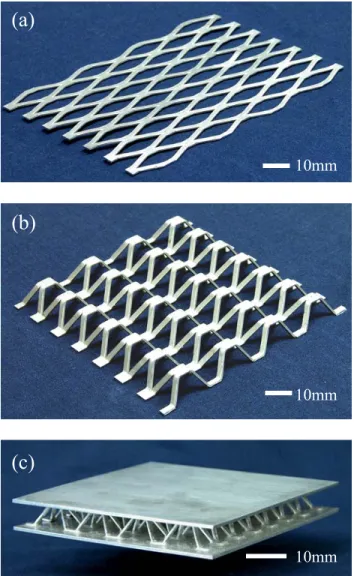
A recent study by Kooistra and Wadley shows that this method results in comparatively larger core-to-facesheet bonding nodes, and the subsequent compressive and shear mechanical performance of the trusses are reduced in scale by the mass fraction of metal located at the nodes [39]. Figure 14 shows examples of the expanded metal truss structure at various stages of processing.
Figure 14. Expanded pyramidal lattice trusses made from AA3003. (a) Expanded and flattened sheet (b) pyramidal lattice after folding and (c) shows the lattice after being brazed to aluminum alloy (AA6061) facesheets.
(a)
10mm(b)
10mm(c)
10mmSignificant refinements appear feasible by exploring the limits of truss and node mass apportionments possible with the expansion process [39]. Moreover, other researchers have reported potential issues in core robustness due in part to the node bond size [40], indicating a trade-off between lattice truss and node bond mechanical properties.
3.1.3 Lattice Before Expansion Method
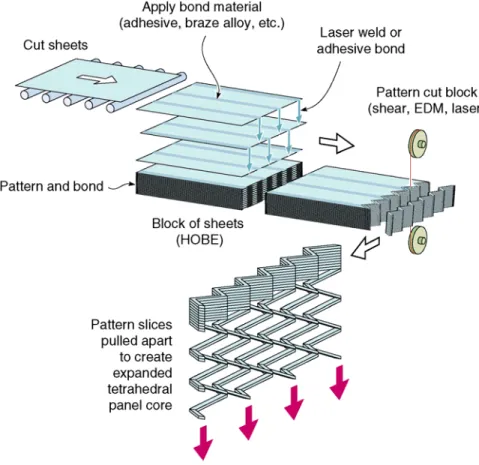
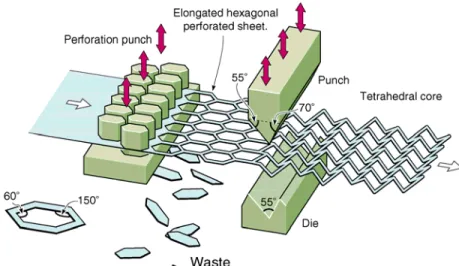
A third high materials utilization method for creating lattice structures has been motivated by the process used to make honeycomb sandwich core structures, Figure 14 [11]. In this approach metal sheets were coated with a bonding agent (either a polymeric adhesive or braze alloy) or strip welded to create a block of periodically joined material. A wire EDM (electric-discharge machining) method is then used, prior to the expansion that would normally result in honeycomb, to cut a zigzag pattern from the block. Stretching of the zigzag block then yielded a tetrahedral lattice as shown in Fig. 15. This method has both high materials utilization and a node area similar to the perforated sheet method. The approach could be used to create tetrahedral or pyramidal topologies, Fig. 16.
Figure 15. Schematic for the lattice before expansion (LBE) process. The method is similar to HOBE (honeycomb before expansion) with the addition of the pattern cutting step.
Figure 16. Effect of varying bond line width in (LBE) process. (a) bond widths equal to truss lengths result in the tetrahedral topology upon expansion, (b) small bond widths produce the pyramidal topology.
3.1.4 Slot Truss Method
A fourth method for fabricating pyramidal lattices from any sheet material has also been developed, Fig. 17. A primary attractiveness of this approach is that sheet material ductility is not required as the materials employed need only satisfy the criteria involved in cutting and bonding, and once again nearly all of the initial sheet material is utilized. Figure 17 illustrates the two steps needed to create assembled pyramidal lattices. The approach proceeds as follows: First the desired cutout pattern is generated. This may include gradations of truss member included angles to achieve a final contour of the constructed lattice. Truss member cutout cross-section profiles may be varied according to structural requirements, but the width of the node slot must be equivalent to the materials sheet thickness at the node to ensure a good fit.
Cutouts may be made by appropriate methods such as machining, wire electrical discharge machining, laser cutting or abrasive water jet cutting, or chemical milling. The length scale of lattices made by this method is limited only by the minimum slot width achievable which can be on the order of 50m if chemical milling is applied and as large as tens of centimeters by more conventional cutting methods. The fitted node locations must be bonded / joined in a suitable fashion so as to minimize the effects of stress concentrations associated with the node slots. For metallic materials this may involve fusion welding, brazing or diffusion bonding. The approach appears extendable to polymer composites. In this case adhesive bonding with metallic bridging pins (z-pins) may be necessary [40]. Figure 18 shows an example of a slotted and assembled pyramidal lattice made from 3-ply birch veneer.
Figure 18. Pyramidal lattice made using the slotted truss approach. Prototype non-ductile material is a 3-ply birch wood laminate of 1.5mm thickness.
Chapter 4
Tetrahedral Lattice Truss Test Samples
The remainder of the thesis focuses upon the tetrahedral lattice truss sandwich panels manufactured by the newly invented perforated sheet folding process [33]. The method is applied to the age hardenable Al-Mg-Si aluminum alloy (6061) system. The formed lattices are brazed to solid facesheets of similar alloy compositions, and these sandwich panels will then be mechanically tested in compression and shear for relative densities between 2.0 – 10.6% for both annealed and peak age hardened heat treatments.
4.1 Lattice Truss Fabrication
A folding process was used to bend elongated hexagonal perforated AA6061 (Al-0.6Si-1.0Mg-0.28Cu-0.20Cr wt.%) sheet to create a single layer 50% occupancy tetrahedral truss lattice [41]. Figure 19 schematically shows the process. The folding was accomplished node row by node row using a paired punch and die tool with the sheets folded so as to form regular tetrahedrons (that is the angle = 54.7º).
Figure 19. Schematic of the manufacturing process of the tetrahedral lattice truss cores involving perforation and folding.
An example of an elongated hexagonal perforated sheet (with open area fraction of 0.82) that would create a tetrahedral lattice with predicted relative density, = 0.067 is shown in Fig. 20(a). Figure 20(b) shows a folded tetrahedral lattice truss with a (measured) pre braze relative density, . The relative density of the truss cores was varied by using different perforated sheet thicknesses and appropriately spacing the perforating punches to maintain a square truss cross section. This required only one punch/die set to produce the five relative density lattices investigated.
(a) Perforated sheet (b) Tetrahedral lattice truss
Figure 20. (a) Photographs of the perforated sheet used to form a 4.8 % relative density core and (b) the corresponding tetrahedral lattice truss after the folding operation.
4.2 Sandwich Panel Construction
Sandwich panels were constructed from the folded truss structures by placing a tetrahedral lattice core between AA6951 alloy sheets clad with AA4343 braze alloy. Alloy compositions, melting and brazing temperatures are shown in Table I. The assembly was then coated with proprietary metal-halide flux slurry (Handy Flo–X5518, Lucas Milhaupt Inc., Cudahy, WI), dried, and placed in a muffle furnace for brazing. Each assembly was heated to between 595±5ºC for approximately 5-10±1 minutes (depending on sandwich mass) to minimize joint weakening associated with silicon
10mm
t
l
interdiffusion from the brazing alloy [42-44]. After air-cooling to ambient temperature, one set of sandwich panels was solutionized at 530ºC for 60 minutes and subsequently furnace cooled to place the alloy in the annealed (O) condition. A second set of panels was water quenched from the solutionizing temperature and then aged at 165ºC for 19 hours. This achieved the peak strength (T6 temper) for the AA6061 alloy [45].
Table I. Aluminum alloy compositions and temperatures for melting and brazing [43].
Si Cu Mg Zn Mn Fe Cr Ti Melting Brazing 6061 0.4-0.8 0.15-0.40 0.80-1.2 0.25 0.15 0.7 < 0.35 0.15 616-652 6951 0.2-0.5 0.15-0.40 0.40-0.8 0.20 0.10 0.8 -- -- 616-654 4343 6.8-8.2 0.25 -- 0.20 0.10 0.8 -- -- 577-602 593-616 Temperatures (ºC) Composition (wt%) AA designation
It must be noted that this thermal history was designed given the constraints of the laboratory equipment, and less thermally expensive routes are possible. No visible distortion was observed after water quenching. Tensile test coupons of AA6061 accompanied the cores through each thermal process step and were later used to approximate the mechanical properties of the parent material used in the tetrahedral lattice trusses. Figure 21 shows the schematic laboratory brazing/heat-treatment process flow.
Figure 21. Furnace brazing and heat treatment process used to create AA6061 tetrahedral lattice truss sandwich panels.
Two orthogonal views of a sandwich panel with a post braze 3.0% relative density core are shown in Figure 22. The brazing step results in an increase in the relative density of up to 0.8% and depended on the AA4343 clad thickness.
Figure 22. Views of the 3.0% relative density brazed tetrahedral lattice (a) as seen from the 2-3 direction (b) as seen from the 1-3 direction, see Fig 9.
Table II compares the measured (pre and post brazed) and predicted relative densities. The first order model (eqn. 1) over predicts pre-braze relative densities due to the “double-counting” of the nodal volumes [22], especially at the higher relative densities where the nodal volumes become significant.
Table II. Predicted and measured relative densities of tetrahedral lattice truss structures reported at a confidence level of 95%.
t/l Prediction Pre-braze measurement Post-braze measurement 0.063 0.017 0.017 ± .003 0.020 ± .001 0.079 0.027 0.025 ± .004 0.030 ± .002 0.099 0.042 0.029 ± .004 0.039 ± .001 0.125 0.067 0.048 ± .003 0.069 ± .002 0.178 0.136 0.083 ± .002 0.106 ± .003 Relative density 10mm 10mm 1 3 2 3
Post-braze relative densities increase at lower relative densities due to the volume of braze fillets being proportionately large enough to counter the effects of double counting of the nodes, Fig. 23. In this study the lattice trusses will be identified by their post braze (experimentally determined) relative densities, and subsequent data normalizations are all based on these measurements.
Figure 23. The percent change in relative density compared to the predictions after brazing. At the lowest relative densities the increases become more pronounced due to the relatively larger volume of the core occupied by the braze fillets.
Chapter 5
Experiments
Three types of experiments were performed to characterize the mechanical response of the aluminum tetrahedral lattice trusses and the parent alloy mechanical properties. Here we explain the methods used for gathering the data. The first experiments measure the uniaxial tensile response of the aluminum 6061 alloy, which is used to make predictions of the lattice truss stiffness and strength properties. Next, the compression experiment methodology is shown, and we conclude by detailing the tests for obtaining the lattice truss shear mechanical property data.
5.1 Parent Alloy Uniaxial Tensile Tests
Experiments to measure the uniaxial stress vs. strain response of the AA6061 followed ASTM E-8 guidelines [45]. Uniaxial tension specimens were machined from AA6061-T651 (6.35mm plate thickness). A servo-electric universal testing machine (Model 4208, Instron Corp., Canton, MA) with self-aligning grips was used to test each specimen at ambient temp (~25°C). The applied nominal strain rate was 0.2mm/min (10-3 s-1), and the strain measurements were made using a linear variable differential transformer (LVDT) clip-on extensometer with an accuracy of ±0.5% of the gage length of 50mm.
5.2 Laser Extensometer Validation
A matrix of 50 lattice truss compression and 40 shear tests were needed for this study. Therefore, it was decided to use a laser extensometer (Model LE-01, Electronic Instrument Research, Irwin, PA) to obtain nominal strain data. The laser extensometer
has a displacement resolution of 0.001±0.001mm. Before testing the sandwich panels a check on the quality of the laser displacement data was performed. This was done by comparing it to LVDT displacement data. A tensile test (6061 tensile bar) was performed that recorded both clip-on LVDT and laser extensometer displacements simultaneously. The 6061 elastic modulus served as the standard. The tensile Young’s modulus of AA6061 has an accepted value of 68 GPa at 25°C using ASTM test methods [47]. The compressive Young’s modulus is reported to be 2% greater (69 GPa). Figure 24 shows the elastic Cauchy stress vs. logarithmic strain using both measurement methods. The plotted LVDT data for Es is in agreement within < 1% of the literature. The laser extensometer agreed with the literature to within < 1.5%. From this test we were confident the laser extensometer would be sufficiently accurate for the tetrahedral lattice experiments. Further calibration of the laser data was not performed.
Figure 24. The comparative measurements of AA6061-T651 elastic stress vs. strain behavior. Data acquisition is by laser and LVDT extensometry.
5.3 Compression Experiments
The sandwich panels were tested in compression following the guidelines of ASTM STP C 365-00 [48] for sandwich panel constructions. A screw driven testing machine (Model 4208, Instron Corp., Canton, MA) was used at an applied nominal strain rate 10-3 s-1. Figure 25 shows a photograph of the experimental setup. The sample was marked with retro-reflective tape on both the upper and lower facesheets to set the gage length and placed between two polished 150mm diameter steel platens. The test samples were not constrained in the directions normal to the applied load. Measured load cell force was used to calculate the stress applied to the lattice truss core. The nominal macroscopic truss strain was calculated by dividing the displacement data by the original sandwich core height.
Figure 25. Photograph of the compression test setup in the Instron 4208 test machine. Compression platens are 150mm in diameter. The load cell is rated at 300kN.
laser extensometer
150mm platens 300kN load cell
5.4 Plate Shear Experiments
Previous studies have identified the tetrahedral lattice truss orientations corresponding to minimum core out-of-plane shear strength [22]. These orientations (loading in the 1-3 type directions) are shown schematically in Figure 9, and are predicted to fail by either a single unit cell truss member in compression (the 3-1 direction) or in tension (1-3 direction). The tests were designed to probe these strength minimums. The brazed sandwich panels were tested according to ASTM STP C-273-00 using a compression shear plate configuration [49], as shown in Figure 26. The samples were sheared in the Instron Model 4208 testing machine at an applied nominal strain rate 10-3 s-1. The measured load cell force was used to calculate the stress applied to the sandwich, and the displacement data was obtained by the laser extensometer. The height of core was used to set the retro-reflective tag gage length.
Figure 26. (a) Compressive plate shear test fixture schematic showing the fixation details. (b) A 3.9% relative density sample in place. The bolt-on gages shown on the front face hold the retro-reflective laser tags used to mark the gage length.
retro-reflective laser tags 10mm shear plate (a) (b)
Previous studies have found good fixation of the test samples critical to obtaining accurate data, especially at high strains and for high strength cores [22,31]. Here the test samples were attached using four techniques in concert to prevent premature debonding and/or movement relative to the shear plates (Fig. 26(a)). Fixation was accomplished by epoxy bonding (Loctite Hysol® E-120HP), with mating surfaces grit blasted and degreased with acetone. The facesheets were also tapped and threaded to accept machine screws (ANSI #10-32) fastened through the shear plates. Further mechanical holding was provided by a leading edge stop machined into the shear plate and a trailing edge adjustable clamping bar (Fig. 26(a)).
Chapter 6
Results
6.1 Parent Alloy Constitutive Response
To utilize the predictions in Chapter 2 that relate lattice truss topology to mechanical properties, the constitutive response of the parent material must be known. Data for the uniaxial elastic stiffness, yield strength, tensile strength and work hardening characteristics are required. This can be obtained from tensile test data directly or by fitting a modified power law relation such as the Ramberg-Osgood equation [50]. Since the mechanical response of AA6061 is very sensitive to heat treatment, it was decided to make direct measurements. From a uniaxial stress strain curve we may obtain the effective values of the Young’s modulus, Es, yield strength, y, tensile strength, TS, and
use d/d to compute values of the bifurcation stress, cr (Et) for a given relative density.
The underlying assumption of the direct measurement technique is that the stress strain response in both tension and compression are sufficiently symmetric to provide valid predictions.
6.1.1 Effects of Heat Treatments
Five heat treatments were designed to explore the range of mechanical properties available from the 6061 aluminum alloy. The first tensile specimen was solutionized at 530°C for 90 minutes (specimen temperature) and allowed to furnace cool to place it in the annealed (O) condition. The four remaining samples received the same solutionizing treatment, but were subsequently cool water (15°C) quenched. Three of these samples were then given artificial aging treatments at 190°C for 1, 5 and 100 hours, and the fourth
given an industry practiced treatment at 165°C for 19 hours [45]. The artificial ageing at 190°C was done to achieve over ageing at practical time scales. Figure 27 shows the Cauchy (true) stress vs. logarithmic strain responses.
Figure 27. The monotonic uniaxial stress vs. strain response of AA6061 for three artificial aging treatments.
For this study the annealed (O) and (T6) constitutive responses were chosen for application to the lattice truss experiments. Table III shows the mechanical property values obtained from the uniaxial Cauchy stress – logarithmic strain curves. The yield strength, y, is taken at the 0.2% offset per convention, and the tensile strength, TS, is the
Table III. The measured elastic and strength properties of AA6061 for various heat treatments.
Heat Treatment Es (GPa) y (MPa) TS (MPa) f (%)
190°C 1hr 67.0 222 302 20.9
190°C 5hrs 68.3 289 346 18.9
190°C 100hrs 67.7 290 333 16.3
165°C 19hrs (T6) 69.1 268 306 15.1
Annealed (O) 68.6 70 208 21.2
6.2 Compressive Stress Strain Response
The representative stress strain responses of tetrahedral truss cores loaded in compression at each relative density and heat treatment are shown in Figure 28. The lattice trusses exhibit similar compressive stress strain behavior to that of many cellular metals [5]. After some initial bedding-in there is a region of linear type loading. Following the linear response, gradual core yield occurs followed by a peak in the compressive stress. Continued loading resulted in “softening” followed by a stress plateau until densification (at a strain of 0.5 to 0.6) where upon the core exhibited greatly increased load resistance. Figure 28 reveals that the degree of softening depended both on the relative density of the truss core and the metallurgical state of the parent alloy. For impact energy absorption applications, a stress versus strain response with little or no softening after yield is desirable [6]. The highest relative density annealed samples, Fig. 28, exhibit this behavior.
Figure 28. The combined compressive response of (a) age hardened and (b) annealed lattices.
Photographs of the 3.0% relative density annealed core at various stages of deformation are shown in Fig. 29. This figure reveals that bending of the truss members occurs at loads just prior to the peak strength, Fig. 29(b), with the softening coinciding with the formation of a plastic hinge in the middle of the truss member, Fig. 29(c). Neither truss member fracture nor node failure was observed during any (annealed or age hardened cores) of the compression experiments performed.
(a)
= 0.00
33= 0.0 MPa
(b)
= 0.04
33= 0.58 MPa
(c)
= 0.10
33= 1.15 MPa
(d)
= 0.20
33= 0.68 MPa
Figure 29. Photographs of the 0.03 annealed tetrahedral lattice truss at four selected levels of compression. Formation of a plastic hinge in the middle of a truss member is clearly seen in (c). Subsequent deformation results in bending about this hinge leading to softening (d).
From the stress strain response we measured four compressive properties. Figure 30 shows schematically where these are located for a generic stress strain curve. From the curve, the compressive stiffness,
E
33init, is taken from the slope of the initial elastic-like loading region. The stiffness at the peak compressive load,E
33pk, was found by unloadingand reloading the samples, and fitting a regression to find the value of the linear slope. Also recorded is the apparent compressive yield strength, yield
33
, at the 0.2% offset, and the peak compressive strength, pk
33
.
Figure 30. A schematic compressive stress strain curve showing the initial lattice stiffness,
E
33init, the lattice stiffness at the peak stress,E
33pk. Also denoted is the yield,yield
33
, and peak, pk
33
, strengths.
Table IV presents the values of the stiffness and strength properties of the lattice trusses loaded in the compressive 3-3 direction. The table reports this for each relative density tested, and for both heat treatments.
Table IV. The measured elastic and strength properties of the tetrahedral lattice loaded in compression. All values are reported for a 95% confidence interval.
mean relative density
heat
treatment (MPa) (MPa) (MPa) (MPa)
0.020 O 35.1 ± 1.9 307.4 ± 46.6 0.61 ± 0.15 0.77 ± 0.14 0.030 O 47.3 ± 12.7 396.8 ± 118.7 1.19 ± 0.13 1.49 ± 0.21 0.039 O 62.6 ± 19.1 700.1 ± 51.2 1.47 ± 0.23 1.93 ± 0.17 0.069 O 144.3 ± 22.1 1414.6 ± 182.5 2.83 ± 0.38 4.17 ± 0.44 0.106 O 315.0 ± 30.3 2580.4 ± 337.8 4.79 ± 0.56 9.17 ± 0.42 0.020 T6 138.3 ± 24.3 280.3 ± 47.3 2.51 ± 0.23 2.58 ± 0.25 0.030 T6 139.7 ± 11.4 738.3 ± 90.9 3.93 ± 0.25 4.35 ± 0.23 0.039 T6 172.8 ± 20.3 921.2 ± 71.2 5.20 ± 0.32 5.63 ± 0.15 0.069 T6 334.4 ± 58.0 1932.1 ± 231.0 8.87 ± 0.53 10.51 ± 0.58 0.106 T6 415.5 ± 11.8 3621.9 ± 94.9 16.13 ± 0.60 20.05 ± 0.68 yield 33 pk E33 init
E
33 33pk 6.2.1 Compressive StiffnessBy unloading / reloading the samples during the compression experiments we obtained stiffness behavior of the lattice truss for macroscopic core strains up to 30%. Figure 31 shows a representative plot of the normalized,33 E33/
Es
, compressive elasticbehavior for the five relative density samples tested. The compressive stiffness at the 0.0 strain level represents the slope an initial loading line. The data shown in Figure 31 is from samples with the T6 temper. In most cases the lattice trusses exhibited stiffening behavior until the peak load was reached. At greater strain levels the stiffness of the lattice truss decreased consistent with the geometric softening (i.e., development of a plastic hinge) as observed in Fig. 28. The exception to this behavior was for the 10.6% relative density lattice truss, where the truss members are rather stocky. Here a well
defined plastic hinge was not observable for all truss members; instead a mixture of bulging and buckling truss members were found.
Figure 31. The elastic stiffness plotted for a large range of compressive strains. The 0.0 strain values are from the slope of the initial loadings.
Ashby suggested normalization of stiffness and strength properties of cellular materials as a means to examine topological efficiencies [6]. In Figure 31 the stiffness data presented in Table IV is normalized and plotted verses relative density. We show the initial compressive stiffness and the peak stiffness. The initial stiffnesses are observed to scale linearly with relative density. The measurements at the peak load levels are much greater and follow a more non-linear trend. The T6 lattices also have the appearance of being slightly stiffer than the annealed lattices.
Figure 32. The normalized compressive modulus as seen for the five relative density lattices tested. Data is shown for the initial load stiffnesses, and for the peak stiffnesses.
6.2.2 Compressive Yield Strength
A proportional limit was experimentally observed in the stress strain behavior prior to the peak compressive loads sustained by the lattice truss. Figure 33 shows the normalized,
) /(
33
yield Y
, 0.2% yield strength measurements for both heat treatments for the five relative densities tested.
Figure 33. The normalized apparent compressive yield strengths are plotted vs. relative density for both the (a) annealed and (b) age hardened lattice trusses.
6.2.3 Compressive Peak Strength
During the compression experiments the lattice trusses of each heat treatment were observed to continue supporting increased loads until a peak stress was reached. These non-dimensional peak strengths 33 /(Y)
pk
are plotted in Fig. 34.
Figure 34. Predictions and measurements of the peak compressive strength of the (a) annealed and (b) T6 lattice truss cores. Elastic buckling and plastic buckling are
included. The plastic buckling predictions are for both pinned (k = 1) and fixed (k = 2) truss member end conditions.
6.3 Shear Response
Shear properties of the lattice truss core control the onset of sandwich panel failure modes such as shear crimping, general buckling and transverse shear failure [11,22]. Lattices that maximize shear stiffness and strength are therefore important for optimal (minimum weight) panel design [50]. Here we show the shear stress strain response and report the measurements for the shear stiffness, yield and peak strengths of the tetrahedral lattice truss loaded in the minimum strength directions.
Figure 35 shows the representative shear stress-strain behavior for T6 and annealed samples loaded in the 3-1 direction. On a unit cell basis, Fig. 9, this corresponds to one truss member being loaded in compression and other two in tension. The lattice truss displayed elastic-like behavior during the initial loading. This was followed by a macroscopic yielding of the core, whereupon the lattice truss load support continued to increase in until a peak stress was reached, which was observed to correspond with buckling of the compressed truss members. Exceptions to this behavior were found in the = 0.069 and 0.106 samples where bulging of truss members was the predominant form of deformation. In the case of the T6 samples some node debonding of the tensile truss members was also observed. The strain level at which this occurred is indicated in Fig. 35a.
Figure 35. Representative combined shear response in the 3-1 loading direction for the (a) age hardened and (b) annealed tetrahedral lattice trusses. The annealed response inset shows truss yielding occurs after small strains followed by continued increase in load support.
Lattice trusses loaded in the 1-3 directions are shown in Figure 36. This loading orientation places one unit cell truss member in tension and the other two in compression. T6 samples (Fig. 36a) show defined linear elastic behavior followed by observable plastic
yielding of the tensile truss members. Load support continued to increase until a peak was reached. Initiation of truss member rupture occurred shortly after the peak stress level, Fig. 36a, for the T6 samples. These ruptures were observed to occur at various locations along the truss member length independent of relative density. Figure 37 shows photographs of a T6 = 0.039 sample at various stages of deformation.
Figure 36. Representative combined shear response in the 1-3 loading direction for the (a) age hardened and (b) annealed tetrahedral lattice trusses.
(a)
= 0.00
13 = 0.0 MPa(b)
= 0.036
13 = 1.65 MPa(c)
= 0.069
13= 1.52 MPa
(d)
= 0.076
13= 1.39 MPa
(e)
= 0.195
13= 0.40 MPa
Figure 37. Photographs of the 0.039 T6 tetrahedral lattice truss at five selected levels of 1-3 shear. Arrows indicate the loading direction. In (b) the truss is at the peak stress level. Observable rupturing of truss members is seen to initiate by (c). At (d) only the compressed truss members continue to support the shear load.
The annealed shear samples tested in the 1-3 direction (Fig. 36b) sustained large macroscopic strains without initiating rupture of the tensile truss members. For these samples there was a small linear response during initial loading (Fig 36b inset), followed by yielding and increased load support. After large deformations (10 – 40%, increasing with sample relative density) the tensile truss members displayed strain localization (necking) followed by rupture and a decrease in the macroscopic load support. Figure 38 shows photograph of truss member necking (at 34.1% macroscopic strain) seen in the annealed = 0.069 sample.
Figure 38. Photograph of the 0.069 annealed tetrahedral lattice truss at a strain level of 34.1%.
6.3.1 Shear Stiffness
The lattice truss shear stiffness was obtained for various stages of elastic and plastic macroscopic deformation during each experiment. An initial stiffness,
G
13init, was measured from the elastic-like portion of the shear stress strain response. The lattice truss was also periodically unloaded and reloaded to measure the stiffness for increasing macroscopic strain levels. The representative shear stiffness behavior of the lattices isstrain localization
10mm
shown in Figure 37 for the 3-1 and 1-3 test orientations. The data is from annealed samples. The normalized shear stiffness, G13/
Es
vs. the nominal shear strain is plotted with Es = 69 GPa. Stiffness values at the 0.00 strain level are the values obtainedfrom
G
13init. Stiffening behavior similar to the compression experiments was generally not observed for tests with either loading direction or heat treatment. An exception to this was measured for the 10.6% relative density samples, Fig. 39.Figure 39. The normalized lattice truss stiffness measurements shown vs. macroscopic strain. Modulus values at 0.00 strains represent the slopes of the initial loading curves. In Figure 40 the normalized shear stiffness is plotted vs. relative density. The test measurements appeared independent of trends based upon test direction or heat treatment.
Therefore these measurements were combined to generate the statistical result (population size of 8 per relative density) shown.
Figure 40. The normalized shear stiffness measurements vs. relative density.
Experimental data represents the initial shear stiffness,
G
init13, for all test orientations and heat treatments. Error bars are given at the 95% confidence level.6.3.2 Shear Yield Strength
From the plate shear experiments the lattice trusses exhibited proportional limits in their stress strain responses. A 0.2% offset was used to define yield strength values. In Figure 39 we plot the normalized macroscopic shear yield strengths tested in the 3-1 orientation for the T6 (Fig. 41a) and annealed (Fig 41b) samples. Figure 42 shows the results for samples loaded in the 1-3 direction. The yield strengths are normalized by the AA6061 y = 70 MPa for the annealed condition or y = 268 MPa for the T6 condition.
Figure 41. The normalized shear yield strengths from samples tested in the 3-1 orientation are plotted vs. relative density for both the (a) T6 and (b) annealed heat treatments.
Figure 42. The normalized shear yield strengths from samples tested in the 1-3 orientation are plotted vs. relative density for both the (a) T6 and (b) annealed heat treatments.
6.3.3 Peak Shear Strength
Figure 43 plots the peak shear strengths 31 /(Y)
pk
of the annealed and age hardened samples. Figure 44 shows the peak shear strengths for samples tested in the 1-3 orientation.
Figure 43. The normalized peak shear strengths from samples tested in the 3-1 orientation are plotted vs. relative density for both the (a) T6 and (b) annealed heat treatments.
Figure 44. The normalized peak shear strengths from samples tested in the 1-3 orientation are plotted vs. relative density for both the (a) T6 and (b) annealed heat treatments.
Chapter 7
Discussion
This chapter focuses upon evaluating the tetrahedral lattice truss mechanical performance. An analysis of the experimental data is made with the stiffness and strength models presented in Chapter 2. Next, these age hardenable aluminum lattice trusses are compared to lattice trusses made by casting and to those made from non-heat treatable alloys. We also compare the tetrahedral lattice truss mechanical properties and behavior to state-of-art aluminum honeycomb core sandwich panels. In the final section we use the quasi-static mechanical response of the lattices to estimate their performance as impact energy absorbers.7.1 Compressive Properties Analysis
Mechanical tests of the tetrahedral lattice truss out-of-plane compressive response have been performed for samples of five relative densities and two heat treatments. Stress vs. strain plots were developed and the values of lattice truss stiffness (the initial loading stiffness,
E
33init, and the stiffness at near the peak load level,E
33pk) and lattice truss strength (the macroscopic truss yield strength, yield33
, and the compressive peak strength, pk
33
) were measured. We proceed to examine the fit of experimental stiffness and strength to their model predictions.
7.1.1 Compressive Stiffness
In Figure 31 the normalized compressive stiffness vs. the macroscopic compressive strain is plotted for a representative set of the five relative density samples in the T6 condition.
Three distinct trends appear from this figure. Firstly, the initial stiffness,
E
33init., of the lattice truss collapses to a single value when normalized by the Young’s modulus and relative density. Secondly, substantial stiffening of the lattice appears to occur, peaking coincident with the peak load support of the truss. This behavior was found to increase with relative density. Lastly, beyond the peak load the truss members develop plastic hinges and the lattice truss stiffness decreases due to the change in the geometry of the truss core constituents. The exception to this behavior appears in the 10.6% relative density sample where stiffness remained betweenE
33pk = 0.45-0.55 even after large strains. The compressive truss stiffness model given by eqn. (2) predicts that 33 = 0.44when normalized by the Young’s modulus and the relative density of the truss. Figure 31 plots this prediction and the experimental data for each relative density and heat treatment. The experiments show that 33.
init
E
obtains normalized values of 0.06 (13.6% of the predicted value) for the T6 lattice trusses and 0.03 (6.8% of the predicted value) for the annealed lattice trusses. It is believed this is caused by the lattice truss not experiencing a uniform distribution of loads to each truss member. This may be due to non-parallelism between the upper and lower facesheets coupled with a lack of lateral constraint offered by the ASTM-365-00 test configuration. Experimentally this hypothesis is supported by the fact that the truss substantially stiffens until the peak load support is achieved. The stiffening must occur because as the peak load level is approached the majority of truss members are supporting more-or-less equivalent forces. However, in Figure 32 we also observe that the T6 lattice trusses appear stiffer than the annealed lattice trusses. According to the prediction the compressive stiffness of thelattice trusses should be the invariant of their heat treatment. Presently this discrepancy cannot be explained, but we suspect the ASTM-365 test standard may not be appropriate for truss structures.
7.1.2 Compressive Yield Strength
When the lattice trusses were compressed as seen in Figure 28 a macroscopic proportional limit in the stress strain behavior was observed. Consistent with the stress strain behavior of the parent 6061 aluminum alloy, this limit is not well defined, and following convention a 0.2% offset yield strength was designated. This yield strength was then normalized by the yield strength of the parent alloy and by the relative density of the truss sample. In Figure 33 we compare these values to the normalized yield strength prediction given by eqn (4). The lattice truss yield strength is predicted to have linear dependence upon. The experimental results show that a nearly linear trend is present. This demonstrates the model is fairly capable of predicting the lattice truss compressive yield strength knowing only the yield strength of the parent alloy. To increase the fidelity of predicting lattice truss compressive yield strength a power law regression was performed on the experimental data. For the lattice trusses with the T6 heat treatment we find,
09 . 1
33 0.657
yield y (15)
and for lattice trusses in the annealed condition the best fit is given by,
19 . 1
33 1.006
yield y (16)
7.1.3 Compressive Peak Strength
After the proportional limit compressive loads where attained during the experiments, the lattice truss load support continued to increase until a peak load was reached. Fig. 34 shows the normalized measured compressive peak strengths for the samples of relative densities between 2.0 – 10.6%. The predictions of the peak strength are also plotted assuming (i) elastic buckling of the truss members, eqn. (5), and (ii) plastic buckling of the truss members, eqn. (7) with Et calculated from the measured 6061 tensile stress vs. strain curve using a finite difference differentiation and iteration scheme for each truss member thickness to length ratio [37]. In cases (i) and (ii) for the annealed trusses (Fig. 34a), consistent with the deformation mode seen in Fig. 29 we assume that the truss members are built-in at the faces sheets and thus takek 2. The plastic buckling model
is seen to capture the peak compressive strength of all five relative densities. The T6 lattice truss peak strengths are captured with reasonable accuracy when the truss member prediction assumes pinned connections to the facesheets (that isk 1). Moreover, the
lattice peak strengths of the T6 (which has a low strain hardening rate) samples are also captured by the plastic yielding model as eqn. (15) is nearly the same as the analytical prediction give by eqn. (2), while a plastic buckling model fully accounting for the strain hardening of the annealed Al alloy is required to predict the peak compressive strength of the annealed lattice truss. It is worth mentioning that the models over-predict the compressive peak strengths of the low relative density age-hardening tetrahedral trusses. This is thought to be a consequence of two dominant factors. The first is geometric imperfections in the trusses: recall that the knockdown in bifurcation stress due to imperfections is greatest at the transition from the elastic to plastic buckling [22], and the
second is related to fillet mass apportionment which
![Figure 6. Patented Octet Truss by Buckminster Fuller for civil applications [23].](https://thumb-us.123doks.com/thumbv2/123dok_us/692053.2584969/7.918.256.713.562.810/figure-patented-octet-truss-buckminster-fuller-civil-applications.webp)