Response of an Agent-Based Emergency Call
Centre Model to a Sudden Increase in Calls
Bruce G. Lewis and Ric. D. Herbert
Abstract—Emergency services call centre such as the NSW Police Assistance Line use historical data and business rules to determine the staffing requirements for their business queues. However, there are time when exogenous events beyond the control of the organisation cause a sudden increase in the inbound call volume. This can affect one or more of the business queues detrimentally. Using NSWPAL data an experiment was set up to demonstrate how an agent-based computer model can be used to simulate the effect on the call centre performance of a sudden increase in calls.
Index Terms—Agent-based model, call centre, emergency ser-vices, Police Assistance Line.
I. INTRODUCTION
Emergency services call centres are staffed to meet the expected inbound call demand. Rosters for call takers are based on the historical call data and prescribed business needs. These facilities generally meet their business goals.
The NSWPAL is a 24-hour emergency services multi-queue, multi-server, inbound call centre that services the state of New South Wales in Australia and is mainly used for the reporting of both urgent and non-urgent crime and incidents. However, although the rostering of staff for the business queues is based on historical call data and business rules, there are times when unexpected increases in call volumes occur due to exogenous events. In such instances performance levels of one or more queues may fall below expectation.
To examine the performance of the emergency services inbound call centre, an agent-based model has been developed as part of a research project [1]. It was identified that agent based models provide flexibility to model resource allocation without undertaking a complex mathematical approach. [2]. In operation, each time step of the program corresponded to one second of real time. The term Call Taking Agent (CTA) has been used in this paper to distinguish the computer agent from the NSWPAL human Customer Service Representative (CSR). The CTAs in the model were homogeneous with respect to their operating parameters for the queue. This was essential to ensure repeatable results.
Bruce G. Lewis is the retired Technical & Business
Devel-opment Manager of the NSW Police Assistance Line (email:
Ric D. Herbert is a Senior Lecturer at the University of Newcastle Australia in the School of Design, Communication and Information Tech-nology in the Faculty of Science and Information TechTech-nology (email: [email protected]).
ISBN: 978-0-9803267-4-1
Service level, also called service factor, is a common metric used to assess call centre performance [3], [4] and [5]. In [1] seven ways of calculating service level were identified. The method used to calculate service level is at the discretion of the individual businesses, there being no common industry standard. Furthermore the inclusion of abandoned calls in cal-culating service level is also at the discretion of the individual businesses [6]. For the work in this paper the following two were chosen from [1] where the first does not take into account abandoned calls and the second does:
SL2= CAns1 CtAns (1) SL5= CAns1 CtAns+CAb2 (2)
The termsSL2andSL5refer to these equations in [1] and the symbols used in (1) and (2) are shown in Table I.
TABLE I
SYMBOLS USED IN THE SERVICE LEVEL EQUATIONS
CAns1 Calls answered in the service level threshold
CtAns Total number of calls answered
CAb2 Calls abandoned after the service level threshold
The urgent NSWPAL queue and associated call and CSR data were used as the basis for an experiment to examine the response of the model’s service level metric to an exogenous shock to inbound calls. The target service level for this queue is to answer 90% of the calls within 10 seconds.
II. RESPONSE OF THE MODEL TO A SUDDEN INCREASE IN CALLS
This experiment examined the response of the model to a sudden increase in calls or shock. The experiment was based on the events of 6 and 7 July 2007 described in [2].
The results are presented with and without abandoned calls being included using (1) and (2) respectively so that the reader can see the difference between the two methods of calculation. The calls were allocated to the longest waiting CTA.
In this experiment, the model was treated as a continuous system. Consequently, the response figures show the cumula-tive service level throughout the simulation period and not the
weighted average for successive periods identified in [7]. It is important to note that the model has no memory of past time periods. So, since the aim of this experiment was to examine the models response to an input shock, the first block of 900 steps started from a ideal situation of 100% service level. Another aim of the experiment was to regain the target service level of 90% calls being answered in 10 steps using additional CTA resources and the timing of their introduction. However, in attempting this, it must be borne in mind that in a real call centre staff resources are limited with respect to staffing.
Table II shows the NSWPAL call and performance data and inputs for the simulation analysis period including:
• the historical means for Friday nights between 22:30 and
23:30. Each of these time markers represents the start of a 15 minute block,
• the calls entered into the Triple Zero (000) queue between
22:30 and 23:30 on Friday 6 July 2007,
• the number of calls entered as a proportion of the 4 year
Friday mean. This was used to specify the size of the shock in the model,
• the number of CSRs scheduled for the Triple Zero (000)
queue, and
• the resulting service level. In particular, Row 7 of Table
II shows service levels of 0% for the Experiment 3 simulation period.
The experiment was run for 3 contiguous blocks of 900 steps. For consistency, it was decided to select these blocks with a similar number of four year mean calls from Row 2 of Table II so the period 23:00 to 23:30 was chosen as a basis for the experiment. The simulation time scale of 2,700 steps was divided in to three equal sections of 900 steps with the second block having the sudden increase in calls. The first and third sections were set to 40 calls each and the second section was set to 80 calls. The value of 80 resulted from an increase by a factor of 2 in accordance with Row 5 of Table II at time 23:15. The resulting distribution of calls is shown in Fig. 1.
0 300 600 900 1200 1500 1800 2100 2400 2700
0 1
Call time markers
Times at which calls were created
Fig. 1. Experiment 3: Distribution of calls with unexpected increase between 900 and 1,800 steps.
Using the model with input values from Table III, it was de-termined that 16 CTAs would be required to produce a service level of more than the target throughout a 900 step simulation period when 40 calls were entered. However, Table II shows that 17 CSRs were scheduled for the Triple Zero (000) queue for the three 15 minute periods of 11 pm to 11:45 pm and so
this figure was used for this experiment.
When using 80 calls in a 900 step period in the model, it was determined that 32 CTAs were needed to produce a service level of more than the target throughout a 900 step simulation period. However, for the same period, on 6 July 2007, the NSWPAL data showed that 12 CSRs were scheduled on the non-urgent queue. Since it is impractical to have an additional 16 staff on hand at this time on a Friday night for the urgent queue, it was decided to use an additional 3, 5 and 7 CTAs for the experiment and introduce these CTAs at time steps 1,200 and 1,500. In practice, these agents would transfer from the non-urgent queue to service the increased load in the urgent queue.
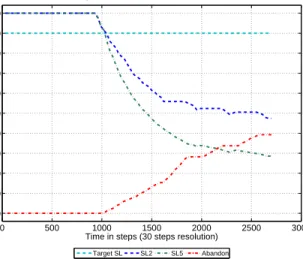
Fig. 2 shows the results of running the model with the increase in calls and no additional CTAs. Prior to the increase in calls in the period up to step 900, the service level was 100%. Then the service level dropped quickly over the period 900 to 1800 steps. Equation (2) gave a more optimistic result than (1).
During the period 900 to 2,700 steps, the abandon level increased at a near linear rate to the unacceptable level of 40% of the entered calls and by the end of the simulation period the service level dropped below 50% for both methods of calculation. 0 500 1000 1500 2000 2500 3000 0 10 20 30 40 50 60 70 80 90 100
Time in steps (30 steps resolution)
% Service level or % Calls abandoned
Simulation: Urgent Model
Simulation time Vs Service Level and Abandoned Calls Service level equations SL2 and SL5 Service Level = 90% calls answered in 10 steps Steps = 2700, No. calls = 120, Call spacing = 22 steps, CTAs = 17
Steps: Talk start = 141, Talk step = 1, Talk end = 141 Steps: tPick up = 7, tACW = 184, Intercall delay = 10, tAbandon = 46
Longest wait CSR call allocation method.
Target SL SL2 SL5 Abandon
Fig. 2. Experiment 3: The model response to a shock with no additional
CTAs.
To improve this situation, additional resources were added. However, the question arose as to when was the best time to add these. In the real call centre situation this is decided by the real time managers on duty.
TABLE II
CALL ANDCSRDATA USED FOREXPERIMENT3.
Row 1 Time (hh:mm): 22:30 22:45 23:00 23:15 23.30
Row 2 Friday 4 year mean calls entered : 37 38 41 40 40
Row 3 NSWPAL data for Friday 6 July 2007 Triple Zero (000) queue
Row 4 No. calls entered : 37 66 75 79 54
Row 5 No. calls entered normalised to the 4 year
Friday mean in Row 2:
1.0 1.7 1.8 2.0 1.4
Row 6 No. CSRs scheduled : 16 16 17 17 17
Row 7 Service level : 70% 0% 0% 0% 50%
TABLE III
EXPERIMENT3INPUT VALUES.
†
Queue: Urgent
Service level target: 90% calls answered within 10 steps
Simulation period: See text
No. calls in 900 step quiescent state: 40
No. calls in 900 step shock state: 80
Shock start time: Step 900
Shock end time: Step 1,800
Number of CTAs: 17 initial, then 3, 5 and 7, see text
Pick up time: 7 steps
Talk time: 141 steps
ACW time: 184 steps
Abandon time: 46 steps
Make ready/inter-call delay time: 10 steps
CTA call allocation method: Longest waiting CTA
TABLE IV
EXPERIMENT3: SERVICE LEVEL RESULTS DURING THE SHOCK PERIOD WITH NO ADDITIONALCTAS.
Step: 900 1200 1500 1800
Equation (1): 100% 78.2% 61.4% 55.8%
Difference from target: +10% -11.8% -28.6% -34.2%
Incremental change: -11.8% -16.8% -5.6%
Equation (2): 100% 67.2% 47.3% 36.4%
Difference from target: +10% -22.8% -42.7% -53.6%
Incremental change: -22.8% -19.9% -10.9%
For this experiment the decision was made by referring to Table IV which shows the service levels during the shock period at steps 900, 1,200, 1,500 and 1,800 when no additional CTAs were provided for the extra call load. Equation (1) was used as a basis for the decision as this method is used by the NSWPAL. Between 900 and 1,200 steps the service level dropped 11.8% from the 90% target to 78.2%, between 1,200 and 1,500 steps the drop was 16.8% to 61.4% and between 1,500 and 1,800 steps the drop was 5.6% to 55.8%.
The greatest change in service level occurred between 900 and 1,500 steps where the drop was 28.6% from the 90% target to 61.4%. In real terms this represented 10 minutes into the shock period and by that time the real time managers would have rearranged the call taking resources.
Two scenarios were examined where additional CTAs were introduced at steps 1,200 and 1,500.
A. Additional CTAs at step 1,200
A sudden drop of 11.8% at step 1,200 would alert the real time manager to consider staffing options for the falling service level. In practice the real time manager would see an increase in the number of waiting calls and start making plans to rearrange the staffing. So for this part of the experiment 3, 5 and 7 CTAs were added at step 1,200. The results are shown in Fig. 3. The addition of 3 and 5 CTAs lessened the decline and did not improve the service level within the simulation time frame. This can be seen in Figs. 3(a) and 3(b). The addition of 7 CTAs at step 1,200 again lessened the service level decline. However, after the shock period had passed beyond step 1,800 the service level began to rise. This is shown in Fig. 3(c). These figures also show the number of CTAs throughout the process to readily identify the time step at which a change in performance is due. This facility is included in the remainder of this and in the next section.
B. Additional CTAs at step 1,500
The experiment was repeated with the CTAs added at step 1,500. This could occur if was not possible to provide additional staff due to the workload of the non-urgent queue and it was necessary to wait for it to be cleared.
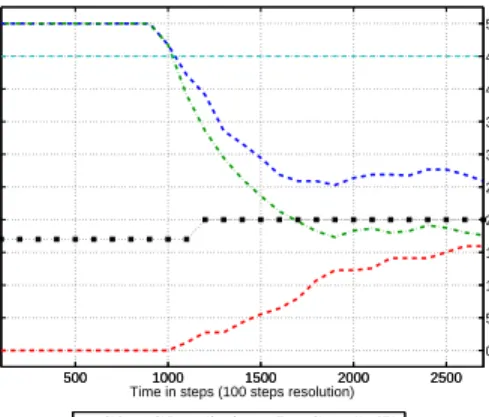
The results are shown in Fig. 4. When 3 and 5 CTAs were added at step 1,500, there was a small increase in service level before it fell away after step 2,100. This can be seen in Figs. 4(a) and 4(b). When 7 CTAs were added, the performance rose slowly and consistently towards the service level target as shown in Fig. 4(c).
C. Extended simulation period
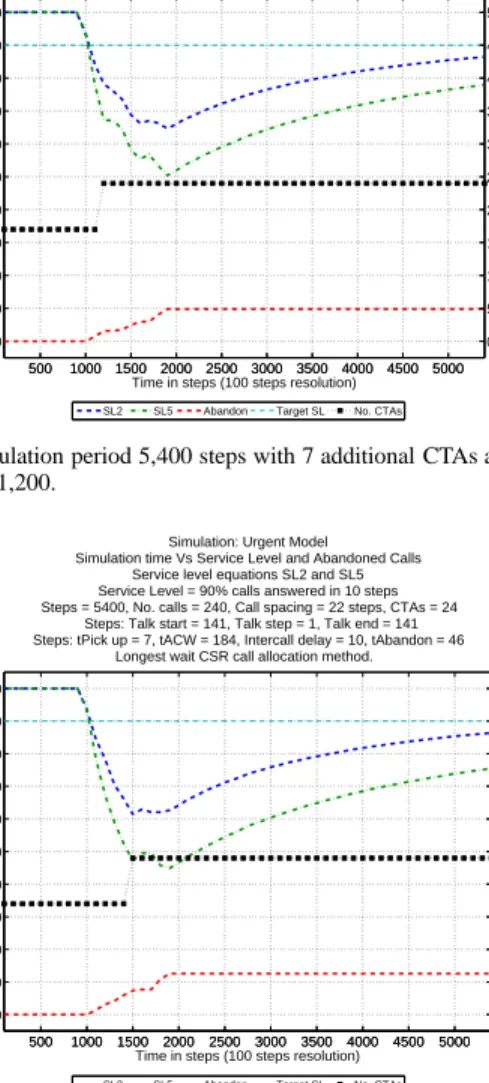
To gauge the service level recovery time constant and to see if the service level would return to the target value, the experiment was repeated over 5,400 steps with the 7 additional CTAs being added at steps 1,200 and 1,500. The call rate post shock per 900 step period was held constant at 40 calls. With reference to Fig. 5 the service level when calculated using (1) had not reached the 90% target by the end of the simulation period, remaining below 90% at 86.4%. The result of introducing the additional CTAs at step 1,200 can be seen in Fig. 5(a) and showed a slight improvement compared to their introduction at step 1,500 as seen in Fig. 5(b). In neither case did the service level return to the target. In both cases the abandon rate levelled out to a constant value.
III. CONCLUDING REMARKS
An experiment was run for a simulated 45 minute period, or 2,700 steps, with a shock of twice the initial call load being applied to the middle 900 step period to examine the model’s service level response.
The results demonstrated that when the shock was applied with no increase in call taking staff there was a rapid decline in service level accompanied by a rise in abandon rate. The service level did not increase after the shock had ceased and the abandon rate started to level out with no reduction.
500 1000 1500 2000 2500 0 10 20 30 40 50 60 70 80 90 100
Time in steps (100 steps resolution)
% Service level & % Calls abandoned
500 1000 1500 2000 2500 0 5 10 15 20 25 30 35 40 45 50 No. CTAs
Simulation: Urgent Model Simulation time Vs Service Level and Abandoned Calls
Service level equations SL2 and SL5 Service Level = 90% calls answered in 10 steps Steps = 2700, No. calls = 120, Call spacing = 22 steps, CTAs = 20
Steps: Talk start = 141, Talk step = 1, Talk end = 141 Steps: tPick up = 7, tACW = 184, Intercall delay = 10, tAbandon = 46
Longest wait CSR call allocation method.
SL2 SL5 Abandon Target SL No. CTAs
(a) Three additional CTAs added at step 1,200.
500 1000 1500 2000 2500 0 10 20 30 40 50 60 70 80 90 100
Time in steps (100 steps resolution)
% Service level & % Calls abandoned
500 1000 1500 2000 2500 0 5 10 15 20 25 30 35 40 45 50 No. CTAs
Simulation: Urgent Model Simulation time Vs Service Level and Abandoned Calls
Service level equations SL2 and SL5 Service Level = 90% calls answered in 10 steps Steps = 2700, No. calls = 120, Call spacing = 22 steps, CTAs = 22
Steps: Talk start = 141, Talk step = 1, Talk end = 141 Steps: tPick up = 7, tACW = 184, Intercall delay = 10, tAbandon = 46
Longest wait CSR call allocation method.
SL2 SL5 Abandon Target SL No. CTAs
(b) Five additional CTAs added at step 1,200.
500 1000 1500 2000 2500 0 10 20 30 40 50 60 70 80 90 100
Time in steps (100 steps resolution)
% Service level & % Calls abandoned
500 1000 1500 2000 2500 0 5 10 15 20 25 30 35 40 45 50 No. CTAs
Simulation: Urgent Model Simulation time Vs Service Level and Abandoned Calls
Service level equations SL2 and SL5 Service Level = 90% calls answered in 10 steps Steps = 2700, No. calls = 120, Call spacing = 22 steps, CTAs = 24
Steps: Talk start = 141, Talk step = 1, Talk end = 141 Steps: tPick up = 7, tACW = 184, Intercall delay = 10, tAbandon = 46
Longest wait CSR call allocation method.
SL2 SL5 Abandon Target SL No. CTAs
(c) Seven additional CTAs added at step 1,200.
Fig. 3. Experiment 3: Results for 3, 5 and 7 additional CTAs at time step
500 1000 1500 2000 2500 0 10 20 30 40 50 60 70 80 90 100
Time in steps (100 steps resolution)
% Service level & % Calls abandoned
500 1000 1500 2000 2500 0 5 10 15 20 25 30 35 40 45 50 No. CTAs
Simulation: Urgent Model Simulation time Vs Service Level and Abandoned Calls
Service level equations SL2 and SL5 Service Level = 90% calls answered in 10 steps Steps = 2700, No. calls = 120, Call spacing = 22 steps, CTAs = 20
Steps: Talk start = 141, Talk step = 1, Talk end = 141 Steps: tPick up = 7, tACW = 184, Intercall delay = 10, tAbandon = 46
Longest wait CSR call allocation method.
SL2 SL5 Abandon Target SL No. CTAs
(a) Three additional CTAs added at step 1,500.
500 1000 1500 2000 2500 0 10 20 30 40 50 60 70 80 90 100
Time in steps (100 steps resolution)
% Service level & % Calls abandoned
500 1000 1500 2000 2500 0 5 10 15 20 25 30 35 40 45 50 No. CTAs
Simulation: Urgent Model Simulation time Vs Service Level and Abandoned Calls
Service level equations SL2 and SL5 Service Level = 90% calls answered in 10 steps Steps = 2700, No. calls = 120, Call spacing = 22 steps, CTAs = 22
Steps: Talk start = 141, Talk step = 1, Talk end = 141 Steps: tPick up = 7, tACW = 184, Intercall delay = 10, tAbandon = 46
Longest wait CSR call allocation method.
SL2 SL5 Abandon Target SL No. CTAs
(b) Five additional CTAs added at step 1,500.
500 1000 1500 2000 2500 0 10 20 30 40 50 60 70 80 90 100
Time in steps (100 steps resolution)
% Service level & % Calls abandoned
500 1000 1500 2000 2500 0 5 10 15 20 25 30 35 40 45 50 No. CTAs
Simulation: Urgent Model Simulation time Vs Service Level and Abandoned Calls
Service level equations SL2 and SL5 Service Level = 90% calls answered in 10 steps Steps = 2700, No. calls = 120, Call spacing = 22 steps, CTAs = 24
Steps: Talk start = 141, Talk step = 1, Talk end = 141 Steps: tPick up = 7, tACW = 184, Intercall delay = 10, tAbandon = 46
Longest wait CSR call allocation method.
SL2 SL5 Abandon Target SL No. CTAs
(c) Seven additional CTAs added at step 1,500.
Fig. 4. Experiment 3: Results for 3, 5 and 7 additional CTAs at time step
500 1000 1500 2000 2500 3000 3500 4000 4500 5000 0 10 20 30 40 50 60 70 80 90 100
Time in steps (100 steps resolution)
% Service level & % Calls abandoned
500 1000 1500 2000 2500 3000 3500 4000 4500 5000 0 5 10 15 20 25 30 35 40 45 50 No. CTAs
Simulation: Urgent Model Simulation time Vs Service Level and Abandoned Calls
Service level equations SL2 and SL5 Service Level = 90% calls answered in 10 steps Steps = 5400, No. calls = 240, Call spacing = 22 steps, CTAs = 24
Steps: Talk start = 141, Talk step = 1, Talk end = 141 Steps: tPick up = 7, tACW = 184, Intercall delay = 10, tAbandon = 46
Longest wait CSR call allocation method.
SL2 SL5 Abandon Target SL No. CTAs
(a) Simulation period 5,400 steps with 7 additional CTAs added at step 1,200. 500 1000 1500 2000 2500 3000 3500 4000 4500 5000 0 10 20 30 40 50 60 70 80 90 100
Time in steps (100 steps resolution)
% Service level & % Calls abandoned
500 1000 1500 2000 2500 3000 3500 4000 4500 5000 0 5 10 15 20 25 30 35 40 45 50 No. CTAs
Simulation: Urgent Model Simulation time Vs Service Level and Abandoned Calls
Service level equations SL2 and SL5 Service Level = 90% calls answered in 10 steps Steps = 5400, No. calls = 240, Call spacing = 22 steps, CTAs = 24
Steps: Talk start = 141, Talk step = 1, Talk end = 141 Steps: tPick up = 7, tACW = 184, Intercall delay = 10, tAbandon = 46
Longest wait CSR call allocation method.
SL2 SL5 Abandon Target SL No. CTAs
(b) Simulation period 5,400 steps with 7 additional CTAs added at step 1,500.
Fig. 5. Experiment 3: Service level recovery test results for 7 additional
CTAs at time steps 1,200 and 1,500 over a 5,400 step period.
Depending on the number of additional CTAs added and the time at which they were added, the model’s service level varied from no recovery to a slow recovery time constant.
To examine the long-term result, the experiment was run for an extended time of 5,400 steps which corresponded to 90 minutes of real time. This resulted in the service level not recovering to its target value and the abandon rate rising to a constant value. The same number of additional CTA resources were added at two different times with the earlier addition providing a slightly improved result. However, in neither case did the service level return to its target level nor did the abandon rate fall.
In practice, call centre supervisors will not have a large number of additional staff on hand to service unexpected
exogenous events. Furthermore there will necessarily be a delay between the impact of the increase in calls and when whatever resources are available can be used due to other business queues, and the availability of other staff. This experiment supports the statement by [8] that ‘managers can only have a small influence on short-term performance’.
IV. ACKNOWLEDGMENTS
The authors would like to thank the NSW Police Force and the Director of the Police Assistance Line who support this research.
REFERENCES
[1] B. G. Lewis, “A parsimonious agent-based emergency call centre model,” Master’s thesis, Design, Communications and Information Technology, University of Newcastle, Australia, March 2011.
[2] B. G. Lewis, R. D. Herbert, P. F. Summons, and W. J. Chivers, “Agent-based Simulation of a Multi-queue Emergency Services Call Centre to Evaluate Resource Allocation,” in MODSIM 2007, International
Congress on Modelling and Simulation., L. Oxley and D. Kulasiri,
Eds., Modelling and Simulation Society of Australia and New Zealand. http://www.mssanz.org.au/MODSIM07/authorsL-M.htm: Modelling and Simulation Society of Australia and New Zealand, dec 2007, pp. 11–17. [3] N. Gans, G. Koole, and A. Mandelbaum, “Telephone Call Centers: Tutorial, Review, and Research Prospects,” Manufacturing and Service
Operations Management, vol. 5, no. 2, pp. 79–141, Spring 2003.
[4] C. Hishinuma, M. Kanakubo, and T. Goto, “An Agent Scheduling Opti-mization for Call Centers,” in 2007 IEEE Asia-Pacific Service Computing
Conference. IEEE, 2007, pp. 423–430.
[5] R. Saltzman and V. Mehrotra, “A Manager-friendly Platform for Sim-ulation Modeling and Analysis of Call Center Queuing Systems,” in
Proceedings of the 2004 Winter Simulation Conference, R. G. Ingalls,
M. D. Rossetti, J. S. Smith, and B. A. Peters, Eds., IEEE. IEEE, 2004,
pp. 466–473.
[6] V. Mehrotra and J. Fama, “Call Center Simulation Modelling: Methods Challenges and Opportunities,” in Proceedings of the 2003 Winter
Simu-lation Conference, S. Chick, P. J. Sanchez, D. Ferrin, and D. J. Morrice,
Eds. IEEE, 2003, pp. 135–143.
[7] G. Koole, “Call Center Mathematics: A Scientific Method for Under-standing and Improving Contact Centers,” Reviewed on 15 May 2010
from http://www.few.vu.nl/∼koole/ccmath/book.pdf, jan 2007.
[8] A. Betts, M. Meadows, and P. Walley, “Call Centre Capacity Manage-ment,” International Journal of Service Industry Management, vol. 11, no. 2, pp. 185–196, 2000.