Energy transport inside a three-phase electrode and
application to a proton-conducting solid oxide
electrolysis cell
Mika¨
el Dumortier, Jos´
e Sanchez, Michel Keddam, Olivier Lacroix
To cite this version:
Mika¨
el Dumortier, Jos´
e Sanchez, Michel Keddam, Olivier Lacroix.
Energy transport
in-side a three-phase electrode and application to a proton-conducting solid oxide
electroly-sis cell.
International Journal of Hydrogen Energy, Elsevier, 2013, 38 (6), pp.2610-2623.
<
10.1016/j.ijhydene.2012.12.044
>
.
<
hal-00846374
>
HAL Id: hal-00846374
http://hal.upmc.fr/hal-00846374
Submitted on 12 Mar 2015
HAL
is a multi-disciplinary open access
archive for the deposit and dissemination of
sci-entific research documents, whether they are
pub-lished or not.
The documents may come from
teaching and research institutions in France or
abroad, or from public or private research centers.
L’archive ouverte pluridisciplinaire
HAL, est
destin´
ee au d´
epˆ
ot et `
a la diffusion de documents
scientifiques de niveau recherche, publi´
es ou non,
´
emanant des ´
etablissements d’enseignement et de
recherche fran¸
cais ou ´
etrangers, des laboratoires
publics ou priv´
es.
Energy transport inside a three-phase electrode and application to a proton conducting solid oxide electrolysis cell
Mikaël Dumortiera,c,*, José Sancheza, Michel Keddamb, Olivier Lacroixc
aInstitut Européen des Membranes - Université de Montpellier 2, CC 047, 2 Place Eugène Bataillon, 34095 Montpellier Cedex 5, France bUPMC-CNRS, Laboratoire Interfaces et Systèmes Electrochimiques, cc 133, 4 place Jussieu, 75252 Paris Cedex 5, France
cAREVA NP, Centre Technique, UM2 Place Eugène Bataillon Bâtiment 13- 2ème étage 34 095 Montpellier Cedex 5, France
* Corresponding author. Tel.: +33 46714929; fax: +33 467149235. E-mail address: mikael.dumortier@gmail.com (M.
Abstract
This work focuses on the modelling of thermal processes inside a planar high temperature steam electrolyzer that use cermets as electrodes. While the continuity equation for mass and charge have been demonstrated in a previous publication, energy balance for thermal transfers inside the electrode assembly is established via a control volume method. A non-dimensional number is built from different criterion used in the literature in order to validate the local thermal equilibrium assumption (LTE) inside the porous electrodes. A parametric analysis is carried out on a proton-conducting solid oxide electrolysis cell in galvanostatic mode. The results show that the heat sources are mainly ohmic and that their locations are not dependent on inlet current and inlet velocity of gases. This observation allows us to build an original thermal resistance network in order to analytically evaluate the temperature inside each component of the cell. This modelling strategy reduces computation time, allows reverse physical analysis and gives a precise estimation on the maximum temperatures attained in the components of the cells.
Nomenclature
cp Specific heat capacity at constant pressure (J K-1 kg-1)
dp Pore diameter (m)
e Width of the electrode (m)
F Faraday constant (C mol-1) hg Specific enthalpy (J K-1 kg-1)
hth(i-j) Heat transfer coefficient between phase i and j (W K-1 m-2)
H Local thermal equilibrium criterion (dimensionless)
I Applied electric current (A)
ir Volumetric transfer current (A m-3)
j Charge flux density (A m-2) J Inlet current density (A m-2)
L Channel characteristic length (m)
Mg Mean molar mass of the gas (kg mol-1)
n
Normal vector (dimensionless)n Refractive index (dimensionless)
pjoule Volumetric power source released by Joule’s effect (W m-3)
pchim Volumetric power source released by thermodynamical effects (W m-3)
P Total pressure (Pa)
Pr Prandtl number (dimensionless)
q Heat flux (W m-2)
Q Heat release (W)
R Ideal gas constant (J mol-1 K-1) Rth Thermal resistance (K W-1)
Re Reynolds Number (dimensionless)
s Surface fraction (dimensionless)
T Local temperature (K)
u
Velocity vector (m s-1)umean Mean velocity of the fluid inside the cermet (m s-1)
U Velocity magnitude (m s-1)
V Volume of the control volume (m3)
ε Volumetric fraction (dimensionless)
∆rS Molar entropy of reaction (J K-1 mol-1)
η Overpotential (V)
λ Thermal conductivity (W m-1 K-1)
νox, νred Stoichiometric coefficient for the oxidizer and the reducer (dimensionless)
ρg Gas density (kg m-3)
σ Electrical conductivity (S m-1)
σ Stefan Boltzmann constant (W m-2 K-4) Numerical analysis
Del operator
d Differential operator
Indexes and subscripts
a variable attached to the anode c variable attached to the cathode ch variable attached to a channel ce variable attached to a cermet conv used for convection heat transfer
cond used for conduction heat transfer exch used for interfacial heat transfer rad used for radiation heat transfer
e variable attached to the metallic phase or to charge carried by electrons eq equivalent property
g variable attached to the gas phase
io variable attached to the ceramic phase or to charge carried by ions i variable attached to phase i
j variable attached to phase j
TP variable attached to the triple phase boundary 0 reference quantity
Abbreviations
HTE High Temperature Electrolysis LTE Local Thermal Equilibrium SOEC Solid Oxide Electrolysis Cell SOFC Solid Oxide Fuel Cell
1 Introduction
High temperature electrolysis of water by using proton conducting ceramic membranes is an innovative and attractive process for producing pure hydrogen. This process, which can be carried out without noble catalysts, consumes less electricity than classical low temperature electrolysis in aqueous medium. The electrolytic membrane reactor is composed basically of an anode and a cathode compartment, separated by a dense solid oxide membrane made of perovskite. This electrode assembly is commonly referred as the Positive electrode/Electrolyte/Negative electrode system (PEN).Water vapour is fed into the anode compartment and hydrogen is produced at the cathode with the recombination of protons conducted through the electrolyte (Fig.1). Thus it is not necessary to separate water and hydrogen in contrast to oxygen conducting high temperature electrolysis cells. In both compartments, the electrochemical reaction takes place inside cermets at high temperature (500 to 600 °C) and pressure (10 to 20 bar) [1]. Cermets are porous composite materials made of a mixture of solid oxides and metal: the metal ensures electron transport; protons are transferred through solid oxides and gases flow through porosity (voids). The chemical reaction occurs at the junction of the three phases: metal, oxide and gas, called the triple phase boundary.
Fig. 1 – Principle of a proton conducting solid oxide electrolysis cell (SOEC).
The study of transport of transfer phenomena inside those electrolyzers is closely related to the study of solid oxide fuel cells (SOFC) and anion conducting solid oxide electrolysis cells. They all operate under hard operating conditions (1-10 bars, 500-1000°C), uses gases as reactants and porous media as electrodes. As a consequence, detailed in situ measurements during operation are very difficult to perform in those devices. Therefore, numerous numerical models for fuel cells and electrolyzers have been developed in the past two decades in order to acquire by calculation the operating conditions inside such membrane reactors [2-9]. Among the topics studied by modelling, temperature management inside high temperature electrolyzers and fuel cells is a key issue. Indeed, accurate temperature prediction within solid oxide cells is essential for calculating and optimizing the overall
cell performance since the material properties, chemical kinetics, and transport properties depend on temperature [5].
Moreover, the operating temperature determines the nature of charge carriers in the electrolyte. For example, proton conducting solid oxide cells operate at below 600°C, while anion conducting oxide cells operate at above 600°C. A change in temperature can modify the type of charge carriers inside the electrolyte, hence switching the technology of the electrolyzer from one to another [10]. Furthermore, strong temperature gradients can also cause thermo-mechanical degradation, such as delamination in the PEN, whose harmful incidence on the performance of the system was investigated by Xinfang and Xingjiang in 2010 [11]. Electrode material can also be damaged under high temperature gradients or thermal fatigue, allowing the hydrogen to mix with oxygen. This can be very dangerous as the auto-ignition temperature of hydrogen is close to the operating temperature of these electrolyzers [12]. Therefore, temperature monitoring is an important issue not only for the electrolyzer performance, but also for safety considerations.
Among the numerous models available to simulate the working operation of such membrane reactors, some consider the process as isothermal [13-18] and mainly investigate on the effects of mass transfer on the performance of the cell. Other models take heat generation and transfer into account [4, 11, 19-32] in order to evaluate the temperature in the cell and the influences of thermal effects. The planar design is the most studied , but other design are studied such as the tubular design [25, 30] and the monolithic design [26]. The cell is generally divided cell into several subsystems in order to treat them with a specific set of equations: the gas channels, the porous electrodes, the interconnectors and the electrolyte.
A large majority of studies include heat convection and heat conduction in the PEN and in the channel, as well as heat generation caused by ohmic heat loss and by the electrochemical reaction. However, including radiation transfer inside heat transfer models is a subject of debate that has led to the production of numerous studies [2]. Indeed, radiation transfer inside solid oxide cells entailed a number of challenges in terms of modelling. First, the governing equations are integrodifferential and depend on time and many geometric variables, which lead to increased computational calculation time.
Code de champ modifié
Code de champ modifié
Code de champ modifié
Code de champ modifié
Code de champ modifié Code de champ modifié Code de champ modifié Code de champ modifié Code de champ modifié Code de champ modifié Code de champ modifié
In addition, the electrolyte and the porous electrode are semi-transparent materials, whose optical properties are generally difficult to determine accurately [23]. In addition, the effects of radiation appear to be very design-dependent: in 2007, Calise et al [33] showed that radiation transfer contributes to a large majority of heat transfer inside tubular designs. For planar systems, Damm and Fedorov have conducted an analysis which concluded that radiation transfer could be safely neglected [34] for thick and opaque electrodes. Other studies also concluded that heat radiation effects could be neglected in planar geometries [31]. On the contrary, other studies think radiation heat transfer must be considered in SOFC modelling [4]. Finally, transient analysis has been performed by some groups [35]. In 2005, Damm and Fedorov published a transient thermal model [36] showing the influence of temperature rise during startup/shutdown of the system. Their analysis also provided a characteristic time for startup, and a criterion to evaluate the maximum spatial and time thermal gradient in the cell. Finally, Sunil Murthy and Andrei G. Fedorov [26] developed in 2003 a simplified radiation model that was tested on a monolith cell design in order reduce the computational cost by 10 times.
However, the majority of studies focus their work on the variations of temperature, concentration and current density on the directions of the flow, which is often parallel to the electrode. Although the PEN is considered as a volumetric electrode, only a few studies [35, 37-39] have given interest on the temperature variation on the direction perpendicular to the electrode, where strong temperature gradients can occur. Moreover, the reaction is generally supposed to occur in an active layer close to the interface with the electrolyte [5, 23]. However, our team [40] previously showed that this assumption is valid under certain conditions : low ionic conductivity of ceramics, no limitation in the diffusion of species inside the electrode, metal grains radius not too large compared to ceramic grain radius. Our previous model also allowed predicting reaction profiles inside the electrodes. A reasonable question would be to know whether the reaction profile have an influence on heat release. While models consider the porous medium as an equivalent medium with specific properties, other models deal separately with the energy transport inside the fluid and the solid phase. While those models are more descriptive and general, the equivalent medium models are supported by simplifying assumptions, such as the local thermal equilibrium (LTE) inside the PEN, thus disregarding the heat
Code de champ modifié Code de champ modifié
Code de champ modifié Code de champ modifié Code de champ modifié Code de champ modifié Code de champ modifié
Code de champ modifié
Code de champ modifié Code de champ modifié
Code de champ modifié Code de champ modifié Code de champ modifié
transfer by radiation. It has become relevant to investigate whether these phenomena should be considered inside the porous electrodes of a high temperature electrolyzer.
Another general issue of modelling is time calculation. The use of complex, computational time consuming models is not suitable for the performance prediction of larger systems such as stacks [19]. Therefore, it becomes necessary to find assumptions that simplify those models and reduce the resources required to perform calculations. It is however crucial to clearly define the scope in which those assumptions are valid. Another challenge for future solid oxide cells modelling development is the concept of inverse physics modelling, where the parameters of the process and microstructure of the electrode are calculated from the system requirements [41]. This requires the building of analytical relationship between variables that do not require the help of numerical simulation to be solved.
The work presented in this paper focuses on planar solid oxide cells with electrodes made of cermets. The study is divided into three parts. In the first part, a continuity equation for thermal transfers inside the PEN in steady state is demonstrated. The assumptions for the establishment of this equation are checked with regards to the results of the literature. In the second part, the model is completed with a continuity equation set developed previously by our group for the description of transport phenomena inside a proton conducting high temperature electrolyzer [40]. Few models have investigated on the thermal management of solid oxide electrolyzer [11, 20, 29], therefore the proposed model is tested throughout a parametric analysis inside the PEN of a proton-conducting cell in galvanostatic mode. The parameters tested are the inlet velocity of gases and inlet current density. The results of this analysis allow modelling the thermal behaviour of the PEN as a thermal resistance network, which is presented in the third part. This analytical model reduces computing costs and offers the opportunity to do inverse physics modelling. One result of this inverse modelling is to state whether the process should be considered isothermal as regards to the operating conditions.
2 Modelling
Code de champ modifié
Code de champ modifié
Code de champ modifié Code de champ modifié Code de champ modifié Code de champ modifié
The electrodes studied in this paper are based on cermets, which are considered to be among the most efficient candidates as electrode material for high-temperature steam electrolysis [42]. A cermet is a mixed media made of three phases: an electron-conducting phase, which is usually a metal, an
ion-conducting phase, which is usually a ceramic, and a gas phase filling the voids between solids allowing the transport of reactants and reaction products (Fig. 2). The metallic and ceramic phases are motionless and the charge inside these solids is transported by migration. On the contrary, the gas phase does not carry any charge but transports chemical species by diffusion and convection. These transport phenomena inside the PEN are modelled mathematically by continuity equations obtained by applying the so-called volume averaging method [43] to a representative volume of electrode. Continuity equations for charge and mass transfers have been derived by our group in a previous publication [40]; as explained earlier, this paper focuses on the conservation of energy inside a PEN made of cermet.
Fig. 2 – The different phases of the cermet medium.
Heat transfers occur inside the fluid phase and the solid phase of the cermet. Even if the description of heat transfer is quite simple inside the solid phase, it is much more complex inside the fluid phase. Hence, several assumptions have been made:
Steady state.
Because of low values of flow velocities and associated pressure gradient in the cermet and low dynamic viscosities of gas, compressibility effects and viscous dissipation are neglected.
Code de champ modifié
Code de champ modifié
Thermal effects due to the mixing of gaseous species are neglected.
Gravity effects are neglected.
2.1 Fluxes and sources
In the phase i (metal, ceramic or gas), heat is exchanged or transported by several mechanisms, expressed by heat fluxes (in W m-2):
Convection flux inside the gas: (1)
Conduction flux inside the solid and the gas: (2)
Interfacial heat exchange with the solid j: (3) Inside charge conductors, heat is released by Joule’s effect (in W m-3):
Joule effect inside the solid i: (4)
In the fluid phase, the main heat sources come from the chemical reaction and thermal effects associated to the electronic transfers caused by the electrochemical reaction at the triple phase. We can assume that this source is produced inside the reactive volume and released inside the fluid phase. Using the same demonstration process as featured by Coeuret [44], we can express the volumetric heat source pchim at the triple points as:
Electrochemical heat source: (5)
This volumetric source can be divided into two contributions:
ir η accounts for the irreversibility caused by the charge transfer from one conductor to another [21]. It is in the form of a “Joule effect of the reaction” and is always positive. η is the overpotential defined by the generalized Butler-Volmer law.
represents the electrical energy that is not utilized by the reaction. It accounts for thermodynamic losses that cannot be prevented during the process where ∆rS is the molar entropy of reaction.
Code de champ modifié
Finally, the heat radiation flux inside the PEN can be modelled as following:
(6)
σis the Stefan Boltzmann constant (5.67×10⁻⁸ W m-2 K4), ni is the refractive index of the medium. Also, Damm and Fedorov [34] have shown that the thermal radiation inside what? for thick PEN could be modelled by a heat conduction equation. They further demonstrated that radiation transfer between the PEN and other components of the cell could be neglected in planar systems because the thermal conductivity of the electrodes representing radiative heat transfer is much smaller than their overall thermal conductivity.
2.2 Local thermal equilibrium
The interfacial heat exchange flux is difficult to estimate as it involves the temperature of the phases. Hence, the objective of this model is to find simplifying assumptions that are valid in the case of solid oxide cells in order to consider the cermet as a single medium with respect to the energy conservation. One major issue that is currently discussed nowadays is the validity of the local thermal equilibrium assumption (LTE), which states that all the phases inside the PEN are locally at the same temperature. In our case, this would mean that:
Tg = Tio = Te = T (7)
The applicability of this assumption for fuel cells has been quantitatively studied by Hwang and Chen [21]. They assumed that the LTE is valid when the local difference in temperature between the fluid and the solid is small compared to the difference in temperature of the fluid between the inlet and the outlet of the electrode. Their analysis showed that the LTE can be assumed when with:
(8)
The mean velocity umean of the fluid inside the electrode is the ratio of the volumetric flow rate produced to the surface of the electrode. This is equal to:
Code de champ modifié
(9)
For the calculation of this criterion, gases can be considered as ideal:
(10)
(11)
The possibility to calculate the heat transfer coefficient hth(g-i) for flows in a porous media was investigated in 2001 by Kuwahara et al [45] and updated in 2010 by Pallares and Grau [46]. Furthermore, Damn and Fedorov proposed in 2006 [47] a conservative estimation of the heat transfer coefficient:
(12)
This is the most conservative estimation of hth(g-i) since it considers that heat transfer between the solid and the fluid is only made by conduction. Combining equations (8) to (11) gives a new expression of the LTE criterion:
(13)
For a sample calculation of H, we take values for solid oxide cells that could maximise this quantity: J=104 A m-2, | νox + νred |=1/2, λ
g=0.05 W m-1 K-1, εg=0.5, dp=2×10⁻⁵ m , ece= 5×10⁻⁵ m. This gives a value of H = 6×10⁻⁵, which confirm that the LTE can reasonably be considered valid inside the PEN of solid oxide cells. As a consequence, all the phases of the cermet are locally at the same temperature T. Thus, the interfacial heat exchange between the solid and the fluid phase in Eq. (3) can safely be neglected as well as radiative heat transfer in Eq. (6).
Code de champ modifié Code de champ modifié Code de champ modifié
2.3 Energy conservation
We suppose that the mass that is produced inside the fluid phase is at the same temperature as the fluid phase. Thus, mass production only appears indirectly inside the energy balance. The conservation of energy in the fluid phase can be then written by the following integral equation:
(14)
Applying the same averaging method presented in previous publication[40], the local equation of energy for the fluid phase can be written as follows:
(15)
For the solid phase i:
(16)
By coupling the previous equations together, and by summing the energy equation of each phase, the local conservation equation for energy inside the control volume is written as:
(17)
Note that without additional approximation, this equation can also be written as follows :
(18)
For numerical calculations we can use a more suitable expression by stating the last equation with equivalent variables for the porous medium:
(19)
This equation shows that the cermet can be modelled as a single phase equivalent medium for the thermal phenomena, with the equivalent properties:
(20)
(21)
(22)
Equation (22) shows that the equivalent thermal resistance of the medium is comparable to the parallel connection of the resistance of each phase. Thermal energy conservation in the porous electrodes is now established and can be modelled into one continuity equation that features equivalent properties. This model will be now tested numerically on a proton conducting solid oxide electrolysis cell.
3 Numerical model
The properties of gases (hydrogen, oxygen and water vapour) are taken from the literature [48-52]. For a given pressure, each quantity can be written as a polynomial function of temperature, whose coefficients are given in Table 1.
(23)
Table 1 - Coefficient for polynomial functions to calculate the properties of gases at 10 bars between
773 K and 973 K.
Quantity Coefficients Steam Hydrogen Oxygen
ah ‐ ‐ ‐ bh 2.22×10⁴ 1.48×10⁴ 1.07×10³ Specific enthalpy (J kg-1) ch 1.76×10⁷ ‐6.09×10⁵ ‐8.84×10⁴ ak ‐ ‐ ‐ bk 1.31×10⁻⁴ 4.96×10⁻⁴ 6.97×10⁻⁵ Thermal conductivity (W m-1 K-1) ck ‐3.41×10⁻² 2.86×10⁻² 1.02×10⁻² as ‐ ‐ ‐ bs 2.56×10⁻³ 1.70×10⁻² 1.23×10⁻³ Specific entropy (J kg-1 K-1) cs 5.73 44.6 5.79 ac 3.74×10⁻⁴ 1.51×10⁻³ ‐1.71×10⁻⁴ bc ‐5.49 ×10⁻² ‐1.31 0.482
Specific heat capacity (J kg-1 K-1) cc 1.99 ×10³ 1.48×10⁴ 7.80×10⁻² aμ ‐ ‐ ‐ Dynamic viscosity (Pa s) bμ 4.00×10⁻⁸ 1.44×10⁻⁸ 3.45×10⁻⁸
Code de champ modifié
cμ ‐2.34×10⁻⁶ 5.89×10⁻⁶ 1.48×10⁻⁵
The thermal model is then coupled to the mass transfer model published earlier by our group [40]. Calculations are run on COMSOL Multiphysics 4.2. considering the same reactor dimensions (Table 2) and boundary conditions, parameters and reference values, except for those presented in Table 3. The conductivity of protons inside the ceramic was measured by the work team by impedance spectroscopy. Measurements were carried out between 748K and 873K – 10 bars.
The values considered for the parametric study encloses realistic operating data for solid oxide cells. Some values are out of the operating range for those cells : for example a value for inlet current density of J = 1.5×10⁴ A m-2 is considered whereas solid oxide cells usually operated under 1×10⁴ A m-2. Also, an operating temperature of T = 973 K is studied, which is too high for the conduction of protons inside the electrolyte [53]. These values are tested for theoretical purpose to evaluate the influence of the parameter or to predict the behaviour of the system in the case of an accidental malfunctioning.
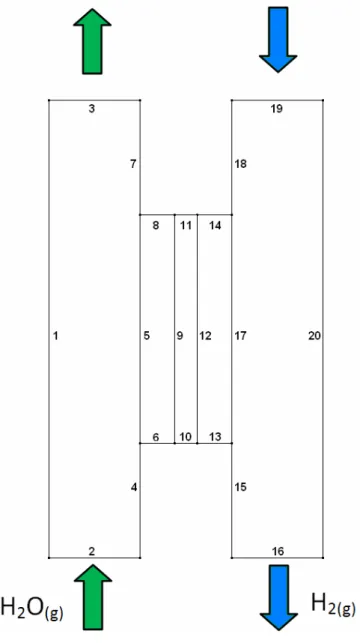
Unless another value of those parameters is specified, the default value that is taken for any calculation is the one presented in Table 3. The indexes of the boundary conditions are given in Fig. 3 and the additional boundary conditions for the thermal problem are given in Table 4.
Table 2 - Reactor dimensions
Parameter Value
Anodic channel width 4×10⁻⁴ m Anode width 1.5×10⁻⁴ m Electrolyte width 1×10⁻⁴ m Cathode width 1.5×10⁻⁴ m Cathodic channel width 4×10⁻⁴ m Anode length 10-3 m Electrolyte length 10-3 m Cathode length 10-3 m Anodic channel length 2×10⁻³ m Cathodic channel length 2×10⁻³ m
Code de champ modifié
Code de champ modifié Supprimé : y
Table 3 - Values of variable parameters and inlet parameters for the reference calculation
Parameter Reference value Unit Other values tested
Inlet current density 10000 A m-2 1, 103, 2×10³, 5×10³, 104, 1.5×10⁴
Inlet velocity 0.1 m s-1 0.2, 0.5, 1, 1.5, 2
Operating temperature 873 K 773, 973
Operating pressure 106 Pa
-Particle radius (metal) 10-6 m -Particle radius (ceramic) 5×10⁻⁷ m
-Initial oxygen molar fraction 0,01
Ionic conductivity (ceramic) 1.2302×e-1827.6/T S m-1 -Ceramic thermal conductivity 1 [152] W m-1 K-1 -Metal thermal conductivity 1000 W m-1 K-1
-Fig. 3 – Reactor geometry and boundary conditions.
Table 4 - Boundary conditions
Boundary Heat
1 Zero flux
2 Fixed temperature (T0=873 K) 3 Outlet , no temperature gradient
4 Zero flux
5 Heat flux continuity 6,8,10,11,13,14 Zero flux
16 Outlet , no temperature gradient 17 Heat flux continuity
18 Zero flux
19 Fixed temperature (T0=873 K)
20 Zero flux
9,12 Continuity
4 Parametric analysis
An analysis is carried out on the parameters that are suspected to have a strong influence on power and temperature, i.e. the inlet current density, which generates ohmic heat losses, and the inlet velocity. The influence of the operating temperature is also tested in order to predict the behaviour of the cell at different working temperatures that can be reached. Inlet current is obviously important as it determines the mass consumed or produced in the process. The conduction of charge also generates ohmic heat losses that are proportional to the square of the value of inlet current density. Inlet velocity is a very influential parameter on the global energetic and economic performance of solid oxide cells. Low velocities gas flows allow larger reactant utilization, but can cause local reactant depletion and cold spots that exacerbate temperature non-uniformities. On the contrary, higher gas flows tend to increase the uniformity of the reaction rates across the active area but decrease reactant utilization. Therefore, management of gas flows is critical to the stable operation of the cell [27]. The Reynolds number in this study ranges from 0.9 to 44, therefore the hydraulic conditions remains globally laminar.
It should be mentioned that the numerical results presented in this study are dependent on the design and dimensions of the device. Those dimensions are not clearly defined as there is currently no definitive design for those cells [5]. Therefore the results obtained with the parametric study are not meant to be realistic; rather they are used to show tendencies and relationships between the different phenomena of the system. From these observations that are presented in this section, a series of assumptions are built for the modelling of the PEN into a network of thermal resistances.
Code de champ modifié
4.1 Influence of operating temperature
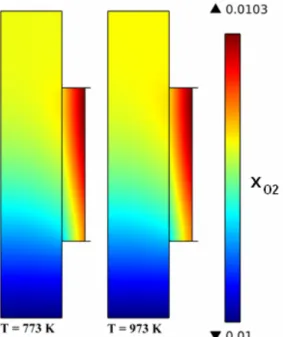
The influence of the operating temperature on the distribution of the transfer current density is tested in order to determine whether this parameter should be monitored. The temperatures range from 773 K to 873 K, which corresponds to a reasonable range for which the perovskite can conduct protons. An additional value of 973 K is tested for the reasons presented in section 3.
From Figure 4 we notice that in this range of temperature variation, the oxygen molar fraction profiles at the anode are not affected (Fig. 4). Indeed, the ratio between the diffusion coefficients of oxygen and steam, which are transported in opposite direction mainly by Knudsen diffusion, remains the same with temperature:
(24) The influence of the operating temperature on the transfer current density across the electrode is shown in Fig. 5. This influence is minor compared to other influential parameters that have been tested in a previous study, such as the grain radius of the porous media and the ratio between the conductivity of the metal and the ceramic σio /σe [40]. Operating temperature appears in the
expressions of many quantities of the system. The little variations shown in Fig. 5 are suspected to be caused by the effect of the temperature in the Butler Volmer equation and by the slight change in σio /σe, which ranges from 0.9×10⁻⁵ at 773K to 2×10⁻⁵ at 973K.
Code de champ modifié
Supprimé : variations
Fig. 4 – Oxygen fraction in the anode channel for different operating temperature.
Fig. 5 – Effect of operating temperature on oxygen production along the anode. X-axis: position in the
anode (on the left the anodic channel, on the right the electrolyte). Y-axis: transfer current density multiplied by the specific reactive volume.
4.2 Effect of inlet current on heat release and temperature profile
An important question about heat sources is to know where and how they take place. In order to underline this problem the effect of the inlet current on heat release and temperature profile is studied. The results of the calculations are presented in Tables 5 and 6. Firstly, we observe that a very large
majority of this energy release is caused by Joule’s effect inside the ceramics (98%). This is caused by the low ionic conductivity of this phase compared to the electronic conductivity of metal.
Secondly, the energy is also mainly released in the electrolyte (89%) despite its low thickness compared to the electrode Il y aquelque chose que je ne comprends pas (effet de copier-coller?) difference entre ceramics et electrolyte(Table 1). Indeed, the distance covered by protons, which is directly linked with heat power generation, is thinner in the electrodes than in the electrolyte because the electrochemical reaction occurs close to the interface with the electrolyte. Actually, protons tend to minimize their path through the ceramic when the ionic conductivity of the ceramic is low: charge carriers choose the easiest conduction path il me semble qu’il y a un principe de physique général derrière cette affirmation, “ principle of minimum rate of energy dissipation in dynamics equilibrium” Voir papiers attachés . However, the most important observation about these results is that the location and the nature (ohmic or electrochemical) of the heat sources remain roughly independent of the value of the current density (±4% disparity).
This means that for a given problem, the values of the heat sources in the cell can be predicted with only few parameters: the dimensions of the electrolyte on voit mal ce que c’est!, the value of the ionic conductivity, the inlet current density and the proportion of the total power released in the electrodes. These observations should however be confirmed in special cases, for example if the electronic conductivity of the metal is close to the ionic conductivity of the ceramics and in the case where diffusion phenomena become limiting.
Note also that the electrochemical heat source is negligible when inlet current density is larger than 1000 A m-2. This result is valid for the electrolysis of steam, but should be checked for technologies using methane or carbon dioxide, for which enthalpies and entropies of reaction are different [20].
Table 5
Repartition of the heat release inside the PEN
Parameter Anode Electrolyte Cathode Total
Joule’s effect (ceramic) 8% 82% 8% 98%
Joule’s effect (metal) 1% - 1% 2%
Electrochemical heat source 0.1% - 0.1% 0.1%
Total 9% 82% 9% 100%
Mis en forme : Surlignage Mis en forme : Surlignage
Mis en forme : Surlignage Mis en forme : Surlignage
Mis en forme : Couleur de
police : Automatique, Surlignage
Mis en forme : Surlignage
Code de champ modifié Supprimé : from
Table 6
Total heat released in the PEN
Inlet current density (A m-2) Total power (W)
1 9.55×10⁻⁸
1000 9.54×10⁻²
10000 8.91
4.3 Effect of velocity on heat release and temperature profile
Different inlet velocities inside the channels are tested from 0.1 m s-1 to 10 m s-1.The flow remains laminar for the velocities studied. Like current density, the value of velocity has little influence on the location and the nature of the heat sources inside the cells shown in Table 5, mainly because the phenomena inside the electrode are driven by the electrode structure and the value of the inlet current density [40]. However, this parameter has a huge influence on the maximum temperature reached inside the electrolyzer. Indeed, the fluid extracts the heat from the electrodes and conveys it to the outlet. As gases do not convey heat as efficiently as liquids, the management of the mass rate, the pressure and the composition of the gas flows are important parameters for monitoring the maximum temperature inside the cell. Fig 6 shows that the maximum temperature reached inside the electrolyte is dependent on the inlet velocity. The value of the maximum temperature is not meant to be representative for real electrolyzer, rather it will be used for building the resistance model that is presented. The maximum temperature reached in the cell is 913 K, i.e. an elevation of 40K, for the maximum inlet current density J=1.5×10⁴ A m-2 and the minimum inlet velocity U=0.1 m s-1.
It can be noticed that temperature remains relatively constant in the PEN and varies strongly in the channels. Indeed, the thermal resistance of the PEN (approximately 5×10⁻³ K W-1) is low compared to the high thermal resistance of the gas flow (approximately 2 K W-1), therefore the temperature profile is more homogeneous in the PEN. However, literature review shows that the temperature of higher aspect ratio PEN can vary significantly along the direction of the flow [21-23, 27]. Thus, the previous observation seems valid only for a PEN with a low aspect ratio. The temperature profile in the cathode channel slightly differs from the anode: one can notice that the thermal boundary layer is thinner in the anodic channel than in the cathodic channel. This is because the Prandtl number (Eq. 25), which
Code de champ modifié
Code de champ modifié Code de champ modifié Supprimé : they
compares the relative thickness of the momentum and the thermal boundary layer, is not the same for the gases at the anode and at the cathode.
Pr = μgCp(g) /λg (25)
As a result, the interaction between the fluid and the heat flux is higher for the gas mixture at the anode (Pr=1.24) than for the hydrogen at the cathode (Pr=0.6).
Fig. 6 – Temperature elevation in the cell (in K) for different inlet velocities.
5 Thermal resistances modelling
The objective of this model is to represent the thermal behaviour of the cell as a network of thermal resistances and heat sources. The behaviour of a component of the cell is given by the following equation:
∆T = Rth Φth (26)
∆T is the difference between the mean temperature of the two boundaries of the component (in K), Φth
is the thermal flux that crosses the element (in W) and Rth is the thermal resistance of the component (in W K-1). This model relies on different assumptions:
Heat is transported through the component of the PEN and the gas channels only.
Heat sources are uniform along the directions of the gas flows.
The heat sources inside the electrodes are generated at the electrode/electrolyte interface.
Heat sources are not influenced by the velocity of gases inside the channel
Steady state
5.1 Thermal resistances
This thermal resistance Rth can be related to the parameters of the medium. In the electrodes and in the electrolyte, heat transfer occurs through conduction and the resistance is given by
Rth = e/λS (27)
e is the width of themedium, λ its thermal conductivity and S the area crossed by the flux (or the length in 2D models).
The thermal resistance in the gas channels depends on the characteristics of the diffusion and thermal layers at the interface with the electrode and is usually given by a correlation. So far, no correlation has been found to match the results of this study, however data reduction from the COMSOL calculations gives the expression of a thermal resistance for the channels in this model:
Rth= 1/(0.24 Re0.53 Pr0.23) (28)
5.2 Heat sources
We have shown in the parametric study that heat is mostly generated by ohmic losses inside the electrodes. We have also shown that the heat source in the electrodes is a proportion of the heat source in the electrolyte. Therefore all the heat sources depend only on the value of the inlet current, electrode external surface and thickness, and ionic conductivity.
For the electrolyte:
(29) The expression for total power source inside the electrodes is given by:
(30) According to the results shown in Table 4, we calculate K =0.1. From the observations made in section 4, we have shown that the value of K is independent of the inlet current density and inlet velocity.
However it probably depends on the electrode microstructure, on the electrical conductivities and other parameters of the electrode.
5.3 Equivalent circuit
Since the sources are not dependent on the phenomenon of the process and that the calculations are performed in steady state, the thermal transfer inside the cell can be modelled in the form of a thermal resistances network (Fig. 7). The resistance of the different components are in series while the heat sources are symbolised as current generators in the equivalent circuit.
Fig. 7 – Thermal network modelling of the electrolyzer.
Race represents the thermal resistance of the anode, Re represents the thermal resistance of the electrolyte and Raccrepresents the thermal resistance of the cathode. The expression of the thermal conductivities of the electrodes is given by Eq. (22). The thermal resistances of the anodic and cathodic gas channels anodic are respectively called Rachand Rcch. T0 is the temperature of inlet gases while Tach, Tace, Te, Tcce and Tcch are the maximum temperature respectively reached inside the anodic gas channel, the anode, the electrolyte, the cathode and the cathodic gas channel. R∞ is an infinite
resistance needed for the resolution of the system and has no physical meaning.
The objective of this network system is to predict the maximum temperatures inside each component. By applying the Kirchoff’s circuit law on each node of the network, we obtain the representative matrix of the system.
(Tk-1-Tk)/Rk-1 + (Tk+1-Tk)/Rk+ Φk = 0 (31) The matricial representation of the system is given by:
[R]×[T]=[P] (32) with (33) (34) And (35)
Solving this network allows the prediction of the maximum temperature reached inside each component of the PEN. The temperatures in the channels are then obtained with the potential divider law. The expression of maximum temperature is given by Eq. (36) whose coefficients are given in Table 6.
(36)
Table 7
Coefficients for the calculation of temperature
aa ae ac
Tach Rach (Re+Rcch+Rcce) Rach(Re/2+Rcch+Rcce) Rach (Rcch+Rcce) Tace (Rach+Race)(Re+Rcch+Rcce) (Rach+Race)(Re/2+Rcch+Rcce) (Rach+Race)(Rcch+Rcce) Te (Re/2+Rcch+Rcce)(Rach+Race) (Rach+Race+Re/2)(Re/2+Rcch+Rcce) (Rach+Race+Re/2)(Rcch+Rcce) Tcce (Rcch+Rcce)(Rach+Race) (Rcch+Rcce)(Re/2+Rach+Race) (Rcch+Rcce)(Re+Rach+Race) Tcch Rcch (Rach+Race) Rcch (Re/2+Rach+Race) Rcch (Re+Rach+Race)
5.4 Comparison with the results of the parametric analysis
The model has been tested for every case that has been performed in the parametric analysis with COMSOL. The results given in Table 8 and Table 9 show that the temperatures given by the network model are very close to the temperatures given by the parametric analysis, with maximum difference of 1K between the two models. The resistance network model is therefore valid to estimate the maximum temperatures given by the calculations in COMSOL. It must be noted however that the thermal resistance modelling is valid if the variation of temperature inside a component does not cause a large variation in the value of its thermal resistance.
Table 8
Difference in maximum temperatures (in K) given by the network model and the parametric analysis on inlet current density
Inlet current density
(A m-2) Anode (channel) Anode (cermet) Electrolyte Cathode (cermet) Cathode (channel)
1 0.00 0.00 0.00 0.00 0.00 1000 0.00 0.00 0.00 0.00 0.00 2000 -0.01 -0.01 0.00 0.00 0.00 5000 -0.05 -0.05 0.00 0.01 0.00 10000 -0.18 -0.16 0.01 0.06 0.04 15000 -0.31 -0.27 0.08 0.19 0.14 Table 9
Difference in maximum temperatures (in K) given by the network model and the parametric analysis on inlet velocity
Inlet velocity (m s-1) Anode
(channel) (cermet)Anode Electrolyte Cathode (cermet) (channel)Cathode
0.1 -0.19 -0.17 -0.01 0.04 0.02 0.2 0.67 0.69 0.86 0.91 0.89 0.5 0.78 0.80 0.98 1.06 1.04 1 0.34 0.36 0.54 0.64 0.62 1.5 0.09 0.11 0.29 0.39 0.37 2 -0.06 -0.04 0.14 0.24 0.22
5.5 Inverse physics and isothermal assumption checking
The resistance network model analytically relates the maximum temperature attained in the components to the parameter of the process. This model also allows determining for which values of those parameters a given temperature increase is attained.
For a sample calculation, let us consider that the heat sources inside the electrodes are negligible. Let us also consider that the properties of the two electrodes are equal and that all the elements of the PEN have the same external surface. The maximum temperature is therefore attained in the middle of the electrolyte and is given by:
(37)
Using the expressions of the resistance and heat sources given previously, we obtain: (38)
This equation shows how the parameters of the process influence the value of the Te. Given a set of parameters, it is therefore possible to determine whether the process is isothermal or not before running an experiment or a calculation. Changing the form of this equation gives the value of a parameter for a given Te. Thus, resistance modelling makes inverse physics modelling is possible, with or without the assumptions given for this sample calculation.
6 Conclusion
This paper has presented different models for the simulation of thermal transfer inside the electrode assembly of a high temperature electrolyzer. The local thermal equilibrium assumption in the cermet was demonstrated through the construction of a criterion, and the continuity equation for energy was built via a volume averaging method. This model was implemented in COMSOL Multiphysics along with a set of equations demonstrated in previous work for the simulation of a planar proton conducting solid oxide electrolysis cell in galvanostatic mode. A parametric analysis was carried out by studying
the influence of inlet current density and inlet velocity of gases in the channels on temperature and heat released in the cell. This analysis showed that nearly all the heat power source is released in the ceramic phase by Joule’s effect and that the temperature varies mostly inside the channels. Moreover, the repartition of heat power sources inside the electrode and the electrolyte is mostly independent from inlet current density or from the inlet velocity of gases. This means that for a given problem, the heat release in the cell can be predicted with only few parameters: the dimensions of the electrolyte, the value of the ionic conductivity, the inlet current density and the proportion of power released in the electrodes. Following that observation, it was demonstrated that it is possible to model the thermal behaviour of the cell as a network of heat sources and thermal resistance in order to analytically evaluate the temperature inside each component of the cell. A comparison with the results given by the parametric analysis showed that this model predict those temperatures accurately. This modelling strategy strongly reduces computation time and allows reverse physical analysis in order to determine for which values of those parameters a given temperature increase is attained.
Acknowledgements
The authors acknowledge the French ANR (Agence Nationale pour la Recherche, France) for the financial support (Project ANR-09HPAC-007-01).
The authors thank Kamal Rahmouni for the measurements of the ionic conductivity.
Appendix A – Equation system for the description of transport and transfer phenomena inside a
cermet electrode.
This set of equations was established via a control volume method applied on the cermet. They describe charge and mass transfers as well as electrochemical transfer inside a monophasic volume physically equivalent to the cermet:
Continuity equation for mass transport (A1) Continuity equation for electronic charge
(A2)
Continuity equation for ionic charge (A3)
Ohm’s law inside the ionic conductor (A4)
Ohm’s law inside the electronic conductor (A5)
Overpotential (A6)
Butler Volmer equation (A7)
Continuity equation for species i transport (A8)
Molar flux for species i (A9)
This set of equations was demonstrated and tested in previous work [1].
Additional nomenclature for the equations presented in this appendix is available below: Diffusion coefficient for the species i (m² s-1)
Φi Charge potential inside phase i (V)
α Charge transfer coefficient (dimensionless)
κ Permeability (m2)
MI Molar weight of the transported ion (kg mol-1)
References
[1] Mingyi L, Bo Y, Jingming X, Jing C. Thermodynamic analysis of the efficiency of high-temperature steam electrolysis system for hydrogen production. Journal of Power Sources. 2008;177:493-9.
[2] Pramuanjaroenkij A, Kakaç S, Yang Zhou X. Mathematical analysis of planar solid oxide fuel cells. International Journal of Hydrogen Energy. 2008;33:2547-65.
[3] Ferguson JR, Fiard JM, Herbin R. Three-dimensional numerical simulation for various geometries of solid oxide fuel cells. Journal of Power Sources. 1996;58:109-22.
[4] Kakaç S, Pramuanjaroenkij A, Zhou XY. A review of numerical modeling of solid oxide fuel cells. International Journal of Hydrogen Energy. 2007;32:761-86.
[5] Andersson M, Yuan J, Sundén B. Review on modeling development for multiscale chemical reactions coupled transport phenomena in solid oxide fuel cells. Applied Energy. 2009;87:1461-76.
[6] Soukup K, Schneider P, Solcová O. Comparison of Wicke-Kallenbach and Graham's diffusion cells for obtaining transport characteristics of porous solids. Chemical Engineering Science. 2008;63:1003-11.
[7] Hussain MM, Li X, Dincer I. Mathematical modeling of planar solid oxide fuel cells. Journal of Power Sources. 2006;161:1012-22.
[8] Demin A, Gorbova E, Tsiakaras P. High temperature electrolyzer based on solid oxide co-ionic electrolyte: A theoretical model. Journal of Power Sources. 2007;171:205-11.
[9] Deseure J, Bultel Y, Dessemond L, Siebert E. Theoretical optimisation of a SOFC composite cathode. Electrochimica Acta. 2005;50:2037-46.
[10] Slodczyk A, Colomban P, André G, Zaafrani O, Grasset F, Lacroix O, et al. Structural modifications induced by free protons in proton conducting perovskite zirconate membrane. Solid State Ionics. 2012;225:214-8.
[11] Jin X, Xue X. Computational fluid dynamics analysis of solid oxide electrolysis cells with delaminations. International Journal of Hydrogen Energy.35:7321-8.
[12] Thiessen S, Khalil E, Karim G. The autoignition in air of some binary fuel mixtures containing hydrogen. International Journal of Hydrogen Energy. 2010;35:10013-7.
[13] Izzo Jr JR, Peracchio AA, Chiu WKS. Modeling of gas transport through a tubular solid oxide fuel cell and the porous anode layer. Journal of Power Sources. 2008;176:200-6.
[14] Lehnert W, Meusinger J, Thom F. Modelling of gas transport phenomena in SOFC anodes. Journal of Power Sources. 2000;87:57-63.
[15] Xue X, Tang J, Sammes N, Du Y. Dynamic modeling of single tubular SOFC combining heat/mass transfer and electrochemical reaction effects. Journal of Power Sources.
2005;142:211-22.
[16] Suwanwarangkul R, Croiset E, Fowler MW, Douglas PL, Entchev E, Douglas MA. Performance comparison of Fick’s, dusty-gas and Stefan–Maxwell models to predict the concentration overpotential of a SOFC anode. Journal of Power Sources. 2003;122:9-18. [17] Hussain MM, Li X, Dincer I. A general electrolyte–electrode-assembly model for the performance characteristics of planar anode-supported solid oxide fuel cells. Journal of Power Sources. 2009;189:916-28.
[18] Bhattacharyya D, Rengaswamy R, Finnerty C. Dynamic modeling and validation studies of a tubular solid oxide fuel cell. Chemical Engineering Science. 2009;64:2158-72.
[19] Iora P, Aguiar P, Adjiman CS, Brandon NP. Comparison of two IT DIR-SOFC models: Impact of variable thermodynamic, physical, and flow properties. Steady-state and dynamic analysis. Chemical Engineering Science. 2005;60:2963-75.
[20] Ni M. Computational fluid dynamics modeling of a solid oxide electrolyzer cell for hydrogen production. International Journal of Hydrogen Energy. 2009;34:7795-806.
[21] Hwang JJ, Chen PY. Heat/mass transfer in porous electrodes of fuel cells. International Journal of Heat and Mass Transfer. 2006;49:2315-27.
[22] Jeon DH. A comprehensive CFD model of anode-supported solid oxide fuel cells. Electrochimica Acta. 2009;54:2727-36.
[23] Ho TX, Kosinski P, Hoffmann AC, Vik A. Effects of heat sources on the performance of a planar solid oxide fuel cell. International Journal of Hydrogen Energy.35:4276-84.
[24] Yu B, Zou M, Feng Y. Permeability of fractal porous media by Monte Carlo simulations. International Journal of Heat and Mass Transfer. 2005;48:2787-94.
[25] Colclasure AM, Sanandaji BM, Vincent TL, Kee RJ. Modeling and control of tubular solid-oxide fuel cell systems. I: Physical models and linear model reduction. Journal of Power Sources.196:196-207.
[26] Murthy S, Fedorov AG. Radiation heat transfer analysis of the monolith type solid oxide fuel cell. Journal of Power Sources. 2003;124:453-8.
[27] Wang G, Yang Y, Zhang H, Xia W. 3-D model of thermo-fluid and electrochemical for planar SOFC. Journal of Power Sources. 2007;167:398-405.
[28] Bove R, Ubertini S. Modeling solid oxide fuel cell operation: Approaches, techniques and results. Journal of Power Sources. 2006;159:543-59.
[29] Ni M. Modeling of a solid oxide electrolysis cell for carbon dioxide electrolysis. Chemical Engineering Journal.164:246-54.
[30] Dutta S, Morehouse JH, Khan JA. Numerical analysis of laminar flow and heat transfer in a high temperature electrolyzer. International Journal of Hydrogen Energy. 1997;22:883-95. [31] Hajimolana SA, Hussain MA, Daud WMAW, Soroush M, Shamiri A. Mathematical modeling of solid oxide fuel cells: A review. Renewable and Sustainable Energy Reviews. 2011;15:1893-917.
[32] Authayanun S, Mamlouk M, Arpornwichanop A. Maximizing the efficiency of a HT-PEMFC system integrated with glycerol reformer. International Journal of Hydrogen Energy. 2012;37:6808-17.
[33] Calise F, Dentice d’Accadia M, Restuccia G. Simulation of a tubular solid oxide fuel cell through finite volume analysis: Effects of the radiative heat transfer and exergy analysis. International Journal of Hydrogen Energy. 2007;32:4575-90.
[34] Damm DL, Fedorov AG. Radiation heat transfer in SOFC materials and components. Journal of Power Sources. 2005;143:158-65.
[35] Xie Y, Xue X. Transient modeling of anode-supported solid oxide fuel cells. International Journal of Hydrogen Energy. 2009;34:6882-91.
[36] Damm DL, Fedorov AG. Reduced-order transient thermal modeling for SOFC heating and cooling. Journal of Power Sources. 2006;159:956-67.
[37] Fardadi M, Mueller F, Jabbari F. Feedback control of solid oxide fuel cell spatial temperature variation. Journal of Power Sources. 2010;195:4222-33.
[38] Martinez AS, Brouwer J. Modeling and comparison to literature data of composite solid oxide fuel cell electrode–electrolyte interface conductivity. Journal of Power Sources. 2010;195:7268-77.
[39] Autissier N, Larrain D, Van herle J, Favrat D. CFD simulation tool for solid oxide fuel cells. Journal of Power Sources. 2004;131:313-9.
[40] Dumortier M, Sanchez J, Keddam M, Lacroix O. Theoretical considerations on the modelling of transport in a three-phase electrode and application to a proton conducting solid oxide electrolysis cell. International Journal of Hydrogen Energy. 2012;37:11579-94.
[41] Ji Y, Yuan K, Chung JN. Monte-Carlo simulation and performance optimization for the cathode microstructure in a solid oxide fuel cell. Journal of Power Sources. 2007;165:774-85. [42] Deslouis C, Keddam M, Rahmouni K, Takenouti H, Grasset F, Lacroix O, et al.
Characterization of porous texture of cermet electrode for steam electrolysis at intermediate temperature. Electrochimica Acta. 2011;56:7890-8.
[43] Grae Worster M, Le Bars M. Interfacial conditions between a pure fluid and a porous medium: implications for binary alloy solidification. J Fluid Mech. 2006;550:149-73. [44] Coeuret F, Storck A. Elements de génie électrochimique. Paris: Technique et documentation; 1993.
[45] Kuwahara F, Shirota M, Nakayama A. A numerical study of interfacial convective heat transfer coefficient in two-energy equation model for convection in porous media. International Journal of Heat and Mass Transfer. 2001;44:1153-9.
[46] Pallares J, Grau FX. A modification of a Nusselt number correlation for forced convection in porous media. International Communications in Heat and Mass Transfer. 2010;37:1187-90. [47] Damm DL, Fedorov AG. Local thermal non-equilibrium effects in porous electrodes of the hydrogen-fueled SOFC. Journal of Power Sources. 2006;159:1153-7.
[48] Kestin J, Sengers JV, Kamgar-Parsi B, Levelt Sengers JMH. Thermophysical Properties of Fluid H2O. JPhysChem.Ref.Data:175-83.
[49] Kunz O, Klimeck R, Wagner W, Jaeschke M. The GERG-2004 Wide-Range Reference Equation of State for Natural Gases and Other Mixtures. GERG Technical Monograph,. 2006;Fortschr.-Ber. VDI, VDI-Verlag, Düsseldorf,.
[50] Laesecke A, Krauss R, Stephan K, Wagner W. Transport Properties of Fluid Oxygen. J Phys Chem Ref Data. 1990;19:1089-122.
[51] Leachman JWJ, R.T.; Lemmon, E.W. Fundamental Equations of State for Parahydrogen, Normal Hydrogen, and Orthohydrogen. J Phys Chem Ref Data. 2009;38:721-48.
[52] Schmidt R, Wagner W. A New Form of the Equation of State for Pure Substances and its Application to Oxygen. Fluid Phase Equilibria 1985;19:175-200.