I N C A R C E R A T I O N ’ S E F F E C T O N
E C O N O M I C M O B I L I T Y
ACKNOWLEDGEMENTS
This report is based on research by Dr. Bruce Western and Dr. Becky Pettit and was jointly authored by the Economic Mobility Project and the Public Safety Performance Project of The Pew Charitable Trusts. Bruce Westernis a professor of sociology and director of the Multidisciplinary Program in Inequality and Social Policy at the Harvard Kennedy School. His work focuses on the link between social inequality and the growth of the prison and jail population in the United States. Western holds a B.A. in government from the University of Queensland, Australia, and a Ph.D. in sociology from the University of California, Los Angeles. Becky Pettitis an associate professor of sociology at the University of Washington. Her work investigates the role of institutions in differential labor market opportunities and aggregate patterns of inequality. Pettit holds a B.A. in sociology from the University of California, Berkeley, and a Ph.D. in sociology from Princeton University.
We would like to thank consultants Jenifer Warren, writer; Ellen Wert, editor; and Carole Goodman of Do Good Design, report designer. We also thank our colleagues, Sue Urahn, managing director, Pew Center on the States; the communications team (Gaye Williams, deputy director; Andrew McDonald, senior officer; Peter Janhunen, senior officer); the publications team (Carla Uriona, manager; Evan Potler, senior associate); and the quality control team (Nancy Augustine, manager; Kil Huh, director; Denise Wilson, associate; Sara Dube, senior associate; Elaine Weiss, manager; Jane Breakell, associate; Jill Antonishak, manager; Christine Vestal, manager; Lisa Cutler, deputy director, communications). Finally, we thank all of those who read and provided valuable feedback on the report: John Morton, Bhashkar Mazumder, Harry Holzer, Marv Kosters, Ronald Mincy, Ken Land, Samuel Preston, Steven Raphael and Ianna Kachoris.
For more information, please visitwww.economicmobility.organdwww.pewpublicsafety.org.
Suggested Citation:The Pew Charitable Trusts, 2010.Collateral Costs: Incarceration’s Effect on Economic Mobility.Washington, DC: The Pew Charitable Trusts.
©2010 The Pew Charitable Trusts
The Economic Mobility Project is a nonpartisan collaborative effort that seeks to focus attention and debate on the question of economic mobility and the health of the American Dream.
Doug Hamilton,Deputy Director
Erin Currier,Project Manager
Samantha Lasky,Communications Officer
Scott Winship, Ph.D.,Research Manager
Colleen Allen,Specialist
Kari Miller,Administrative Assistant
The Public Safety Performance Project helps states advance fiscally sound,
data-driven policies and practices in sentencing and corrections that protect public safety, hold offenders accountable, and control corrections costs.
Adam Gelb,Director
Jake Horowitz,Project Manager
Richard Jerome,Project Manager
Ryan King,Project Manager, Research
Jennifer Laudano,Project Manager, Communications
Brian Elderbroom,Senior Associate
Jason Newman,Senior Associate
Rolanda Rascoe,Senior Associate, Communications
Joe Gavrilovich,Associate
T A B L E O F C O N T E N T S
2 TO THE READER: WHY INCARCERATION AND ECONOMIC MOBILITY?
3 EXECUTIVE SUMMARY
6 THE GROWTH, SCALE AND CONCENTRATION OF INCARCERATION
IN AMERICA
6 Male Incarceration Rates by Age, Race and Education
9 THE IMPACT OF INCARCERATION ON EMPLOYMENT, WAGES AND
ECONOMIC MOBILITY
10 Sidebar: Is it Incarceration or Arrest and Conviction?
11 Incarceration and Work
12 Incarceration and Lost Earnings
13 Sidebar: The Hidden Labor Market
16 Incarceration and Economic Mobility
18 THE INTERGENERATIONAL IMPACT OF INCARCERATION
18 Children with Incarcerated Parents
18 The Impact of Parental Incarceration
20 Sidebar: Why Parents Are Incarcerated
22 PROMOTING ECONOMIC MOBILITY
22 From Prison to Work
24 Containing the Corrections Population
26 CONCLUSION
28 APPENDIX
28 Methodology
30 Incarceration Rates
32 Children of Incarcerated Parents
34 Employment-to-Population Rates With/Without Inmates
36 NOTES
2
COLLATERAL COSTS:Incarceration’s Effect on Economic Mobility T O T H E R E A D E R :WHY INCARCERATION AND ECONOMIC MOBILITY?
Over the past 30 years, the United States has experienced explosive growth in its incarcerated population. The Pew Center on the States reported in 2008 that more than 1 in 100 adults is now behind bars in America, by far the highest rate of any nation.1The direct cost of this imprisonment boom, in dollars, has been staggering: state correctional costs quadrupled over the past two decades and now top $50 billion a year, consuming 1 in every 15 general fund dollars.2
Looking at the same period of time, Pew’s Economic Mobility Project’s research has revealed a decidedly mixed picture of economic mobility in America. On the one hand, two-thirds of families have higher inflation-adjusted incomes than their parents did at a similar age.3Given these favorable odds for each generation to earn a better living than the last, it is no wonder that, even in the depths of the country’s economic slump last year, 8 out of 10 Americans believed it was still possible to “get ahead.”4 Less encouraging, however, are the findings that describe how individuals’ economic rank compares to their parents’ rank at the same age, as well as data showing that race and parental income significantly impact economic mobility. For example, 42 percent of Americans whose parents were in the bottom fifth of the income ladder remain there themselves as adults.5 As for race, blacks are significantly more downwardly mobile than whites: almost half of black children born to solidly middle-income parents tumble to the bottom of the middle-income distribution in adulthood, while just 16 percent of whites experience such a fall.6
With this report, our inquiry focuses on the intersection of incarceration and mobility, fields that might at first seem unrelated. We ask two questions:To what extent does incarceration create lasting barriers to economic progress for formerly incarcerated people, their families and their children? What do these barriers mean for the American Dream, given the explosive growth of the prison population?
The findings in this report should give policy makers reason to reflect. The price of prisons in state and federal budgets represents just a fraction of the overall cost of incarcerating such a large segment of our society. The collateral consequences are tremendous and far-reaching, and as this report illuminates with fresh data and analysis, they include substantial and lifelong damage to the ability of former inmates, their families and their children to earn a living wage, move up the income ladder and pursue the American Dream.
Doug Hamilton Susan K. Urahn
Deputy Director, Managing Director,
I N C A R C E R A T I O N ’ S E F F E C T O N
E C O N O M I C M O B I L I T Y
COLLATERAL COSTS:
EXECUTIVE SUMMARYCurrently 2.3 million Americans are behind bars, equaling more than 1 in 100 adults. Up from just 500,000 in 1980, this marks more than a 300 percent increase in the United States’ incarcerated population and represents the highest rate of incarceration in the world.
Over the last four years, The Pew Charitable Trusts has documented the enormous expense of building prisons and housing inmates that is borne by states and the federal government. Indeed, in the face of gaping budget shortfalls, more than half of the states are now seeking alternative sentencing and corrections strategies that cost less than prison, but can protect public safety and hold offenders accountable. A less explored fiscal implication of incarceration is its impact on former inmates’ economic opportunity and mobility. Economic mobility, the ability of individuals and families to move up the income ladder over their lifetime and across generations, is the epitome of the American Dream. Americans believe that economic success is determined by individual efforts and attributes, like hard work and ambition, and that anyone should be able to improve his or her economic circumstances.
Incarceration affects an inmate’s path to prosperity.Collateral Costs quantifies the size of that effect, not only on offenders but on their families and children. Before being incarcerated more than two-thirds of male inmates were employed and more than half were the primary source of financial support for their children.7 Incarceration carries
significant and enduring economic repercussions for the remainder of the person’s working years. This report finds that former inmates work fewer weeks each year, earn less money and have limited upward mobility. These costs are borne by offenders’ families and communities, and they reverberate across generations.
People who break the law need to be held accountable and pay their debt to society. Prisons can enhance public safety, both by keeping dangerous criminals off the streets and by deterring would be offenders. However, virtually all inmates will be released, and when they do, society has a strong interest in helping them fulfill their responsibilities to their victims, their families and their communities. When returning offenders can find and keep legitimate employment, they are more likely to be able to pay restitution to their victims, support their children and avoid crime.
4
COLLATERAL COSTS:Incarceration’s Effect on Economic MobilityTo calculate the impacts of incarceration on economic mobility, The Pew Charitable Trusts commissioned new analysis by two of the leading researchers in the field, Dr. Bruce Western of Harvard University and Dr. Becky Pettit of the University of Washington. Major findings include the following:
INCARCERATION IS CONCENTRATED AMONG MEN, THE YOUNG, THE
UNEDUCATED AND RACIAL AND ETHNIC MINORITIES—ESPECIALLY
AFRICAN AMERICANS.
• One in 87 working-aged white men is in prison or jail, compared with 1 in 36 Hispanic men and 1 in 12 African American men.
• More young (20 to 34-year-old) African American men without a high school diploma or GED are currently behind bars (37 percent) than employed (26 percent).
INCARCERATION NEGATIVELY AFFECTS FORMER INMATES’
ECONOMIC PROSPECTS.
• Serving time reduces hourly wages for men by approximately 11 percent, annual employment by 9 weeks and annual earnings by 40 percent.
• By age 48, the typical former inmate will have earned $179,000 less than if he had never been incarcerated.
• Incarceration depresses the total earnings of white males by 2 percent, of Hispanic males by 6 percent, and of black males by 9 percent.
FORMER INMATES EXPERIENCE LESS UPWARD ECONOMIC
MOBILITY THAN THOSE WHO ARE NEVER INCARCERATED.
• Of the former inmates who were in the lowest fifth of the male earnings distribution in 1986, two-thirds remained on the bottom rung in 2006, twice the number of those who were not incarcerated.
• Only 2 percent of previously incarcerated men who started in the bottom fifth of the earnings distribution made it to the top fifth 20 years later, compared to 15 percent of men who started at the bottom but were never incarcerated.
THE IMPACTS OF INCARCERATION REACH FAR BEYOND FORMER
INMATES TO THEIR CHILDREN AND FAMILIES.
• 54 percent of inmates are parents with minor children (ages 0-17), including more than 120,000 mothers and 1.1 million fathers.
• 2.7 million children have a parent behind bars — 1 in every 28 children (3.6 percent) has a parent incarcerated, up from 1 in 125 just 25 years ago. Two-thirds of these children’s parents were incarcerated for non-violent offenses.
• One in 9 African American children (11.4 percent), 1 in 28 Hispanic children (3.5 percent) and 1 in 57 white children (1.8 percent) have an incarcerated parent.
A CHILD’S PROSPECT OF UPWARD ECONOMIC MOBILITY IS
NEGATIVELY AFFECTED BY THE INCARCERATION OF A PARENT.
• Previous research has shown that having a parent incarcerated hurts children, both educationally and financially.
• Children with fathers who have been incarcerated are significantly more likely than other children to be expelled or suspended from school (23 percent compared with 4 percent).8
• Family income averaged over the years a father is incarcerated is 22 percent lower than family income was the year before a father is incarcerated. Even in the year after the father is released, family income remains 15 percent lower than it was the year before incarceration.9
• Both education and parental income are strong indicators of children’s future economic mobility.10
With millions of prison and jail inmates a year returning to their communities, it is important to identify policies that address the impact of incarceration on the economic mobility of former inmates and their children. Based on information previously put forward by The Pew Charitable Trusts’ Public Safety Performance Project and Pew’s Economic Mobility Project, this report outlines ways to reduce the productivity losses associated with serving time in jail or prison. These recommendations include the following: • PPrrooaaccttiivveellyy rreeccoonnnneecctt ffoorrmmeerr iinnmmaatteess ttoo tthhee llaabboorr mmaarrkkeett through education and training, job search and placement support and follow-up services to help former inmates stay employed.
• EEnnhhaannccee ffoorrmmeerr iinnmmaatteess’’ eeccoonnoommiicc ccoonnddiittiioonn aanndd mmaakkee wwoorrkk ppaayy by capping the percent of an offenders’ income subject to deductions for unpaid debts (such as court-ordered fines and fees), and expanding the Earned Income Tax Credit to include non-custodial, low-income parents.
• SSccrreeeenn aanndd ssoorrtt ppeeooppllee ccoonnvviicctteedd ooff ccrriimmeess by the risks they pose to society, diverting lower-risk offenders into high-quality, community-based mandatory supervision programs.
• UUssee eeaarrnneedd--ttiimmee ccrreeddiittss,,a proven model that offers selected inmates a shortened prison stay if they complete educational, vocational or rehabilitation programs that boost their chances of successful reentry into the community and the labor market. • PPrroovviiddee ffuunnddiinngg iinncceennttiivveessto corrections agencies and programs that succeed in
reducing crime and increasing employment.
• UUssee sswwiifftt aanndd cceerrttaaiinn ssaannccttiioonnss other than prison, such as short but immediate weekend jail stays, to punish probation and parole violations, holding offenders accountable while allowing them to keep their jobs.
THE GROWTH, SCALE AND CONCENTRATION OF INCARCERATION IN AMERICA
The United States maintains the largest incarcerated population and the highest incarceration rate of any nation in the world.11After three decades of growth, the nation’s vast network of prisons and jails now holds more than 2.3 million inmates, meaning that more than 1 in 100 adults is currently behind bars.12In 1980, there were half a million people locked up in the United States. That number more than doubled by 1990 and grew by another 75 percent the following decade.13In 2008, the number of inmates in America was slightly larger than the populations of Atlanta, Boston, Kansas City (Missouri) and Seattle combined. Figure 1 details the United States’ scale and rate of incarceration compared with those of other countries.
The United States’ prison population did not balloon by accident, nor was its expansion driven principally by surging crime rates or demographic dynamics beyond the control of state leaders. Rather, the growth flowed primarily from changes in sentencing laws, inmate release decisions, community supervision practices and other correctional policies that determine who goes to prison and for how long.14 And while expanded incarceration contributed to the drop in violent crime in the United States during the 1990s, research shows that having more prisoners accounted for only about 25 percent of the reduction, leaving the other 75 percent to be explained by better policing and a variety of other, less expensive factors.15
MALE INCARCERATION RATES BY AGE, RACE AND EDUCATION
Incarceration has become a prominent American institution with substantial collateral consequences for families and communities, particularly among the most disadvantaged. Indeed, the headline about overall corrections numbers conceals more sobering details related to race. Simply stated, incarceration in America is concentrated among African American men. (See Figure 2.) While 1 in every 87 white males ages 18 to 64 is incarcerated and the number for similarly-aged Hispanic males is 1 in 36, for black men it is 1 in 12.16Moreover, as detailed later in these pages, incarceration has implications for individual employment earnings and long-term economic mobility that are collectively amplified for minority communities, often already at a disadvantage in terms of broader financial well-being.
Other disparities surface when education is considered. In particular, those without a high school diploma or GED are far more likely to be locked up than others.17 While 1 in 57 white men ages 20 to 34 is incarcerated, the rate is 1 in 8 for white men of the same age group who lack a high school diploma or GED.
COLLATERAL COSTS: Incarceration’s Effect on Economic Mobility
6
FIGURE 1 THE UNITED STATES HOUSES MORE INMATES THAN THE TOP 35 EUROPEAN COUNTRIES COMBINED
2,500,000 2,000,000 1,500,000 1,000,000 500,000
TOTAL INMATES
Inmate Population, Top 35 European Countries Inmate Population, United States United States Russia Georgia Belarus Latvia Ukraine Estonia Azerbaijan Lithuania Poland Czech Republic Moldova Spain Turkey Albania Luxembourg Hungary Montenegro United Kingdom Slovakia Serbia and Montenegro Malta Romania Bulgaria Armenia Greece Macedonia Portugal Italy Croatia Netherlands Austria France Belgium Germany IrelandSource: International Centre for Prison Studies at King’s College, London, “World Prison Brief,” http://www.kcl.ac.uk/depsta/law/research/icps/worldbrief/wpb_stats.php. Data downloaded June 2010.
Note: Rates are for total number of residents, not just adults. Figures in this chart may not align with others due to counting methods.
IN
M
A
T
E
S
P
E
R
1
0
0
,0
0
0
P
E
O
P
L
E
753 609 483 385 319 314 265 240 230 224 209 184 166 164 159 155 153 153 151 151 144 134 129 124 122 109 109 108 107 107 100 99 96 94 88 85FIGURE 2 WORKING-AGE MEN BEHIND BARS
Rates of incarceration by race, age and education, 2008
White
18- to 64-year olds
1.1%, or 1 in 87
Note: These numbers differ from previous Pew reports primarily because they pertain to working-age men as opposed to all adults. Source: Original analysis for The Pew Charitable Trusts by Bruce Western and Becky Pettit, 2009.
Black 8.0%, or 1 in 12 Hispanic 2.7%, or 1 in 36 20- to 34-year olds 1.8%, or 1 in 57 11.4%, or 1 in 9 3.7%, or 1 in 27 20- to 34-year olds without high school
diploma/GED
12.0%, or 1 in 8 37.1%, or 1 in 3 7.0%, or 1 in 14
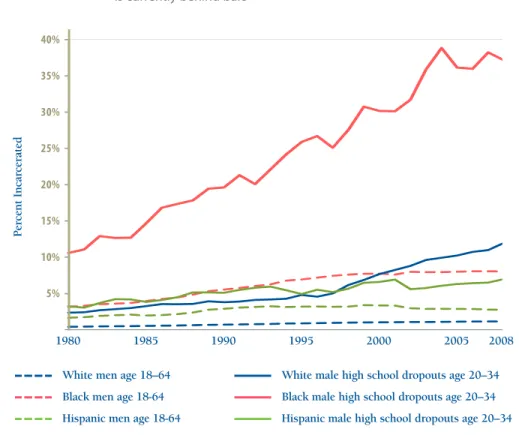
Black men, in particular, face enormously dim prospects when they fail to complete high school. More than one-third (37 percent) of black male dropouts between the ages of 20 and 34 are currently behind bars—three times the rate for whites in the same category. (See Figure 3.) This exceeds the share of young black male dropouts who have a job (26 percent).18 Thus, as adults in their twenties and early thirties, when they should be launching careers, black men without a high school diploma are more likely to be found in a cell than in the workplace.
The data about incarceration in America show that for many men growing up in the post-civil-rights era, prison looms as an increasingly predictable destination. That fact makes it critical to explore how serving time may carry long-term economic disadvantages that translate into downward mobility not only for the formerly incarcerated, but for their children as well.
COLLATERAL COSTS: Incarceration’s Effect on Economic Mobility
8
FIGURE 3 INCARCERATION RATE RISING
More than one in three young, black men without a high school diploma is currently behind bars
40% 35% 30% 25% 20% 15% 10% 5% P er ce n t In ca rc er at ed
Source: Original analysis for The Pew Charitable Trusts by Bruce Western and Becky Pettit, 2009.
White men age 18–64 Black men age 18-64 Hispanic men age 18-64
White male high school dropouts age 20–34 Black male high school dropouts age 20–34 Hispanic male high school dropouts age 20–34
THE IMPACT OF INCARCERATION ON EMPLOYMENT, WAGES AND ECONOMIC MOBILITY
Americans believe strongly that individuals determine their own economic success through hard work, ambition and other personal characteristics.19 Subject to reasonable restrictions then, former inmates should be able to pay their debt to society, work hard and chart a new and law-abiding course toward economic stability and even improvement. This was a driving sentiment behind the passage of the Second Chance Act, a bipartisan bill signed into law in 2008 by President George W. Bush. Unfortunately, the reality is different. Incarceration casts a long-lasting shadow over former inmates, reducing their ability to work their way up. The obstacles they face upon leaving prison compound the wages and skills lost during the period of incarceration itself.
When inmates return home, they are suddenly confronted with all of the demands and responsibilities of everyday life, as well as the repercussions of their prior choices. Any professional work skills they had before may have eroded, and their social networks—the family and friends who might help them in finding and securing jobs—may well be frayed.20 On top of these challenges, many inmates emerge with substantial financial obligations, including child support, restitution and other court-related fees.21
10
COLLATERAL COSTS: Incarceration’s Effect on Economic MobilityIS IT INCARCERATION OR ARREST AND CONVICTION?
22This report provi des new analysis that documents costs of incarceration that extend well beyond state budgets to the employment and earnings prospects of former inmates and their families. Because incarceration typically is preceded by arrest and conviction, it is important to establish whether incarceration—in itself—negatively affects economic mobility above and beyond what would be expected in a case involving arrest, conviction and a non-incarceration sentence.
In the absence of experimental conditions (which, in the context of crime and punishment, are rare), it can be difficult to substantiate these points. Non-experimental research designs require imperfect comparisons of former inmates with not-incarcerated individuals who share as many other attributes as possible. While no such study can account for all possible differences, several have tried to control for the most likely and important. Two studies offer evidence that distinguishes the effects of incarceration from the effects of arrest and conviction. • Freeman23 (1991) uses survey responses to identify the separate impacts of arrest,
conviction and incarceration, while controlling for demographic, educational, criminal and other individual attributes. His analysis found substantial negative employment effects attributable specifically to incarceration.
• Grogger24(1995) also modeled the impact of arrest, conviction, jail and imprisonment
on earnings and found substantial negative consequences specific to incarceration. While his findings for imprisonment may reflect lost earnings during the period of incarceration, his findings for a jail effect persist for over a year, after the period in which the incarceration would end.
While these and other studies25have their own specific limitations, the preponderance of
evidence suggests that incarceration—above and beyond arrest and conviction—negatively affects individual economic prospects.
There are several paths through which serving a term of incarceration may adversely affect employment prospects:
• Inmates are necessarily withdrawn from society and have severely limited opportunity to gain work experience while incarcerated.
• Inmates build relationships with a highly criminally active peer group, a factor that may permanently alter their future work trajectory.
• Released inmates usually are placed on parole or some form of supervision, a status that increases the likelihood of future incarceration spells since violations of supervision rules are grounds for return to prison.
• Incarceration can generate child support arrearages for non-custodial fathers, a factor that may decrease the incentive to work.
Tossed into a competitive labor market, former inmates are viewed suspiciously by many prospective employers. They bear the indelible stigma of incarceration that ranks them low on any list of job candidates, and face a number of laws barring them from working in certain occupations.26 Finally, while some employers might be inclined to hire a former inmate, many are dissuaded from doing so by potential legal and financial liabilities.27
INCARCERATION AND WORK
Former inmates experience relatively high levels of unemployment and below-average earnings in large part because of their comparatively poor work history and low levels of education.28 Incarceration further compounds these challenges.
When age, education, school enrollment, region of residence and urban residence are statistically accounted for, past incarceration reduced subsequent wages by 11 percent, cut annual employment by nine weeks and reduced yearly earnings by 40 percent.29(See Figure 4.)
Interestingly, when number of years of work experience also is statistically controlled, the estimated effect of incarceration on all of
the above outcomes does not change much. This implies that incarceration’s effect on economic outcomes has much more to do with having been convicted and imprisoned than it does with the work experience lost while imprisoned. In other words, having a history of incarceration itself impedes subsequent economic success.
PAST INCARCERATION
REDUCED SUBSEQUENT WAGES BY 11 PERCENT, CUT ANNUAL EMPLOYMENT BY NINE WEEKS AND REDUCED YEARLY EARNINGS BY 40 PERCENT.
FIGURE 4 INCARCERATION REDUCES EARNINGS POWER
Estimated effect of incarceration on male wages, weeks worked, and annual earnings, predicted at age 45
Source: Original analysis for The Pew Charitable Trusts by Bruce Western and Becky Pettit, 2009.
If not incarcerated Post-Incarceration $16.33/hr. $14.57/hr. If not incarcerated Post-Incarceration 48 weeks 39 weeks If not incarcerated Post-Incarceration $39,100 $23,500
INCARCERATION AND LOST EARNINGS
The fact that former inmates make less per hour, work fewer weeks per year, and reap lower annual earnings than their counterparts has implications for their earnings trajectory. When the impact of incarceration on earnings is traced through the peak earning years, the aggregate losses are sizable. On average, incarceration eliminates more than half the earnings a white man would otherwise have made through age 48, and 41 and 44 percent of the earnings for Hispanic and black men, respectively. (See Table 1.) That amounts to an expected earnings loss of nearly $179,000 just through age 48 for people who have been incarcerated.30 Of note, these losses do not include earnings forfeited during incarceration; they reflect instead a sizable lifelong earnings gap between former inmates and those never incarcerated. Facing a competitive marketplace, carrying the stigma of incarceration, and juggling the responsibility of ongoing financial demands such as fees and restitution, many of the formerly incarcerated find the pursuit of legitimate economic solvency—let alone prosperity—difficult. These challenges impact not only former inmates themselves, but also their families and broader communities.
Another way to understand the lost earnings associated with incarceration and its after-effects is to express it as a share of the aggregate earnings of allmen—incarcerated or not—through age 48, as shown by race in Table 1. The sum of the earnings lost by white men who have been incarcerated is equal to 2 percent of the total earnings that would otherwise have been expected across all white men. Moreover, because Hispanic and black men are more likely to serve a term of incarceration, their communities lose a larger share of overall male earnings. The lost earnings associated with incarceration are equal to 6 percent of total expected Hispanic male earnings and 9 percent of totalexpected black male earnings.
TABLE 1
AGGREGATE IMPACT OF INCARCERATION ON EARNINGS
White men
Percent incarceration reduces former
inmates’ earnings 52% 41% 44%
Reduction in earnings as a percent
of all male earnings 2% 6% 9%
Note: Percentages reflect earnings loss through age 48.
Source: Original analysis for The Pew Charitable Trusts by Bruce Western and Becky Pettit, 2009.
Hispanic men Black men
12
COLLATERAL COSTS: Incarceration’s Effect on Economic Mobility“THE ECONOMIC OUTPUT OF PRISONERS IS MOSTLY
LOST TO SOCIETY WHILE THEY ARE IMPRISONED. THESE NEGATIVE PRODUCTIVITY EFFECTS CONTINUE AFTER RELEASE.”
Jim Webb
United States Senator (D-VA)
FIGURE 5 OMITTING INMATES DISTORTS EMPLOYMENT PICTURE
Young, black men without a high school diploma more likely to be incarcerated than employed 70% 60% 50% 40% 30% 20% 10%
Source: Original analysis for The Pew Charitable Trusts by Bruce Western and Becky Pettit, 2009.
Employment-to-population rate (excluding inmates) Employment-to-population rate (including inmates) Incarceration rate 1 9 8 0 1 9 8 2 1 9 8 4 1 9 8 6 1 9 8 8 1 9 9 0 1 9 9 2 1 9 9 4 1 9 9 6 1 9 9 8 2 0 0 0 2 0 0 2 2 0 0 4 2 0 0 6 2 0 0 8
BLACK MEN AGES 20-34
WITH LESS THAN A HIGH SCHOOL DIPLOMA:
THE HIDDEN LABOR MARKET
The economic crisis turned all eyes toward the nation’s unemployment rate, which recently crested above 10 percent—the highest level in a quarter century. Employment figures tell us much about the financial health of the nation, and are critical for understanding who is moving ahead and who is falling behind. However, conventional methods of assessing employment exclude the men and women behind bars, resulting in an incomplete picture. Now, with more than 2.3 million adults incarcerated, the effect of this omission has become too substantial to ignore.
Conventional labor force surveys that omit inmates create an unrealistically rosy portrait of the productive engagement of men, particularly younger minorities with limited
COLLATERAL COSTS: Incarceration’s Effect on Economic Mobility
14
FIGURE 6 OMITTING INMATES UNDERSTATES RACIAL EMPLOYMENT DISPARITIES
Incarceration disproportionately affects levels and trends of black employment
70% 80% 90% 60% 50% 40% 30% 20% 10%
Source: Original analysis for The Pew Charitable Trusts by Bruce Western and Becky Pettit, 2009.
White men, excluding inmates White men, including inmates Black men, excluding inmates Black men, including inmates
1 9 8 0 1 9 8 2 1 9 8 4 1 9 8 6 1 9 8 8 1 9 9 0 1 9 9 2 1 9 9 4 1 9 9 6 1 9 9 8 2 0 0 0 2 0 0 2 2 0 0 4 2 0 0 6 2 0 0 8
EPOP FOR MEN AGES 20-34 WITH LESS THAN A HIGH SCHOOL DIPLOMA:
E m p lo y m en t-to -P o p u la ti o n R at e (E P O P )
education. To understand why, imagine a survey of student health that omits all the pupils who happen to be home sick that day. By ignoring the absent, ailing students, the survey would produce a distorted representation of the student body, making it appear healthier than it actually is.
A fundamental statistic for assessing labor market engagement and the economic health of a group of people is the employment-to-population rate (EPOP): the share of people in any group who are currently employed (100 percent would be full employment). A comparison of EPOP rates with and without inmates included provides another way to assess the scale of incarceration and a more complete portrait of economic health.31
For example, the EPOP for working age (18–64) black men falls by more than five points, from 67 to 61 percent, when inmates are included. For black men 20 to 34 years old, the EPOP falls by nearly eight points, from 66 to 58 percent. Add education levels to the mix and the gap becomes more dramatic. For black men ages 20–34 without a high school diploma, the EPOP plummets 16 percentage points, from 42 to 26 percent, when inmates are included. That is, using an EPOP figure that excludes inmates creates the impression that these men are 4.5 percentage points more likely to be employed than incarcerated. In fact, younger, less educated black men are 11 percentage points more likely to be incarcerated (37 percent) than employed (26 percent), as shown in Figure 5.
Because the white male incarceration rate is relatively low, the effect of excluding white male prisoners from labor force surveys is far less dramatic. One consequence, however, is that the white-black and white-Hispanic employment gap is understated when inmates are excluded. For example, the white-black gap in EPOP for men ages 20–34 climbs from 16 percent to 23 percent when inmates are counted. (See Appendix A-3 for more details.) The employment decline of black men also looks more severe when inmates are counted, a pattern exacerbated by the nation’s rising rate of incarceration over the past 30 years. (See Figure 6.) The country’s relatively modest scale of incarceration in 1980, for instance, is reflected in the small gap between the unadjusted EPOP among young high school dropouts and one accounting for those in prison and jail: 7 percentage points for black men and 2 points for white men. In 2008, however, the comparatively high rate of incarceration shows clear effects. The difference between unadjusted and adjusted EPOPs for whites is 8 percentage points, while it is twice that for blacks—16 points. Overall, the decline in prospects for men ages 20–34 without a high school diploma is understated when incarcerated populations are excluded. The EPOP of blacks in this category appears to drop 21 percentage points over the 28-year span when inmates are excluded from the analysis, but is revealed to have dropped 29 points when inmates are included. The corresponding figures for whites in the same category are 10 and 16 points, respectively.
INCARCERATION AND ECONOMIC MOBILITY
Comparing changes in the individual earnings and family incomes of men who spent time incarcerated during the past two decades with those of men who did not, offers additional evidence of incarceration’s economic ripple effects. Put simply, men imprisoned and released between 1986 and 2006 were significantly less upwardly mobile than those who did not spend time behind bars.32 Typically, one would expect maturity, hard work and experience to gradually produce promotions and bigger paychecks. However, in both relative and absolute terms, those who had been convicted of crimes and incarcerated in this time period had much less success in getting ahead.
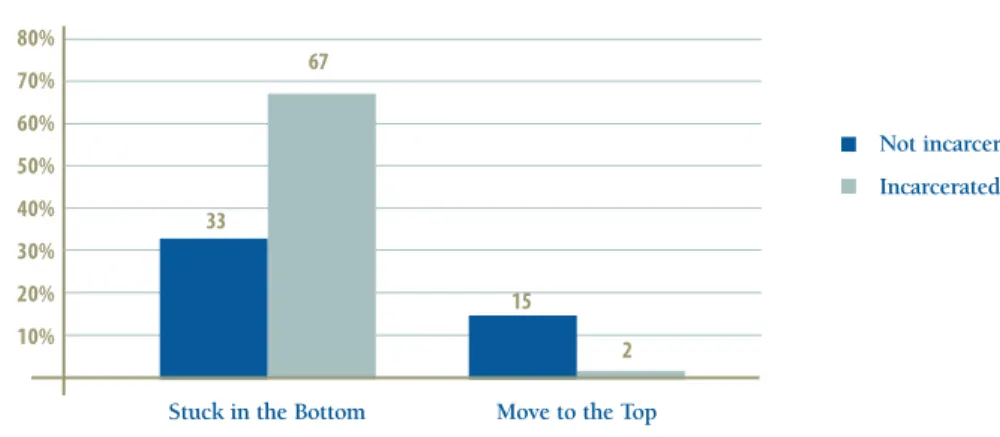
Analyses of relativeeconomic mobility, which looks at the extent to which individuals are able to move up the rungs of the earnings ladder relative to their peers, reveal much less mobility for incarcerated men than for non-incarcerated men. For the formerly incarcerated who had earnings in the bottom fifth, or quintile, of the distribution in 1986, two-thirds (67 percent) remained at the bottom of the earnings ladder 20 years later in 2006.33 (See Figure 7.) By comparison, only one-third of men who were not incarcerated during that time frame remained stuck at the bottom. Moreover, the odds of moving from the bottom of the earnings distribution to the very top quintile were particularly low for offenders. They had only a 2 percent chance of making such a climb, compared with a 15 percent chance for those who had not served time behind bars. Analyzing relative family income mobility over those two decades yields similar results. (Family income reflects the resources brought in by all family members, and thus reflects additional income men might have access to through cohabitation or marriage; it also reflects non-earnings sources of income such as public assistance.)
FIGURE 7 INCARCERATION INCREASES STICKINESS AT THE BOTTOM OF THE EARNINGS LADDER
Percent of men in the top and bottom of the earnings distribution in 2006 who were in the bottom in 1986
80% 70% 60% 50% 40% 30% 20% 10%
Stuck in the Bottom Move to the Top
Not incarcerated Incarcerated
Source: Original analysis for The Pew Charitable Trusts by Bruce Western and Becky Pettit, 2009. 33
67
15
2
COLLATERAL COSTS: Incarceration’s Effect on Economic Mobility
16
Incarceration also lowers absolute economic mobility among the formerly incarcerated. Measuring absolute mobility, rather than tracking changes in a person’s position in the earnings distribution relative to others, involves determining whether a person is earning less or more money over time.
There are several ways to examine absolute economic mobility. The research for this report simply examined how likely it was for men’s earnings to exceed a particular level over 20 years. It finds that, among men who started out in the bottom fifth of earnings in 1986 (earning less than $7,800), those who were previously incarcerated were more likely than those who were never incarcerated to have earnings in 2006 that remained below $7,800.34 (See Figure 8.) Among never-incarcerated men, just 8
percent had earnings this low in 2006, whereas among previously incarcerated men, 21 percent did. Alternatively, a never-incarcerated man who started out in the bottom fifth in 1986 had a 54 percent chance in 2006 of earning above $36,400 in inflation-adjusted dollars, which would have put them in the top fifth in 1986. Among previously incarcerated men, the likelihood was just 16 percent.
Overall, the economic experiences of former inmates show that the costs of incarceration are not limited to the justice system itself.
Instead, the fiscal consequences of the nation’s incarceration boom extend well beyond strained state budgets, impairing the livelihoods of former inmates and, by extension, the well-being of their families and communities.
FIGURE 8 INCARCERATION HINDERS EARNINGS GROWTH
2006 earnings position for men who earned less than $7,800 in 1986
70% 60% 50% 40% 30% 20% 10%
Still earned less than $7,800 in 2006
(Bottom 1986 earnings quintile)
Earned more than $36,400 in 2006
(Top 1986 earnings quintile)
Not incarcerated Incarcerated
Note: All earnings in 2006 dollars.
Source: Original analysis for The Pew Charitable Trusts by Bruce Western and Becky Pettit, 2009. 8
21
54
16
THE FISCAL CONSEQUENCES OF THE NATION’S INCARCERATION BOOM EXTEND WELL BEYOND STRAINED STATE BUDGETS, IMPAIRING THE LIVELIHOODS OF FORMER INMATES AND, BY EXTENSION, THE WELL-BEING OF THEIR FAMILIES AND
THE INTERGENERATIONAL IMPACT OF INCARCERATION
Hidden behind the growing crowd of men and women behind bars in America is another, often overlooked population—their children. Inadvertent victims of their parents’ crimes, children of inmates weather a host of repercussions, from the emotional and psychological trauma of separation to an increased risk of juvenile delinquency.35
Incarceration also creates economic aftershocks for these children and their families. Disrupted, destabilized and deprived of a wage-earner, families with an incarcerated parent are likely to experience a decline in household income as well as an increased likelihood of poverty.36The struggle to maintain ties with a family member confined in an often-distant prison creates additional financial hardship for already fragile families left behind.
CHILDREN WITH INCARCERATED PARENTS
The growth of incarceration in America has intergenerational impacts that policy makers will have to confront. According to this analysis, more than 1.2 million inmates—over half of the 2.3 million people behind bars—are parents of children under age 18. This includes more than 120,000 mothers and more than 1.1 million fathers. The racial concentration that characterizes incarceration rates also extends to incarcerated parents. Nearly half a million black fathers, for example, are behind bars, a number that represents 40 percent of all incarcerated parents. The most alarming news lurking within these figures is that there are now 2.7 million minor children (under age 18) with a parent behind bars. (See Figure 9.) Put more starkly, 1 in every 28 children in the United States— more than 3.6 percent—now has a parent in jail or prison. Just 25 years ago, the figure was only 1 in 125.
For black children, incarceration is an especially common family circumstance. More than 1 in 9 black children has a parent in prison or jail, a rate that has more than quadrupled in the past 25 years. (See Figure 10.)
Because far more men than women are behind bars, most children with an incarcerated parent are missing their father.37For example, more than 10 percent of African American children have an incarcerated father, and 1 percent have an incarcerated mother.
THE IMPACT OF PARENTAL INCARCERATION
With 2.7 million children growing up with a mother or father behind bars, the effects of parental incarceration on children’s well-being and their prospects for economic mobility merit serious scrutiny. At present, American longitudinal studies do not track children of recently incarcerated parents into their wage-earning years, complicating attempts to fully
COLLATERAL COSTS: Incarceration’s Effect on Economic Mobility
18
“PEOPLE SOMETIMES MAKE BAD CHOICES. AS A RESULT, THEY END UP IN PRISON OR JAIL. BUT WE CAN’T PERMIT INCARCERATION OF A PARENT TO PUNISH AN ENTIRE FAMILY.”
Eric Holder
United States Attorney General
FIGURE 9 RISING NUMBERS OF CHILDREN WITH INCARCERATED PARENTS
Minor children outnumber incarcerated parents by more than 2 to 1 3,000,000 2,500,000 2,000,000 1,500,000 1,000,000 500,000
Source: Original analysis for The Pew Charitable Trusts by Bruce Western and Becky Pettit, 2009.
Minor children with an incarcerated parent Inmates with minor children
1 9 8 0 1 9 8 2 1 9 8 4 1 9 8 6 1 9 8 8 1 9 9 0 1 9 9 2 1 9 9 4 1 9 9 6 1 9 9 8 2 0 0 0 2 0 0 2 2 0 0 4 2 0 0 6 2 0 0 8
FIGURE 10 ONE IN NINE BLACK CHILDREN HAVE AN INCARCERATED PARENT
Racial disproportion in incarceration reflected by children left behind 12% 10% 8% 6% 4% 2%
Source: Original analysis for The Pew Charitable Trusts by Bruce Western and Becky Pettit, 2009.
Black children Hispanic children White children 1980 1985 1990 1995 2000 2005 2008 11.4% 10.1% 6.6% 2.6% 3.5% 3.7% 3.2% 1.3% 1.8% 1.4% 0.9% 0.4% P er ce n t o f C h il d re n w it h a n I n ca rc er at ed P ar en t 2.7 1.2
20
COLLATERAL COSTS: Incarceration’s Effect on Economic MobilityWHY PARENTS ARE INCARCERATED
While one-third of incarcerated parents are serving time for a violent crime, the offenses of the other two-thirds were non-violent, with more than one-quarter of all convictions coming from drug offenses. All told, 1 percent of all children currently have a parent serving time for a drug crime.
As with other dimensions of the incarceration picture, racial disproportion shows up not just in overall rates of parental incarceration but also when parents’ conviction offenses are examined. More black children, for instance, have a parent locked up for a violent offense (3.9 percent)—or a drug offense (3.8 percent)—than do Hispanic (3.5 percent) or white kids (1.8 percent) for all offenses combined. (See Figure 11.)
FIGURE 11 LIKELIHOOD OF PARENTAL INCARCERATION
Percent of children with incarcerated parent by race and offense type
Source: Original analysis for The Pew Charitable Trusts by Bruce Western and Becky Pettit, 2009.
Violent Drug Property Other
12% 10% 8% 6% 4% 2%
All White Black Hispanic
3.9% 3.8% 2.0% 1.8% 1.1% 1.0% 0.6% 0.8% 1.2% 1.0% 0.7% 0.7% 0.6% 0.5% 0.4% 3.6% 1.8% 11.4% 3.5% 0.3%
capture the intergenerational impact of incarceration on mobility. However, previous research by the Economic Mobility Project suggests that two factors influenced by parental incarceration—family income and children’s educational outcomes—have direct implications for children’s future upward economic mobility.38
When a wage-earning parent is incarcerated, families often must scramble to make ends meet. Research shows that more than two-thirds of men admitted to prison had been employed.39 Almost half—44 percent—of parents held in state prisons lived with their children prior to incarceration,40 and more than half of imprisoned
parents (52 percent of mothers and 54 percent of fathers) were the primary earners for their children.41 While in prison, parents are no longer able to provide substantial economic support to their families. Research illustrates the economic damage this reality inflicts on children. One study examined the financial well-being of children before, during and soon after the incarceration of a father. It found that in the period
that the father was behind bars, the average child’s family income fell 22 percent compared with that of the year preceding the father’s incarceration.42Family income rebounded somewhat in the year after release, but was still 15 percent lower than in the year before incarceration.43 Data from the Economic Mobility Project show that parental income is one of the strongest indicators of one’s own chances for upward economic mobility. Forty-two percent of children who start out in the bottom fifth of the income distribution remain stuck in the bottom themselves in adulthood.44Having parents at the bottom of the income ladder is even more of a barrier for African Americans, 54 percent of whom remain in the bottom themselves as adults.45
Research also indicates that children whose parents serve time have more difficulty in school than those who do not weather such an experience. One study found that 23 percent of children with a father who has served time in a jail or prison have been expelled or suspended from school, compared with just 4 percent of children whose fathers have not been incarcerated.46 Research that controls for other variables suggests that paternal incarceration, in itself, is associated with more aggressive behavior among boys47and an increased likelihood of being expelled or suspended from school.48
This is especially troubling given the powerful impact education has on one’s upward economic mobility in adulthood. Among those who start at the bottom of the income ladder, 45 percent remain there in adulthood if they do not have a college degree, while only 16 percent remain if they obtain a degree.49And, children who start in the bottom of the income ladder quadruple their chances of making it all the way to the top if they have a college degree.50 As a new generation of children are touched by the incarceration of a parent, and especially as those children feel the impact of that incarceration in their family incomes and their educational success, their prospects for upward economic mobility become significantly dimmer.
ONE IN EVERY 28 CHILDREN IN THE UNITED STATES—MORE THAN 3.6 PERCENT—NOW HAS A PARENT IN JAIL OR PRISON. JUST 25 YEARS AGO, THE FIGURE WAS ONLY 1 IN 125.
22
COLLATERAL COSTS: Incarceration’s Effect on Economic Mobility PROMOTING ECONOMIC MOBILITYThe best way to avoid the consequences of prison is to avoid prison itself—for individuals to avoid crime, and for policy makers to use imprisonment selectively in their response to crime. While this report does not address why incarceration is so prevalent in America, most would agree that it is in society’s and the economy’s best interest to reduce crime rates and the resulting numbers of people behind bars. However, given the fact that so many people do end up in prison, we also are concerned with the serious repercussions for them, their children and families, and broader society. Once offenders pay their debt to society, Americans expect them to rejoin their communities, take legitimate jobs, provide for their families, and become taxpayers—rather than tax burdens. The severe and lingering impact of incarceration on the economic prospects of former inmates makes that expectation elusive. The financial consequences of incarceration are complex and extend beyond inmates to their families and communities. And when returning inmates fail, they cost society all over again, in the form of more victims, more arrests, more prosecutions, and still more prisons.
Although big social and economic challenges often seem to defy realistic intervention, policy makers are not without options as they seek to improve both public safety and economic opportunity. One approach is to remove barriers to opportunity that stand between the prison gate and the labor market. A second strategy is to contain prison and jail growth in ways that protect public safety and hold offenders accountable.
FROM PRISON TO WORK
The first approach is straightforward and begins with the proactive reconnection of former inmates with the job market. Research on the process of transitioning from prison back to the community has documented the importance of securing stable employment as a critical contributing factor to successful reentry.51 However, there are numerous barriers, both formal and informal, for ex-inmates who are seeking work. Formerly incarcerated people can be prohibited by law from working in many industries, living in public housing, and receiving various governmental benefits, including Temporary Assistance for Needy Families (TANF), food stamps and educational benefits.52 And the stigma of having a felony record can be an insurmountable obstacle when a former inmate is eligible for employment. Job seekers with a criminal record are offered half as many positions as those without criminal records, and African American applicants receive two-thirds fewer offers.53 These scenarios are the catalyst for efforts by some to remove the collateral consequences of incarceration and to “ban the box,” which would prevent employers from requiring that job seekers disclose past criminal convictions on job applications.54 Providing education, job training opportunities and work supports to offenders—both before and immediately after their release from prison or jail—has been shown to help
“EVERYBODY— THE EX-OFFENDER, THE EX-OFFENDER’S FAMILY
AND SOCIETY AT LARGE —BENEFITS FROM PROGRAMS THAT EQUIP PRISONERS WITH THE PROPER TOOLS TO SUCCESSFULLY REINTEGRATE INTO LIFE OUTSIDE OF THE
PRISON WALLS.”
Sam Brownback
United States Senator (R-KS)
these individuals secure employment and break the cycle of crime. A study of more than 3,600 offenders across Maryland, Ohio and Minnesota found that offenders who participated in prison education programs were 29 percent less likely to be re-incarcerated than non-participants.55And in a cost-benefit analysis of crime-reduction programs from across the United States over the past 25 years, the Washington State Institute for Public Policy found significant gains to taxpayers from several workforce programs in terms of both reduced recidivism and cost savings from reduced crime. In-prison vocational programs produced net benefits of $13,738 per offender (a return of $12.62 for every dollar invested), and adult general education produced net benefits of $10,669 per offender (or $12.09 per dollar invested). Employment and job training services for offenders in the community yielded $4,359 per offender, the equivalent of $11.90 per dollar invested.56 Unfortunately, the availability of comprehensive education and workforce training programs is rare, and those that do exist have low participation rates; only about 10 percent of all inmates attend educational, vocational or treatment programs on a given day.57Policy makers therefore might consider expanding and bringing to scale proven education and job training programs that combine job search and placement support with services that address former inmates’ specific barriers to employment, such as low skills or substance abuse.
Policy makers also could heed recent calls58 to subsidize transitional work programs— often minimum wage manual jobs—for formerly incarcerated people. Evidence of these programs’ effectiveness extends back at least three decades to the National Supported Work Demonstration (evaluated 1975–1978), a randomized trial that reduced arrests by 22 percent for former prisoners over age 26.59 Another example, the ComALERT program (evaluated 2004–2006), that combined supported employment with
housing and substance-abuse treatment, was found to reduce arrests by nearly 20 percent.60Such programs aim to prevent relapse to drug use and crime by intervening in the critical weeks and months after release from prison, thereby helping former inmates chart a new course toward stable employment and economic self-sufficiency. Another obstacle to former inmates’ economic viability is the money many owe for court or supervision fees, victim restitution or child support. These financial obligations are important mechanisms to repay debts, support children and hold offenders accountable, and
former inmates should be required and given incentives to pay them. However, efforts to enforce these obligations can also be self-defeating. A report by the Council of State Governments Justice Center, for example, found that 12 percent of probation revocations—returns to incarceration for violations—were due in part to a probationer’s failure to make required payments.61If inmates are sent back to prison, they obviously lose the ability to pay child support, debts and other obligations. When supervised properly in the community, probationers and parolees can repay their debts while building work skills and an employment track record. For example, in just one year, offenders in Colorado serving their sentences in community residential programs paid more than $5 million in child support and state and federal taxes in addition to nearly $12 million for their own housing.62
PROVIDING EDUCATION, JOB TRAINING OPPORTUNITIES AND WORK SUPPORTS TO OFFENDERS—BOTH BEFORE AND IMMEDIATELY AFTER THEIR RELEASE FROM PRISON OR JAIL—HAS BEEN SHOWN TO HELP THESE INDIVIDUALS SECURE EMPLOYMENT AND BREAK THE CYCLE OF CRIME.
24
COLLATERAL COSTS: Incarceration’s Effect on Economic MobilityFinancial liens and garnishments against future earnings can detract from the rewards of working for a living and undermine former inmates’ efforts to regain their economic footing in the community. In some instances, debts garnished from their wages, such as those owed to the criminal and civil justice systems, when combined with regular taxation can impose effective tax rates as high as 65 percent.63 To encourage work, some experts have suggested expanding the Earned Income Tax Credit (EITC) for low-earning non-custodial parents.64A refundable tax credit available to low-income working families,
the EITC has been shown by research to produce substantial increases in employment and reductions in both welfare receipt and poverty.65 For example, economists calculate that expansions of the EITC in 1993 and 1996 helped more than half a million families move off of welfare and into the labor market.66This is because people must work to be eligible for the credit, and among those with very low earnings, the credit increases as earnings increase. However, under current federal income tax rules, low-income non-custodial parents are ineligible for the EITC benefits available to families with children, even when they support their children through full payment of child support.67 Researchers estimate that as many as 645,000 non-custodial parents would be eligible for the EITC, and that it would increase their annual incomes by $500 to $1,900—an increase of 6 to 12 percent in income after taxes and child support payments.68 This would represent a meaningful increase in income, and a substantive incentive to work. Coupled with the powerful success of the EITC in encouraging single parents to work, extending the child-based EITC to non-custodial parents could hold the potential for dramatically enhancing their upward economic mobility prospects.
CONTAINING THE CORRECTIONS POPULATION
On another track, policy makers striving to reduce the impact of incarceration on economic mobility in America can take steps to control the size of the prison population. In recent years, a variety of states, led by members of both major political parties as well as independents, have launched public safety initiatives that are accomplishing that goal while cutting spending.
To be clear, violent and career criminals need to be put behind bars for significant terms. At the same time, lower-risk offenders can be diverted to a system of high-quality community supervision, services and tough sanctions that reduces recidivism and enhances public safety while costing far less than prison. States and courts must properly screen and sort offenders who are appropriate for community corrections and then work to address the risk and need factors that drive their criminality. “Technical violators,” offenders who have broken the rules of their probation or parole but not necessarily committed new crimes, make up as much as half to two-thirds of prison admissions in some states and are a particularly large target for diversion.69
Every day spent under community supervision rather than behind bars is an opportunity for a sentenced individual to work. It’s an opportunity to build vocational experience,
WHEN SUPERVISED PROPERLY IN THE COMMUNITY, PROBATIONERS AND PAROLEES CAN REPAY THEIR DEBTS WHILE BUILDING WORK SKILLS AND AN EMPLOYMENT
to care for children, and to pay victim restitution and other fines and fees. Rather than draining resources from the public coffer as inmates, offenders supervised in the community can pay their own way and make amends to their victims for the harms they caused. Recent statistics show that, on average, a day in state prison costs nearly $80 compared with a day on probation supervision, which costs just $3.50.70In other words, one day in prison costs more than 22 days of probation. Instead of spending $80 on one person for one day in prison, states could double the intensity of probation supervision and services for that offender plus nine current probationers and still have $10 left over. As this example shows, even modest reductions in incarceration can free up funds states can use to more effectively and safely monitor people on parole and probation and strengthen supervision and behavior modification programs that have been proven to reduce recidivism. One approach to containing prison populations and limiting incarceration for low-level offenders is the use of earned time credits. Earned credits encourage better inmate behavior behind bars and more success stories once they return home by offering inmates a shortened prison stay if they build their human capital by participating in educational, vocational or rehabilitation programs. Completion of such programs
reduces risk inside and outside of prison while containing correctional costs and freeing up funds for other taxpayer priorities.71 A recent report from the National Conference of State Legislatures found that at least 31 states provide some type of earned time incentives.72 Among them is Washington, which in 2003 expanded the amount of earned time available to selected nonviolent drug and property offenders from 33 percent of the total sentence to 50 percent of the sentence. A follow-up study found that offenders who earned the credits had fewer new felony convictions and that prison stays for the eligible offenders dropped by more than two months, saving the state
money on incarceration costs.73 New York has experienced similar crime and cost-saving benefits under its merit time program,74 and Kansas reports significant declines in both parolee crime and parole revocations since its earned time policy took effect.75
To maintain the viability of these earned time options, policy makers must resist the temptation to cut those inmate programs that have been proven to improve behavior and reduce recidivism. Though much appears in jeopardy during these difficult budget years, the elimination of such programs will likely end up costing more than it saves: parole or releasing authorities generally hold inmates longer behind bars if they haven’t completed programs, which adds to imprisonment costs, and then higher recidivism rates mean more new victims of crime and an accelerated revolving door.
Similar earned time credits can be offered to offenders on probation and parole to encourage compliance and avoid incarceration for violations. Nevada and Arizona recently enacted legislation that grants early termination from community supervision for parolees
“PERHAPS THE BIGGEST WASTE OF RESOURCES IN ALL OF STATE GOVERNMENT IS THE OVER-INCARCERATION OF NONVIOLENT OFFENDERS AND OUR MISHANDLING OF DRUG AND ALCOHOL OFFENDERS.”
William Ray Price
Chief Justice, Missouri Supreme Court
who toe the line by obeying rules and paying court-ordered restitution.76 This serves to simultaneously encourage law-abiding behavior for those who want to get a clean start while targeting more intensive supervision and services toward those who pose a greater risk to public safety. The net result of this more efficient use of resources is less crime, fewer trips back to prison and taxpayer savings.
While shorter supervision terms can be a powerful behavioral incentive to offenders, fiscal rewards can help motivate corrections agencies to get better results with the people under their watch. The basic model is for counties and other localities (or even state-level agencies) to receive a share of the savings accrued at the state level through the reduction in imprisonment that springs from improved community supervision success rates. Kansas and Arizona are already well down this path, and the legislatures of Illinois and California followed suit in 2009.77
The efficacy of a third tactic is evident in Hawaii. Hawaii’s Opportunity Probation with Enforcement (HOPE), conceived by a former federal prosecutor who is now a judge, employs strategies identified by research into what works in community corrections.78 HOPE’s winning ingredients are frequent drug tests and swift and certain sanctions—short but quickly imposed jail stays for drug use or other probation violations. To minimize disruptions of ongoing employment, these jail sanctions are imposed over the weekend for probationers with paycheck jobs. Arrest warrants are issued for those who skip appointments, drug treatment is provided for those who cannot stay clean without assistance, and probation officers get additional training to work with their increasingly compliant caseloads. A recent evaluation supported by the U.S. Department of Justice found that the program had reduced arrests for new crimes by 55 percent, missed probation appointments by 61 percent, and drug use by 72 percent.79 And, due to decreased misbehavior and crime, HOPE probationers use less, not more, prison space.80 The model is now the focus of bipartisan federal legislation81 and replication programs are under development in several states.
CONCLUSION
Manifest in the American Dream is the belief that no matter where one begins, with hard work and perseverance anyone can climb the economic ladder. Since the nation’s founding, this dream has served as inspiration for all its citizens. However, research conducted by Pew’s Economic Mobility Project demonstrates that while the American Dream is alive and well for many, it is elusive for others and can be influenced by many factors, including one’s educational and financial assets, as well as one’s race and parents’ income. In particular, many children of parents who begin on the bottom rung of the income ladder are themselves on the bottom rung later in life, including a disproportionate number of African Americans and those without a college degree.
COLLATERAL COSTS: Incarceration’s Effect on Economic Mobility
26
“QUITE FRANKLY, WE’RE IN A VERY TOUGH ECONOMY. THAT IS SPURRING PEOPLE TO LOOK AT DIFFERENT SOLUTIONS, ESPECIALLY ONES THAT COST LESS THAN INCARCERATION.”
Gil Kerlikowske
Director of The Office of National Drug Control Policy
Drawn disproportionately from the poorly educated and the marginally employed, the millions of people in American jails and prisons faced poor mobility prospects before they entered the prison walls. But by the time they leave, this research finds, they face even smaller chances of finding and keeping jobs and moving up the income ladder. The detrimental impact of incarceration on mobility merits particular attention because of the explosive growth of jails and prisons over the past three decades. With so many people and families affected, and with such concentration of the impacts among young, poorly educated men from disadvantaged neighborhoods, discussions of
mobility in America must include reference to crime policy and the criminal justice system.
Further, the findings presented here foreshadow a disconcerting trend for the economic mobility prospects of the 2.7 million children who currently have an incarcerated parent. If previous mobility patterns of “stickiness” at the bottom of the income ladder continue, children of
incarcerated parents, who are more likely to begin on the bottom rung of the ladder and more likely to struggle in school and experience turmoil in their families, will find themselves in a similar economic position as adults.
These findings make it clear that beyond the already substantial brick and mortar costs of incarcerating such a significant portion of the population, there are additional costs to former inmates, their families and their communities. Those who have been incarcerated emerge from prisons and jails and work fewer weeks per year, receive lower wages and take home smaller earnings. These costs now account for a substantial share of the economic hardship faced, in particular, by young, undereducated racial and ethnic minorities. Even as prison populations stabilize, the United States still will be forced to address the legacy of the current prison population and the millions who have previously served terms of incarceration.
The good news is that years of research and analysis point the way toward solutions that reduce crime, contain spending and enhance the economic prospects of offenders and their families. To support upward mobility, states can invest in programs that reconnect former inmates with the labor market and remove obstacles to reintegration. To stop the revolving door of incarceration, states can invest in research-based policies and programs in the community that keep former inmates on the straight and narrow, improve public safety and cost far less than incarceration. In so doing, policy makers can ensure a more level playing field and greater prosperity for millions of Americans, their families, and society at large.