Procedia Engineering 121 ( 2015 ) 1382 – 1388
1877-7058 Crown Copyright © 2015 Published by Elsevier Ltd. This is an open access article under the CC BY-NC-ND license (http://creativecommons.org/licenses/by-nc-nd/4.0/).
Peer-review under responsibility of the organizing committee of ISHVAC-COBEE 2015 doi: 10.1016/j.proeng.2015.09.028
ScienceDirect
9th International Symposium on Heating, Ventilation and Air Conditioning (ISHVAC) and the 3rd
International Conference on Building Energy and Environment (COBEE)
Simulation and Analysis of a University Library Energy
Consumption based on EQUEST
Jiafang Song
a,*, Xuelin Zhang
a, Xiangquan Meng
aaTianjin Polytechnic University,399 Binshuixi Road, Xiqing District, Tianjin,300387, China
Abstract
The energy situation in China remains troubled, with building energy consumption continuing to dominate a large proportion of the total amount. In such case, it is important to analyze the data and issue recommendations on energy uses in public buildings of university towns. By selecting appropriate simulation software, namely eQUEST, information of actual buildings, including public utility rates and meteorological parameters, can be simplified. Some control variables was chosen to be simulated by eQUEST, such as lighting power density, indoor personnel density, summer indoor design temperature and summer air supply temperature. We summarize the impact on the power consumption of buildings based on the different variables. The respective effect of every aspect on the total power consumption is studied through the method of control variables.
© 2015 The Authors. Published by Elsevier Ltd.
Peer-review under responsibility of the organizing committee of ISHVACCOBEE 2015.
Keywords: University library; Energy consumption simulation; eQUEST; Control variables
1.Introduction
China's current building energy situation is not optimistic. Total building energy consumption accounted for the total social energy consumption is gradually stepping up. By the end of 2014, the building energy consumption in China accounted for about 1/3 of total social energy consumption. Compared to developed countries with similar climatic conditions, heating and air conditioning energy consumption per square meter in China’s buildings in is approximate 3 times that of developed countries.
* Corresponding author. Tel.: +86-022-83955393; fax: +86-022-83955258.
E-mail address:[email protected]
Crown Copyright© 2015 Published by Elsevier Ltd. This is an open access article under the CC BY-NC-ND license (http://creativecommons.org/licenses/by-nc-nd/4.0/).
In recent years, many researches on building energy consumption simulation are concentrated on the office buildings, residential buildings, large space buildings and hospitals etc. [1-3]. Few researchers involved in the energy consumption simulation of University Library. University library belongs to large public building in which the energy consumption is very huge. So it is worthy of doing research in this area.
Due to the lack of related simulation data analysis to the public building namely library energy consumption, we established the energy consumption simulation of a university library located in North China, and analyzed the different variables how to affect the building energy consumption in this paper.
2.Methods
Recently, a large number of research articles related to building energy consumption simulation were published by many professionals and scholars based on eQUEST software. For example, Chris Leung [4] carried on a research of building energy saving through improving indoor thermal comfort and reducing indoor temperature during sleeping. Many reliable conclusions on improving building energy efficiency were drawn by using eQUEST. Therefore, we also applied the feasible software eQUEST to acquire simulation data in this study.
We selected Tianjin Polytechnic University library as the simulated building. After a reasonable simplification, the building model was created in eQUEST based on field investigation and final construction drawings.
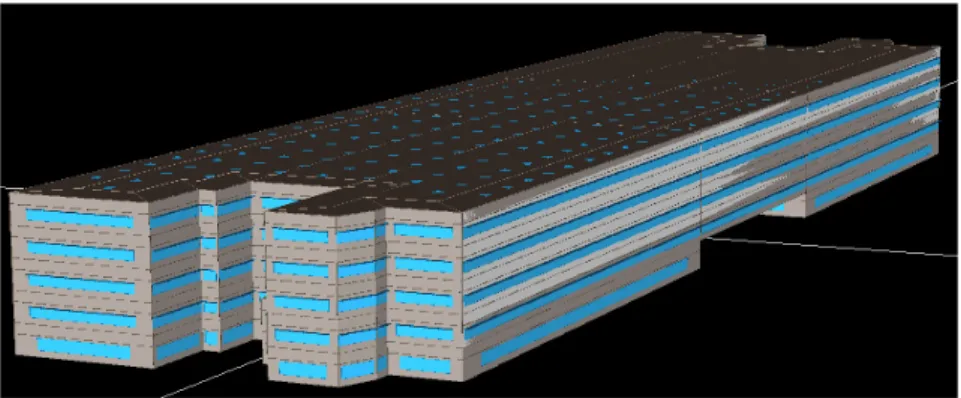
The model of university library includes five stories without basement. Its’ storey height is 4.5 meters, and the building is 23.95 meters high totally. The total construction area of the library is 53186.55 square meters. Building structure is cast-in-situ reinforced concrete frame structure. The building shape is rectangular. The whole building is about 224 meters long, and about 58 meters wide. It mainly divided into office area, read area, copy room, multi-media room, computer room, library and other functional areas. Office area, read area and collection area are the main functional areas. Central air conditioning system is adopted for fan coil units plus fresh air system. Cooling and heat sources are provided by the ground source heat pump system. The building model created by eQUEST is shown in Fig. 1.
Fig. 1. The 3D drawing of building model.
Due to the operating characteristics of the school building, the whole year of building simulation is divided into three running time. The first stage is February for winter vacation. The second stage is the normal operation stage (January, March to June, and September to December), and the last stage is the summer vacation (July and August).
In order to run simulation smoothly, many parameters related to this building were input in eQUEST. The parameters set in the base case were acquired in field measurement. Computer room equipment load and office equipment load are set to 27 W/SqFt (291.6 W/m2) and 1.5 W/SqFt (16.2 W/m2) respectively. Lighting loads in reading area, office and book stacks areas are all set to 0.6 W/SqFt (6.5 W/m2). Lighting load in the lobby is set to 1.77 W/SqFt(19 W/m2). Lighting load in the corridor is set to 0.57 W/SqFt(6.2 W/m2). Indoor design temperature in summer and in winter is set to 24 ć and 22 ć respectively. The supply air temperature in summer and in winter is set to 13 ć and 35 ć separately.
In this study, we use the control variables method which often allows the clear identification of cause and effect because only one factor is different at a time, the effect of that single factor can be determined. Some control variables was chosen to be simulated by eQUEST, such as lighting power density, indoor personnel density, summer indoor design temperature and summer air supply temperature. There are five cases in one control variable simulation. The set value in each case is shown in Table 1.
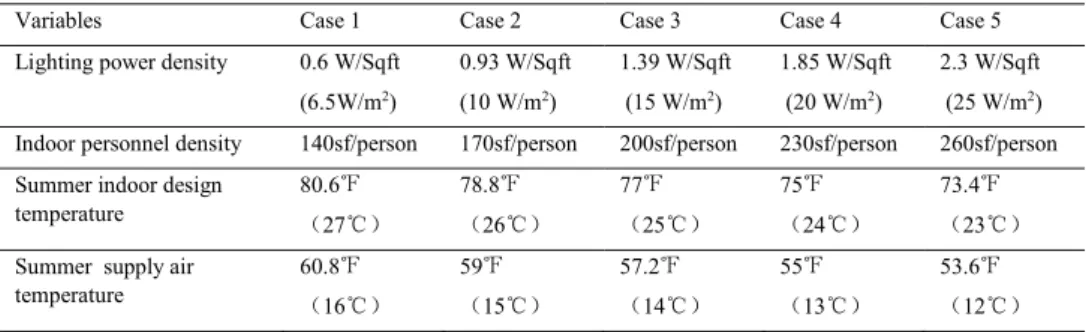
Table 1. The set value in different cases
Variables Case 1 Case 2 Case 3 Case 4 Case 5
Lighting power density 0.6 W/Sqft (6.5W/m2) 0.93 W/Sqft (10 W/m2) 1.39 W/Sqft (15 W/m2) 1.85 W/Sqft (20 W/m2) 2.3 W/Sqft (25 W/m2)
Indoor personnel density 140sf/person 170sf/person 200sf/person 230sf/person 260sf/person Summer indoor design
temperature 80.6̧ ˄27ć˅ 78.8̧ ˄26ć˅ 77̧ ˄25ć˅ 75̧ ˄24ć˅ 73.4̧ ˄23ć˅
Summer supply air temperature 60.8̧ ˄16ć˅ 59̧ ˄15ć˅ 57.2̧ ˄14ć˅ 55̧ ˄13ć˅ 53.6̧ ˄12ć˅ 3.Results
Base on the setting parameters in base case, the simulation results are shown in Fig. 2. It shows that the largest power consumption is up to 872000KWh in June. However, the minimum power consumption is only 327300KWh in February which is only 37.5 percentage of power consumption in June.
Fig 2. The annual energy consumption of each month
During winter vacation, the building was not open to the public, so the energy consumption in February is a minimum. In June, the building load increases with outdoor temperature, so air conditioning power consumption reaches the maximum. Calculated by the whole building area of 56310 square meters, the annual energy consumption of per unit area 133 KWh/(m2a). Based the above results, it can be concluded that the annual energy consumption is consistency with the actual operation of the library.
Computer rooms, reading area and offices in university library account for the total construction area of more than 70%, while the lighting requirements of these three functional areas are similar. Therefore, we change the lighting power density in these three functional areas instead of corridors and book stairs areas. The simulation results for the five cases are shown in Fig. 3. From Fig. 3, it can be obtained that with the increasement of lighting power density, annual energy consumption also increases apparently.
Based on the different indoor personnel density, the simulation results of monthly electric consumption is presented in Fig. 4. In summer, with the increase in personnel, air conditioning load increased which resulted in an increase of the energy consumption, while in winter; the result is just the opposite.
Fig. 4. The monthly energy consumption for different indoor personnel density.
Summer indoor design temperature will directly affect the energy consumption of air conditioning system and building energy consumption. Fig. 5 shows the simulation results of annual energy consumption for different summer indoor design temperature. From the data in Fig. 5, when the summer indoor design temperature increases, the annual energy consumption in buildings reduces.
4. Discussion
The energy consumption of lighting equipment accounted for a large proportion in building energy consumption. Lighting power density will directly affect the energy consumption of air conditioning system and building energy consumption. Based on the simulation data, we can find the relationship between the annual power consumption and lighting power density in Fig. 6. It can be seen that the trend line and the actual simulation data curve is similar. It is concluded that the lighting power density and annual power consumption exist in a linear relationship. It can infer that the annual consumption growth is about 10% when the lighting power density increases every 5W/ m2.
Fig. 6. The relationship between the annual power consumption and lighting power density.
Fig. 7. The relationship between the annual power consumption and Indoor personnel density.
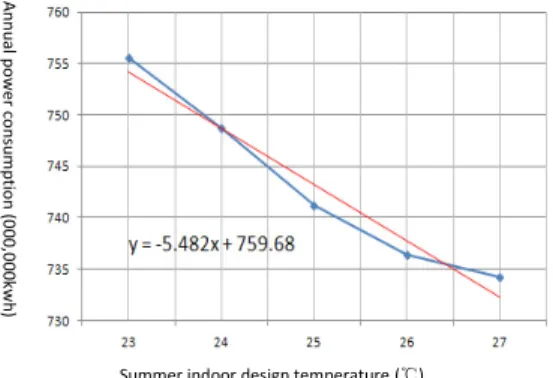
Fig. 8. The relationship between the annual power consumption and summer indoor design temperature.
Lighting power density (W/m2)
Ann u al po w er c o ns um pt io n (0 00, 0 00k w h ) Ann u al po w er c o ns um pt io n (0 00, 0 00k w h )
Lighting power density (sf/person)
Ann u al po w er c o ns um pt io n (0 00, 0 00k w h )
The number of indoor persons can affect heating and cooling load. Based on the simulation results, it can be found that there is a linear regression relationship between annual power consumption and indoor personnel density. As shown in Fig. 7, it is obvious that with the increase of indoor personnel density, building annual energy consumption rises up.
Summer indoor design temperature can affect the building cooling load. Higher the summer indoor design temperature is, less the building cooling loads. Fig. 8 shows how summer indoor design temperature affects the annual energy consumption. It can be seen that the annual energy consumption of the building decreases along with the summer indoor design temperature increase.
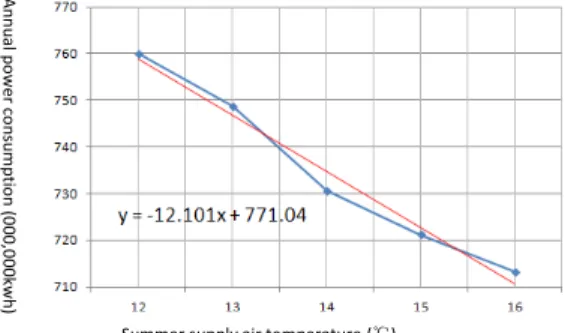
Fig. 9. The relationship between the annual power consumption and summer supply temperature.
Summer supply air temperature will directly affect the energy consumption of air conditioning system and building energy consumption. With the decrease of summer supply air temperature, electricity consumption of water pump and refrigeration rise up to some extent. Fig. 9 shows the relationship between the annual power consumption and summer supply temperature. It can be seen that there is a linear inverse relationship between the annual energy consumption and summer air temperature. It infers that higher summer supply air temperature can not only reduce cold discomfort, but also can help energy saving.
5.Conclusions
University library belongs to a kind of large public buildings, which is also the high energy consumption building. Among the building energy consumption, air conditioning system energy consumption accounts for the largest one which is 49% of the total energy consumption. Meanwhile, lighting and power consumption are 15% and 35% respectively.
We utilized control variables method to analyze the influence of four factors which are lighting power density, indoor personnel density, summer indoor design temperature and summer air supply temperature on building energy consumption. Lighting power density has a direct impact on the building energy consumption, and the influence is bigger. Summer supply air temperature on the degree of influence of building electricity consumption is greater than the summer indoor design temperature. Indoor personnel density mainly affects the load of air conditioning system in summer, and then influence the overall power consumption. According to the relevant provisions of green lighting, lighting power density for school reading room and classrooms is 9 W/ m2, and it shall not exceed 11W/ m2. Lighting equipment design for this kind of building should not exceed the specified value. According to the simulation results, we recommend that 0.93W/Sqft (10W/m2) is more reasonable. Summer air supply temperature has influence on the power consumption. Higher each degree of summer air supply temperature, less 2.7% of the power consumption. In the premise of meeting the design requirements of the indoor air temperature, it can be appropriate to improve supply air temperature used by the automatic control system. It can enhance the operating efficiency of air conditioning systems and reduce the high load operation of energy.
Building energy research and design of building energy saving and reconstruction is a long and hard process. It needs continued more delicate and more in-depth research. This paper just aims at the effects of four single variables on power consumption investigated, due to the limitation of time and ability, so more complicated work will be
Ann u al po w er c o ns um pt io n (0 00, 0 00k w h )
conducted in future. It is recommended to do multiple variables simulation and explores the influence of match among the variables on building electricity consumption.
References
[1] D.B. Crawley, J.W. Hand, M. Kummert, B.T. Griffith, Contrasting the capabilities of building energy performance simulation programs, Building and Environment 43 (2008) 661–673.
[2] H. Ge, V.R. Mcclung, S.S Zhang, Impact of balcony thermal bridges on the overall thermal performance of multi-unit residential buildings: A case study, Energy and Buildings 60 (2013)163–173.
[3] S. Heiple, D.J. Sailor, Using building energy simulation and geospatial modeling techniques to determine high resolution building sector energy consumption profiles, Energy and Buildings 40 (2008) 1426–1436.
[4] C. Leung, H. Ge, Sleep thermal comfort and the energy saving potential due to reduced indoor operative temperature during sleep, Building and Environment 59 (2013) 91-98.