of 3D Terrain and Land Use Models
Dr. Michael Beck, Dr. Thomas Blaser & Rüdiger Mach
1 Abstract
A new way to handle complex Geo Data with additional content is the use of Virtual Globes. Virtual Globes may be described as specialized toolboxes for preparing all kinds of data for highly interactive geo referenced use combined with extra 3D information. This article is about Virtual Globes - what they are, where they come from, where their advantage may be found, who is on the market and where we are heading for.
2 Introduction
This article is a review of the current state of Virtual Globe solutions, their markets and respective applications. As so many different facts, descriptions and new ideas form a part of the discussion, it is important to talk about features, content and meaning of Virtual Globes. So let´s focus on some basics about this fascinating field of Virtual Globe Solutions.
To call a system “Virtual Globe” it has to be able to handle a lot of different files, content and technologies.
Getting in touch with all the descriptions and definitions of geographical data (Geo Data) and information one may become confused due to the linkage and interconnection of the various disciplines and players in these markets: GIS, 3D Computer Graphics, Remote Sensing, 3D Visualization and more.
2.1 Some
Definitions
A Virtual Globe can be described as a system representing Geo Information and Content with regards to one reference (e.g. WGS 841), including imagery, digital maps, elevation and 3D models, vector data, weather data, and data from Real-Time GPS or surveillance systems (satellites, planes, helicopters, UAV2s, cameras). Virtual Globe applications provide functionality for accurate representation of the Earth up to a very detailed level, for 3D visualization and navigation.
1
http://www.wgs84.com/
Introduction
2
Virtual Globes can represent and combine geo referenced data from different sources and systems:
Remote Sensing is in the broadest sense the measurement or acquisition of information of an object or phenomenon by a recording device that is not in physical or intimate contact with the object. In practice, remote sensing is the utilization at a distance (as from aircraft, spacecraft, satellite, or ship) of any device for gathering information about the environment.
A geographic information system (GIS) is a system for creating, storing, retrieving, analyzing, displaying and sharing geographically-referenced spatial data and associated attributes.
Cartographic modelling refers to a process where several thematic layers of the same area are produced, processed, and analyzed. Dana Tomlin (1990) used raster layers but the overlay method can be used more generally. Operations on map layers can be combined into algorithms, and eventually into simulation or optimization models.
Digital cartography can be considered a (semi) automated process of producing maps from a GIS system. The representation of GIS output through a digital map is considered equivalent to the stage of visualization.
The main factors in the creation of an interactive Virtual Globe solution can be described as follows:
1. 3D Globe Geo Content – A Virtual Globe solution has to be able to represent the most important types of geo information such as elevation information, imagery, vector delineations and surfaces and annotations. 2. 3D Models - Additional 3D models are important in order to create a convincing Virtual Globe solution (entire cities and textured buildings, landmarks, plants and production facilities, power lines, road, railway and pipeline networks, street culture, vegetation, dynamic 3D objects such as planes, cars, people).
3. Navigational Information – For navigation, Points of Interest, Flight paths and so called Hot Spots are important. They make it easier for the users to retrieve local information and to find their way.
4. Navigation – The navigation has to be simple, easy and instinctive. If it is a Flythrough or a Walkthrough or just a “Find Target”, the user has to get familiar with the system in a very short time. Using the mouse or a joystick to navigate in an intuitive way is one of the most effective ways of getting the solution accepted.
5. Web Based Application - Internet revolutionized the way we communicate with each other and share knowledge and information.
Therefore the hosting and streaming of 3D Geo Data, Terrain Models and additional information inside a web based environment is a basic requirement.
6. Webcams, Intelligence and Remote Control - Spatial representation of moving or stable objects in 3D on the ground or in the air through the help of intelligence and reconnaissance technology (satellite-, UAV-, Webcam data streams, GPS) is a very important necessity. While the Network Centric Intelligence Technology has its origins in defence and domestic security, civil applications can include endangered species, wild animals surveillance, or live event broadcasting.
7. Presentation and communication - Presentation and communication of complex data for the public is an important detail. Any type of Globe-related enterprise or project to plan and implement (e.g. engineering, urban land use planning, architecture, network infrastructure, navigation, security, defence, United Nations missions) needs adequate presentation and communication platforms to various audiences.
8. Large Screen Presentation - In professional use, larger screen dimensions are needed for command and control (launch of the space shuttle, air control, and more) as well as in the fields of virtual reality, flight simulation and entertainment, where channel and multi-projection screens allow immersive visualizations and experience with virtual 3D landscapes.
3
The way to Virtual Globes - the last years
The Geo software industry has realized the importance of Virtual Globes.
ESRI3 launched ArcGlobe in mid-2003 and Google its Google Earth in 2005. Leica Geosystems4 from Hexagon commercializes ERDAS Imagine and Virtual Explorer software. Intergraph5 has a product called Image Viewer for MicroStation. Autodesk6 has acquired sophisticated software for high quality 3D modelling, visualizations and animations, such as Autodesk Civil3D, 3ds Max or Maya.
The Swiss Company ViewTec has been developing software products since the late 90´s which are branded under TerrainViewTM. Today they define the major applications within industrial use of interactive visualization and Globe Solutions. 3 http://www.esri.com 4 http://www.leica-geosystems.com/ 5 http://www.intergraph.com/ 6 http://autodesk.com
The way to Virtual Globes - the last years
4
Upstream core technologies required for the realization of applications with Virtual Globes are
• Remote Sensing and imagery acquisition (satellite, aerial, terrestrial) • Image processing, ortho-rectification and projection
• Geographical & other spatial information processing • Global positioning systems (satellites, receivers, emitters)
• 3D Modelling Tools to create additional information and include designs and constructions
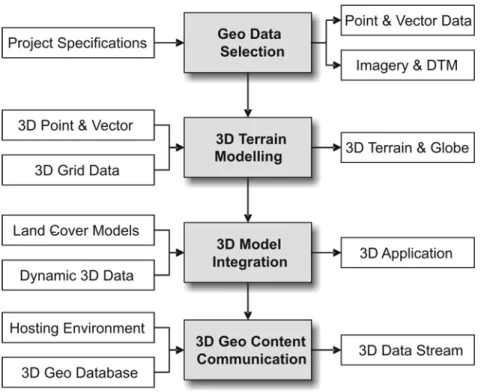
The following figure describes the workflow needed in generating Virtual Globes and models in 3D:
Fig. 1 Workflow needed for generating Virtual Globes and 3D models
3.1 GIS vs. Virtual Globes?
As mentioned above, the origins and uses of GIS and Virtual Globes differ from each other. The main difference is that GIS is used for queries and analysis, while Virtual Globes are used mainly for visualization, localization and navigation.
3.1.1 GIS – Visualizing Abstract Information
A GIS can be represented in a Cartesian coordinate system through l=m+n layers. “m” represents the number of geo referenced and superposed thematic maps and “n” the number of times, a natural phenomenon (e.g. retrogression of a glacier) can be observed over time.
3.1.2 Virtual Globe – A Visualization for the User
Observers use cognition and context for 3D scenes interpretation and description. Although less mathematical than GIS, the 3D visualization of detailed terrain data will bring into evidence e.g. lineaments, fractures and other terrain features. For visualization, imagery from different spectral wavelengths (visible, infrared, thermal infrared, radar spectra) and resolutions can be used. Typically, the sensor resolution should be less than half the size of the smallest feature that must be resolved (Jensen, 1996).
4
Applications & Features
4.1 Applications
Some applications are trying to conquer the market. The most well-known are: • Viewtec TerrainView-Globe
• Google Earth
• Microsoft MSN Virtual Earth • NASA and World Wind • WW2D
4.1.1 Viewtec TerrainView-Globe
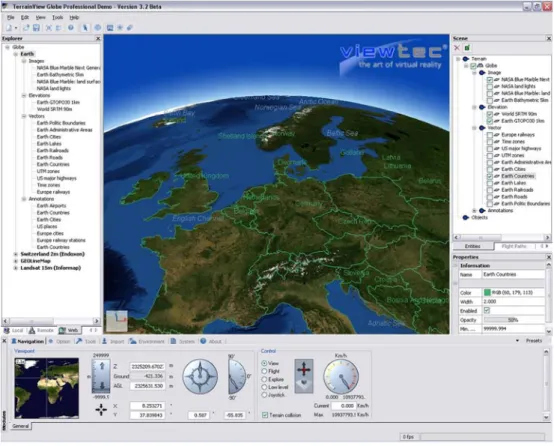
TerrainView-GlobeTM enables the user to interact with 3D visualizations in spherical rendered scenes.
Applications & Features
6
Fig. 2 Rendering of Earth’s Globe from NASA with ViewTec’s TerrainView-GlobeTM software.
TerrainView-GlobeTM functionality includes
• definition of camera and flight paths allowing 3D terrain and models to be recorded and viewed as animations and videos,
• integration of 3D terrain models and textured high-definition 3D objects (i.e. Plug-In for 3ds Max).
• continuous level of detail while zooming with any number of overlapping, high-resolution image or terrain data inserts,
• terrain morphing between different resolution levels, • ultra-fast Level-Of-Detail calculation,
• demand paging of tiled data for the four basic data types: imagery, terrain, vector, annotation.
4.1.2 Google Earth
Google Earth7 might be called the Virtual Globe solution for the masses. Google Earth’s vision is that "open source" projects, people build, will make data content grow over the entire Globe.
4.1.3 Microsoft MSN Virtual Earth
Microsoft’s MSN Virtual Earth8 is the server part of Windows Live Local, a free online local search and mapping service. Functions allow the exploration of a specific location with advanced driving directions and local listings.
4.1.4 NASA and World Wind
World Wind9, is NASA's Learning Technologies project, an open source 3D interactive world viewer to maximize awareness and impact of NASA research.
4.1.5 WW2D
WW2D10 is a free cross-platform, Open Source Java and OpenGL based application (Vitaliy Pronkin). WW2DplusOne provides 3D viewing.
7 http://earth.google.com/ 8 http://local.live.com/ 9 http://worldwind.arc.nasa.gov/ 10 http://ww2d.csoft.net/
Applications & Features
8
4.2 Virtual Globe Features
The following table summarizes the features provided by each Virtual Globe
Features ViewTec TerrainView-GlobeTM Google Earth MSN Virtual Globe NASA World Wind WW2D Multiple image datasets X X X X Map, vector and
annotation overlay
X X X Transparent overlay of
multiple datasets
X Satellite and aerial
image overlay X X X X X Real time 3D weather overlay X GPS generated data integration X X X Textured 3D models (terrain, objects) X X Dynamic rendering of 3D elevation LOD X Day & night, seasonal
views and lighting
X X Web community applications X X X X Collaborative computing X X
ViewTec’s TerrainView-GlobeTM is for the professional markets and applications and thus clearly differs from applications such as Google Earth or Nasa World Wind which are more focused on public use/control and scientific research respectively.
TerrainView-Globe™ enables rendering and display of global and local scale imagery, elevation, and vector-based datasets for all common projections, raster and vector formats.
Local data can be used with internet based data services from ViewTec or other data provider. All datasets are independent with the ability to attach or detach. It can render an arbitrary number of datasets each with an arbitrary, potentially very large, amount of data and supports industry standard texture compression formats. A lossless compression of datasets further reduces disk and bandwidth requirements.
5
Geo Data Requirements
Due to the fact, that there is a wide range of Geo Data service in the World Wide Web, applications that require 3D geographical data (3D Geo Data and –content) will have to define:
• Geographic area
• Type of imagery and spectral bands
• Type of elevation data (e.g. digital terrain model, digital elevation model) • Thematic information
• Spatial resolution
• Data accuracy (e.g. Root Mean Squared Error RMSE) • Vector information & annotations
• Acquisition date
• Maximum cloud cover tolerated • Data producing software
While land cover imagery might be required more frequently the same DTM can be used for a longer period of time.
5.1 Data
Provider
Geo Data is available and distributed over the entire world. For Real Time or near Real Time data applications (security, defence, UN missions), data services are required around the clock. As an alternative, a data user might consider purchasing a satellite image reception station. The entire processing chain from raw data reception to spherical 3D data rendering in the Virtual Globe needs to be considered.
5.2 Remote Sensing and Measurement
From a physical point of view, remote sensing is equivalent to the measurement of the reflected and emitted energy from the Earth’s surface. To have comparable data over the entire Globe, radiometric calibrated and geometrically corrected and projected (WGS84) data is required.
With Globe Systems like ViewTec’s TerrainView-GlobeTM various data sets (imagery, maps, textured models) at different resolutions can be combined. Each individual picture element (pixel) of each data set is precisely georeferenced and -located.
5.3 Global
Coverage
Companies like ViewTec and Google provide Global coverage with Landsat 7 Enhanced Thematic Mapper satellite imagery (Dykstra 2006). Whether higher
Geo Data Requirements
10
resolution Virtual Globes are required can be debated. Imagery is expensive and in many cases up-to-date information on a specific region is sufficient.
5.4 Various Disciplines and Data Needs
Information and 3D visualization needs vary for each user and application. For example the placing of a pipeline will require a multidisciplinary effort, including specialists from various disciplines (law, geology, geophysics, soil science, ecology, hydrology, politics, economics etc.). It is therefore crucial to understand the different needs with regards to the Virtual Globe contents and resolution, 3D visualization and navigation.
The following table tries to summarize industry (in alphabetical order) in combination with remote sensing data and DTM requirements.
MARKETS IMAGERY DTM 3D MODELS
Industry Application 3D Globe 15m Resolution/ OrthoImages & -Data Image Actuality Accuracy Planimetric/A ltimetric DTM Actuality Terrain, Buildings & Objects Archaeology Archaeological landscape research Global inventory Centimetre/ LIDAR, real elevation 3d maps, architectural ruins maps New Centimetre/ centimetre Up-to-date 3D terrain, archaeological 3D information
Architecture Project design & communication, exterior/interior visualization Global reference Centimetre/ aerial images, city-map
New Centimetre/ centimetre Up-to-date 3D terrain, architecture project data, urban model Civil Aviation Industry Flight simulation & training Inter-national flight training Centimetre resolution around airports/ satellite & aerial
imagery New around airports Centimetre/ centimetre Months 3D Globe, airport and buildings Defence, Intelligence, Reconnais-sance Situational awareness, training and simulation, GPS referencing Regional planning & impact simulation Centimetre/aerial images, topographic maps Real-time Centimetre/ centimetre
Up-to-date 3D terrain & 3D land cover Domestic security Incident simulation, emergency planning Regional planning & impact simulation Centimetres/aerial, topographic maps Real-time Centimetre/ centimetre
Up-to-date 3D terrain & 3D land cover
Engineering Project planning, design and realization Global project reference Centimetre/ aerial ortho-images; topographic maps New Centimetre/ centimetre
Up-to-date Project data
Facility Management Production plant and infrastructure management Worldwide facilities Centimetre/ aerial ortho-images New Centimetre/ centimetre Up-to-date 3D terrain, plant & infrastructure Geology Resource exploration & 3D mapping Global mapping Decimeter/ high resolution satellite
or aerial images; geology map Years Decimetre/ decimetre Months 3D terrain Location based services & navigation Mobile localization applications Global positionin g data
Metre/ aerial imagery, city maps, local
content New Metre/ metre Up-to-date 3D terrain, 3D land cover, 3D models Military Aviation Industry Flight simulation & training Globe for foreign mission training Centimetre/ aerial imagery New to real-time Centimetre/ centimetre Up-to-date 3D terrain, 3D land cover, 3D objects
MARKETS IMAGERY DTM 3D MODELS Industry Application 3D Globe
15m Resolution/ OrthoImages & -Data Image Actuality Accuracy Planimetric/A ltimetric DTM Actuality Terrain, Buildings & Objects Enter-tainment
and animation Satellite or aerial Scenery dependent
metre land cover, 3D effects Network Infra-structure Railroads, Highways, Power Supply Lines Globe for general planning Metre, centimetre/high-resolution satellite-,
aerial & LIDAR imagery along axes
New Centimetre/ centimetre
Up-to-date 3D terrain, 3D land cover
and land use
NGO Natural disaster management and human relief Globe for mission planning Metre/high-resolution satellite- & aerial imagery in affected areas Before and after data Metre/ metre
Up-to-date 3D terrain &3D land cover
Oil and Gas Industry Infrastructure planning & protection Globe for reference
Metre & centimetre / LIDAR linear imagery
New Centimetre/ centimetre
Up-to-date 3D terrain, 3D land cover and
land use Re-/ Insurance GeoRisk research & geographical underwriting Global reference Centimetre/aerial images, city-map Before and after data Centimetre/ centimetre Up-to-date 3D terrain, 3D city models
Real Estate Site selection and property marketing Globe for reference Centimetre/ aerial imagery (e.g. LIDAR, HRSC) New Centimetre/ centimetre Up-to-date 3D terrain, 3D buildings Telecom-munications Mobile network planning and management Globe for reference Centimetre/ aerial imagery, city-map New Centimetre/ce ntimetre Up-to-date 3D terrain, 3D land cover Television/ Multimedia
News and events broadcasting Globe for worldwide broad-casting Centimetre to metre/Satellite or aerial high-resolution imagery Months & New Metre/ metre Years 3D terrain Travel & Tourism Marketing through 3D content & multimedia Globe for geographic reference Metre to centimetre (e.g. tourist trails)/
aerial imagery, topographic map New Metre to centimetre/ metre to centimetre Months 3D terrain, 3D vector maps (trails), landmarks Urban Planning Economic development and land use planning Globe for reference Centimetre/ Aerial, city-map New Centimetre/ centimetre Up-to-date 3D terrain, 3D city model, 3D landcover (e.g. trees), 3D landmarks
6
Where are we heading in 3D Visualization?
6.1 Actual
State
There is a clear distinction between professional and public use of Virtual Globes. Professional software like TerrainView-GlobeTM provides customers the possibility to purchase software and data licenses, to benefit from services, and to manage and control their applications. The use of a Virtual Globe solution for the masses will create dependencies. There are no guarantees with regards to the sustainability of free Globe software, content and no quality assurance neither.
Conclusion
12
6.2 Potential of 3D Visualization
The potential and adoption of Virtual Globes and 3D visualization technology in the Architecture, Engineering and Construction (AEC) industry might interest companies like Autodesk. Eastman et al. (2002) refer to the fragmentation inside the AEC industry as a major inhibitor of 3D technology adoption. The construction industry has traditionally been craftsman-oriented, with many small participants. Informing planners, architects, authorities, investors and the public in effective ways about a project means significant savings of time and money (Albrecht 2004). Prawel (2006) emphasizes the value of 3D software for innovation. From nuclear medicine to architecture, manufacturing to computer games, petrochemicals to weather prediction, 3D software technology is changing the way of communication. 3D visualization is communication support for our society and young generations are primarily visualization oriented.
6.3 What will be the future of Virtual Globes?
Planning, simulation and monitoring in a computer generated realistic 3D world will increase the demand for Virtual Globe applications.
Initiatives like Internet2, with a high-performance backbone network that operates at up to 100 Gbits per second11, will dramatically increase usage and exchange of massive amount of data for 3D visualization.
Collaborative virtual environments (CVE) the underlying concept used in TerrainView-GlobeTM will connect people and projects across the entire world. Broadband access of wireless handheld devices to local real-time information, presented and geo-referenced in 3D will become a true value add (Grant 2006).
7 Conclusion
Applications in the past, using 3D modelling, visualization and animation were based on expensive technology.
Today, Virtual Globe applications run on Personal Computers. 3D technology has become accessible to everyone.
While Google leverages its brand together with billions of USD investments to generate awareness and reach the Internet Community with Google Earth, ViewTec focuses on quality, value and the push of its TerrainView-GlobeTM technology to develop new professional markets.
As long as competition remains quasi-perfect Virtual Globe players like ViewTec can continue to benefit from Google Earth’s momentum to drive innovation and to be successful in this market.
11 UCAID http://www.internet2.edu
8 Reference
Albrecht N., (2004), Seeing is Believing: A Better Way to Sell Traditional Neighborhood Development, Indianapolis, Indiana
http://www.schneidercorp.com/documents/Seeing_is_Believing.pdf Dykstra J., (2006), EarthSat NaturalVueTM A Global Landsat Image Dataset
produced by MDA Federal Inc., White Paper, Maryland, USA, 5 p.
Eastman C., et al. (2002), Strategies for Realizing the Benefits of 3D Integrated Modeling of Buildings for the AEC Industry, International Symposium on Automation and Robotics in Construction, 19th (ISARC). Proceedings. National Institute of Standards and Technology, Gaithersburg, Maryland. September 23-25, 2002, 9-14 pp. http://www.fire.nist.gov/bfrlpubs/build02/PDF/b02082.pdf Grant C, (2006), Library Systems in the Age of the Web, 27p.
http://www.nelinet.net/edserv/conf/cataloging/google/grant.ppt#1
Jensen, J. R. (1996), Introductory Digital Image Processing: A Remote Sensing Perspective, 2nd edition ed., 316 pp., Prentice Hall, New Jersey.
Mach, R., Petschek, P. (2006) Visualization of Digital Terrain and Landscape Data, Springer Berlin, New York.
Prawel, D. (2006), 3D & PLM: A Foundation for World-Class Innovation, 2006 COE Annual Conference Preview,
http://www.coe.org/newsnet/Jan06/preview.cfm
Tomlin, C.D., (1990), Geographic Information Systems and Cartographic Modelling, Prentice-Hall.
The authors’ company, ViewTec in Zurich Switzerland, develops software which represents “State-Of-The-Art” in the 3D modelling and visualization industry. ViewTec’s software products branded under TerrainViewTM define the major applications within the industry.
Dr. Michael Beck ([email protected]) is Co-Founder, President & CEO, Dr. Thomas Blaser ([email protected]) is Sales & Marketing Manager, Rüdiger Mach ([email protected]) is Senior Consultant & Project Manager at ViewTec Ltd., Zurich, Switzerland.