Simulation for Improvement of
Dynamic Path Planning in
Autonomous Search and Rescue
Robots
by
Michael Douglas Hasler, B.E. Hons
A thesis
submitted to the University of Canterbury in partial fulfilment of the
requirements for the degree of Master of Engineering
in Electrical & Computer Engineering. University of Canterbury
Abstract
To hasten the process of saving lives after disasters in urban areas, autonomous robots are being looked to for providing mapping, hazard identification and ca-sualty location. These robots need to maximise time in the field without having to recharge and without reducing productivity. This project aims to improve au-tonomous robot navigation through allowing comparison of algorithms with vari-ous weightings, in conjunction with the ability to vary physical parameters of the robot and other factors such as error thresholds/limits.
The lack of a priori terrain data in disaster sites, means that robots have to
dynamically create a representation of the terrain from received sensor range-data in order to path plan. To reduce the resources used, the affect of input data on the terrain model is analysed such that some points may be culled. The issues of identifying hazards within these models are considered with respect to the effect on safe navigation.
A modular open-source platform has been created which allows the automated running of experimental trials in conjunction with the implementation and use of other input types, node networks, or algorithms. Varying the terrains, obstacles, initial positions and goals, which a virtual robot is tasked with navigating means that the design, and hence performance, are not tailored to individual situations. Additionally, this demonstrates the variability of scenarios possible. This combi-nation of features allows one to identify the effects of different design decisions, while the use of a game-like graphical interface allows users to readily view and comprehend the scenarios the robot encounters and the paths produced to tra-verse these environments. The initially planned focus of experimentation lay in testing different algorithms and various weightings, however this was expanded to include different implementations and factors of the input collection, terrain
observations to be made.
It was found that the path planning algorithms are of less import than initially believed, with other facets of the robotic system having equally significant roles in producing quality paths through a hazardous environment. For fixed view robots, like the choice used in this simulator, it was found that there were issues of in-compatibility with A* based algorithms, as the algorithm’s expected knowledge of the areas in all directions regardless of present orientation, and hence they did not perform as they are intended. It is suggested that the behaviour of such al-gorithms be modified if they are to be used with fixed view systems, in order to gather sufficient data from the surroundings to operate correctly and find paths in difficult terrains.
A simulation tool such as this, enables the process of design and testing to be completed with greater ease, and if one can restrain the number of parameters varied, then also with more haste. These benefits will make this simulation tool a valuable addition to the field of USAR research.
Acknowledgements
Many thanks to Paul Gaynor for providing academic oversight, with guidance in the writing process and encouraging submissions to conferences, as well as help and suggesting ideas when the stress and low-level details overwhelmed the abil-ity to consider the big picture and simpler solutions.
Thanks also go to Professor Dale Carnegie of Victoria University for his help and guidance. His work with robotics and branching into the field of Urban Search and Rescue, being the starting point for the Honours project which preceded this and led subsequently on to this project, to create a tool to aid his research and the research of others.
Additionally the Author would like to extend thanks to postgraduate colleagues and friends, who were there to listen to or discuss frustrating bugs in the code or the search for mathematical techniques and solutions.
Contents
Glossary xxi
1 Introduction 1
2 Background 5
2.1 Urban Search and Rescue . . . 5
2.2 Robot types . . . 7
2.2.1 Shape shifters . . . 11
2.2.2 Marsupial teams . . . 13
2.2.3 Robot swarms . . . 14
2.2.4 Confined space exploration . . . 15
2.3 Analysis of Robot failures . . . 16
2.4 Competitions . . . 16 2.5 Simulators . . . 21 2.6 Autonomous Navigation . . . 22 2.7 Terrain modelling . . . 23 2.7.1 LIDAR . . . 23 2.7.2 Tessellation . . . 24 2.7.3 Data culling . . . 26
2.7.4 Simultaneous localisation and mapping . . . 28
2.8 Path Planning Algorithms . . . 29
2.8.1 A* Algorithm . . . 31
2.8.2 D* Algorithm . . . 31 v
2.8.3 LPA* Algorithm . . . 32
2.8.4 D* Lite Algorithm . . . 33
2.8.5 Multi-resolution Field D* Algorithm . . . 33
3 Simulator Design 35 3.1 Simulator . . . 37
3.2 Modelling LIDAR input . . . 38
3.3 Terrain Modelling and Data Storage . . . 40
3.4 Tessellation . . . 42
3.4.1 Iterative case-based tessellation . . . 42
3.4.2 Recursive tessellation . . . 49
3.4.3 CGAL based tessellation . . . 51
3.5 Point Culling . . . 52
3.6 Hazard Identification . . . 56
3.7 Creation and linking of Node Points/Networks . . . 58
3.7.1 Centroid based networks . . . 61
3.7.2 Border based network . . . 61
3.7.3 Fixed resolution grids . . . 63
3.7.4 Occupancy grids . . . 63
3.8 Data Objects . . . 64
3.8.1 Coords, Triangles & Edges . . . 64
3.8.2 Points & Face handles . . . 66
3.8.3 Nodes . . . 66
3.9 Path Planning Algorithms . . . 68
3.9.1 Edge Hugger . . . 69
3.9.2 State model . . . 69
3.9.3 Breadth First Search and Depth First Search . . . 70
3.9.4 A* Algorithm . . . 70
3.9.5 LPA* Algorithm . . . 72
3.9.6 D* and D* Lite Algorithms . . . 74
CONTENTS vii
3.11 Path Analysis . . . 78
4 Experimental Design and Pilot Tests of Path Planning 81 4.1 Hardware . . . 81 4.2 Variables . . . 82 4.2.1 Simulator . . . 82 4.2.2 Algorithms . . . 83 4.2.3 Robot . . . 83 4.2.4 World . . . 83 4.3 Procedure . . . 84 4.4 Analysis . . . 84 4.5 Pilot Tests . . . 85 4.5.1 A* algorithm . . . 86 4.5.2 LPA* algorithm . . . 93 4.5.3 Miscellaneous Configurations . . . 93
5 Path Planning Results 95 5.1 Config combos 0, 1 and 2 . . . 96
5.2 Algorithms . . . 96 5.2.1 A* Algorithm . . . 96 5.2.2 LPA* Algorithm . . . 97 5.2.3 State-based Algorithm . . . 98 5.2.4 Comparison of Algorithms . . . 99 5.3 H-value weightings . . . 101 5.3.1 A* Algorithm . . . 101 5.3.2 LPA* Algorithm . . . 105
5.4 A-Series Trial Sets . . . 107
5.5 Trial Sets D, E ,H . . . 113
5.6 Parameter comparisons . . . 120
5.6.1 Trial sets A1 vs. C . . . 120
6 Discussion 125
6.1 Design and Capabilities . . . 125
6.2 Comparison of Parameters . . . 127
6.3 Flaws and Bugs . . . 127
6.4 Insight . . . 128 6.4.1 Config combos . . . 128 6.4.2 Movement/Step size . . . 129 6.4.3 View/input . . . 130 6.4.4 Hazard identification . . . 132 6.4.5 Network . . . 134 6.5 Algorithms . . . 136 7 Conclusion 137 7.1 Future work . . . 138
A Source Code for Simulation System 147 A.1 Algorithms . . . 147
A.2 Algorithms.h . . . 147
A.3 Display . . . 171
A.3.1 Display.h . . . 171
A.3.2 Display.cpp . . . 172
A.4 Hier Triangulation . . . 177
A.4.1 Hier Triangulation.h . . . 177
A.4.2 Hier Triangulation.cpp . . . 181
A.5 Nodes . . . 190 A.5.1 Nodes.h . . . 190 A.5.2 Nodes.cpp . . . 194 A.6 Robot . . . 215 A.6.1 Robot.h . . . 215 A.6.2 Robot.cpp . . . 221 A.7 SimulationEnvironment . . . 233 A.7.1 SimulationEnvironment.h . . . 233
CONTENTS ix
A.7.2 SimEnv.cpp . . . 240
A.8 World . . . 287
A.8.1 World.h . . . 287
A.8.2 World.cpp . . . 342
A.9 adv math . . . 343
A.9.1 adv math.h . . . 343
A.9.2 adv math.cpp . . . 360
B Simulation Results 387 B.1 Statistical Data . . . 387
List of Figures
2.1 The OmniTread, an example of an articulated serpentine robot
design [4]. . . 8
2.2 A variety of tracked robot designs. A - Basic tracked setup. B
- Fixed form climber. C - Flipper arms climber in low profile shape. D - Flipper arms climber in climb configuration. E - Tank
like tracks capable of climbing in either direction of movement. . 9
2.3 A bipedal research robot used to study human motion, viewed
from two angles [5]. . . 10
2.4 A multilegged robot, as commercially available, shown in two
po-sitions [6]. . . 10
2.5 The M-TRAN III, a serpentine shape shifting robot, in a variety
of permutations [9]. . . 12
2.6 An example of an articulated-pair shape shifting robot design.
The Amoeba-II shown in two states [7]. . . 13
2.7 Tree diagram categorising areas of failure of mobile robots [12]. . 16
2.8 The three arenas of the NIST competition [14]. . . 19
2.9 The three arenas of the MeSci competition [14]. . . 20
2.10 Comparison of a terrain model against results from applying data culling techniques [22]. Left: without pre-processing; Centre: with proximity suppression; Right: with coplanar point elimination. 27 2.11 Diagram highlighting the accuracy of measurements within a model
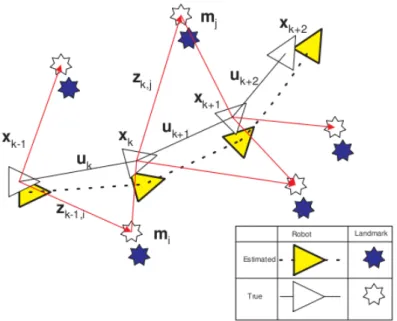
but variance from real world locations. . . 30
2.12 Multi-resolution Field D* produces direct, low-cost paths (in blue/-dark gray) through both high-resolution and low-resolution
ar-eas [36]. . . 34
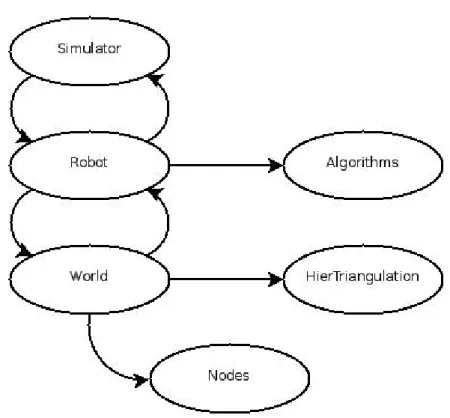
3.1 A UML depiction of the interconnection between objects in the
simulation. . . 36
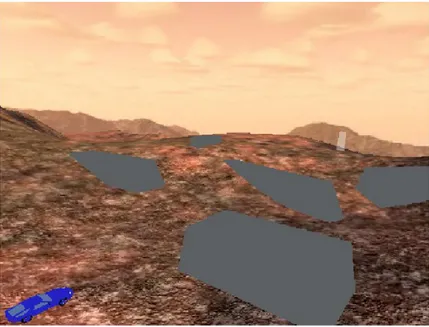
3.2 Simulator screenshot depicting Robot approaching terrain
con-taining obstacles. . . 38
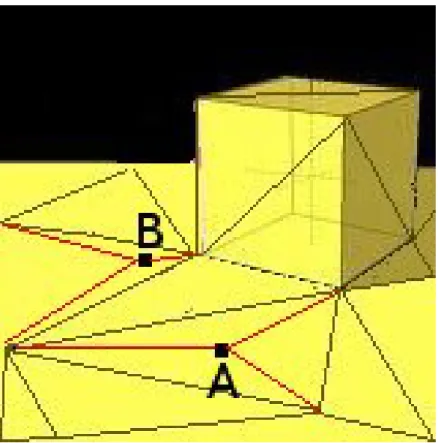
3.3 An example tessellation of a cube placed a flat plane, with good
triangles shown in yellow while an erroneous triangle is coloured
pink. . . 47
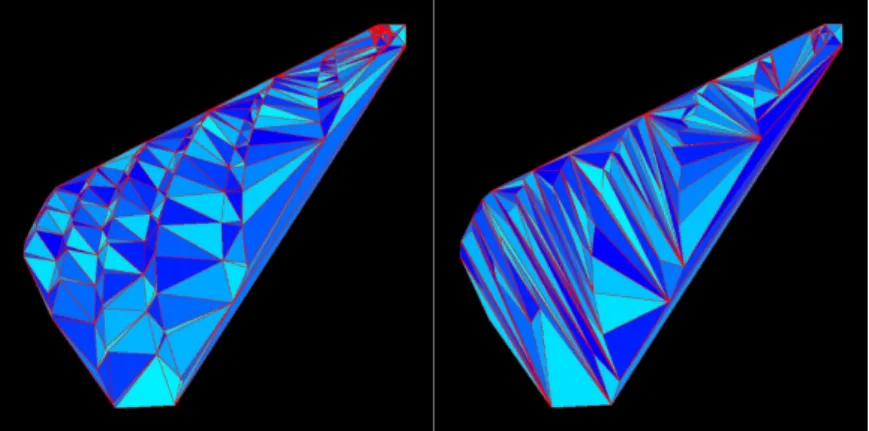
3.4 Triangle meshes generated by the CGAL (left) and Iterative (right)
based tessellations, given the same series of inputs. . . 52
3.5 An example of comparing two new points, A and B, to the
exist-ing triangle mesh in order to determine whether to insert the new
points or cull them. . . 54
3.6 Example of Hazard and Map Node creation, showing only a
por-tion of the potential links. The blue triangles being traversable
and all others colours being hazards. . . 62
3.7 An example terrain model of a fixed resolution grid, where green
nodes are traversable and red ones are not. Given the boundaries of hazard obstacles, shown as grey lines, the arbitrary alignment of the grid with respect to the terrain may produce different mod-els, with the left one having fewer traversable points for the same area of terrain. . . 64
3.8 Example of Occupancy Grids in use by a wheelchair collision
avoidance system approaching an elderly man with a walking frame [44]. 65
3.9 A hierarchy tree representation of the relationship between the
LIST OF FIGURES xiii 3.10 The contents of a simulation/environment configuration file. The
first three columns of numbers being Cartesian coordinates for po-sitions and the additional three columns associated with the
cam-eras being the target positions at which to be aimed. . . 76
3.11 An obstacle configuration file for adding four obstacles to a terrain. 77 3.12 Four combinations of Obstacle and Simulation configurations
in-side a control file, allowing two different obstacles files to be each
used with two simulation configurations. . . 77
3.13 Two test scenarios, consisting of gentle slopes and two obstacles (top) and steeper slopes, numerous obstacles and an unreachable goal (bottom), displayed beside the overlaid paths generated from trials conducted on them using the A* algorithm. The point ob-jects are the robot, the white are the goals and the grey obob-jects are
additional obstacles. . . 79
4.1 UML diagram showing the branching of different trial sets. . . 86
4.2 Visual depictions of nearby hazard triangles within the set
iden-tified by the robot. A→C were produced as the robot moved to
the right, while D is from later on, when the robot has explored to the left of the initial position of A. . . 92
5.1 Comparison of the summed/generalised results produced using
each configuration file. . . 96
5.2 Left: Completion status for A* algorithm, on Config combos 0,
Config combos 1 and Config combos 2. Right: The average
num-ber of movements occurring for each completion status. . . 98
5.3 Left: Completion status for LPA* algorithm, on Config combos 0
and Config combos 2. Right: The average number of movements
occurring for each completion status. . . 99
5.4 Overlaid paths generated by a simple state-based obstacle avoider
5.5 Config combos 0 terrain overview plus overlaid paths generated by the A*, LPA* and State-based algorithms, given as B, C and D, respectively. . . 101
5.6 Config combos 1 terrain overview plus overlaid paths generated
by A* algorithm, given as B and C, respectively. . . 102
5.7 Config combos 2 terrain overview plus overlaid paths generated
by A* and LPA* algorithms, given as B and C, respectively. . . . 102
5.8 Left: Completion status of various h-value weightings for A*
al-gorithm, on Config combos 0. Right: The average number of movements occurring for each completion status. . . 104
5.9 Left: Completion status of various h-value weightings for the A*
and LPA* algorithms, on Config combos 1. Right: The average number of movements occurring for each completion status. . . . 104 5.10 Left: Completion status of various h-value weightings for A*
al-gorithm, on Config combos 2. Right: The average number of movements occurring for each completion status. . . 105 5.11 Left: Completion status of various h-value weightings for the
LPA* algorithm, on Config combos 0. Right: The average num-ber of movements occurring for each completion status. . . 106 5.12 Left: Completion status of various h-value weightings for the
LPA* algorithm, on Config combos 1. Right: The average num-ber of movements occurring for each completion status. . . 106 5.13 Left: Completion status of various h-value weightings for the
LPA* algorithm, on Config combos 2. Right: The average num-ber of movements occurring for each completion status. . . 107 5.14 Left: Completion status for the A-series of alterations with the
A* algorithm, on Config combos 0. Right: The average number of movements occurring for each completion status. . . 108 5.15 Left: Completion status for the A-series of alterations with the
A* algorithm, on Config combos 1. Right: The average number of movements occurring for each completion status. . . 109
LIST OF FIGURES xv 5.16 Left: Completion status for the A-series of alterations with the
A* algorithm, on Config combos 2. Right: The average number of movements occurring for each completion status. . . 109 5.17 Overlaid paths generated by the A-series of variation, with the A*
Algorithm on Config combos 0. (A) Terrain overview (B) Set A0 paths, (C) Set A1 paths and (D) Set A2 paths. . . 110 5.18 Overlaid paths generated by A-series variation with A* Algorithm
on Config combos 1. (A) Terrain overview (B) Set A0 paths, (C) Set A1 paths and (D) Set A2 paths. . . 111 5.19 Overlaid paths generated by A-series variation with A* Algorithm
on Config combos 2. (A) Terrain overview (B) Set A0 paths, (C) Set A1 paths and (D) Set A2 paths. . . 112 5.20 Left: Completion status for sets D, E and H with the A* algorithm,
on Config combos 0. Right: The average number of movements occurring for each completion status. . . 114 5.21 Left: Completion status for sets D, E and H with the A* algorithm,
on Config combos 1. Right: The average number of movements occurring for each completion status. . . 115 5.22 Left: Completion status for sets D, E and H with the A* algorithm,
on Config combos 2. Right: The average number of movements occurring for each completion status. . . 116 5.23 Overlaid paths generated by A* Algorithm in trial sets D, E and
H, for Config combos 0. (A) Terrain overview, (B) Set D paths, (C) Set E paths and (D) Set H paths. . . 117 5.24 Overlaid paths generated by A* Algorithm in trial sets D, E and
H, for Config combos 1. (A) Terrain overview, (B) Set D paths, (C) Set E paths and (D) Set H paths. . . 118 5.25 Overlaid paths generated by A* Algorithm in trial sets D, E and
H, for Config combos 2. (A) Terrain overview, (B) Set D paths, (C) Set E paths and (D) Set H paths. . . 119
5.26 Left: Completion status for sets with small step sizes (set A1) and larger step sizes (set C), using the A* algorithm on Con-fig combos 0. Right: The average number of movements occur-ring for each completion status of the sets A1 and C plus a set adjusted set to account for the movements of set C being 5 times
larger than A1. . . 121
5.27 Left: Completion status for sets with small step sizes (A1) and larger step sizes (C), using the A* algorithm on Config combos 1. Right: The average number of movements occurring for each completion status of the sets A1 and C plus a set adjusted set to account for the movements of set C being 5 times larger than A1. . 121 5.28 Left: Completion status for sets with small step sizes (A1) and
larger step sizes (C), using the A* algorithm on Config combos 2. Right: The average number of movements occurring for each completion status of the sets A1 and C plus a set adjusted set to account for the movements of set C being 5 times larger than A1. . 122
6.1 Altering Terrain Tessellation as the Robot moves towards bottom
List of Algorithms
3.1 TessellatePoints() . . . 44 3.2 ProcessEmptyTriangles() . . . 45 3.3 CompareTriangles() . . . 48 3.4 World::AddPoint() . . . 55 3.5 World::IdentifyHazards() . . . 59 3.6 World::CheckWall() . . . 60 3.7 A Star Ctrl() . . . 72 3.8 A Star Eval() . . . 73 3.9 LPA Star() . . . 74 3.10 UpdateLPA() . . . 75 xviiList of Tables
4.1 Combined results of first two configurations within Config combos 0. 87
4.2 Results from third configuration within Config combos 0. . . 87
4.3 Results from the fourth configuration within Config combos 0. . . 88
4.4 Config combos 2. . . 88
4.5 Config combos 2A. . . 89
4.6 Config combos 2B. . . 89
4.7 Config combos 2B re-simulated. . . 90
4.8 Config combos 2C. . . 90
Glossary
A
A* A heuristic algorithm, calculating path values based on the distance
necessary to traverse to reach a point and proximity of the point to the destination., p. 31.
a priori In advance of a start time. Before examination., p. i.
C
CGAL The Computational Geometry Algorithms Library. A library of
math-ematical functions and structures, helpful in producing tessellations from sets of points., p. 51.
circumcircle The circle created through joining three points such that they all lie on its edge., p. 25.
circumsphere The sphere which links four points in 3D, such they all lie on its surface., p. 25.
CRASAR Center for Robot-Assisted Search and Rescue., p. 6.
D
D* A heuristic algorithm derived from A*, focused on working
back-wards from the destination to the start position., p. 31. xxi
D* Lite An enhancement of the D* algorithm, aimed to use a re-use approach much like the LPA* modification of the A* algorithm., p. 33.
Delaunay tessellation A method of generating a set of non-overlapping tri-angles from a given set of points. The set of tritri-angles being the dual of the voronoi graph of the points., p. 25.
L
LIDAR Light Detection and Ranging. A sensor/technique for gathering pre-cise relative measurements., p. 23.
LPA* A re-use modification of the A* algorithm, limiting re-calculation of
path values over successive iterations through a heuristic basis., p. 32.
M
Marsupial Robot teams which involve a larger unit carrying or housing one or more smaller robots, in order to enable transportation across difficult terrain., p. 13.
MeSci The National Museum of Emerging Science and Innovation., p. 17.
N
NIST National Institute of Standards and Technology., p. 17.
P
Polymorphic Robots which are capable of re-configuring modules so that the form factor of the robot is altered., p. 11.
GLOSSARY xxiii
S
SLAM Simultaneous localisation and mapping., p. 28.
Swarms Groups of interacting robots which approach tasks from a co-operative stance., p. 14.
U
USAR Urban Search and Rescue., p. 2.
V
Voronoi graph Voronoi graphs are comprised of cells formed around the points within a set, so that all edges in the graph are of equal distance to the nearest two points and hence any position inside a cell is closer to the encapsulated point than any other point in the set., p. 25.
Chapter 1
Introduction
The first few hours following a disaster are the most critical, with the chance of saving lives being at its greatest. However, in the case of collapsed infrastructure and buildings, the first few hours are also the most dangerous to send rescuers into the site of the disaster. Hence, the concept of using unmanned exploratory vehicles suited to this kind of terrain is being embraced, to map the area and locate individuals trapped in the rubble. Then once it is deemed safe for rescuers to enter the area, they can get straight to saving people instead of wasting crucial time searching.
Many research groups across the globe are now developing task forces of robots which can be used to help in such Search and Rescue operations. This project aims to provide a useful tool for such groups in establishing which algo-rithms and parameters provide the most appropriate autonomous path planning for their specific purposes or scenarios before a physical robot has been built and without need of a disaster site or mock up, on which to test. This will be achieved through the design and implementation of a software based system to allow a virtual robot to autonomously navigate across a disaster site simulation with the choice from a variety of path planning algorithms and a multitude of variables such as robot dimensions, traversable terrain ascent angles, and data structures. The data structures referred to here include, different types of nodes for use by path planning algorithms, various types of terrain models, restricted and flexible
potential path networks, and also a variety of data storage methods for current and past terrain knowledge.
In order to identify the optimal path through the disaster environment, the robot needs to be able to identify features of the landscape which could be haz-ardous or insurmountable and determine the shortest path to the destination given the gathered data. As the robot travels and receives new data it will have to dy-namically re-evaluate the previously determined hazards and path choice.
Producing a modular open-source design, allows development to be furthered by any interested parties, to reflect design choices they wish to follow or con-straints which they have imposed. The addition of new modules greatly expands the potential combinations and scenarios which can be investigated without re-quiring the replication of the work necessary to produce a platform on which these combinations can be possible.
The motivation which brought about this project’s inception, was the creation of a task force of robotic units at Victoria University for the purpose of Urban Search and Rescue (USAR), under the supervision of Dale Carnegie and with the cooperation of other Universities within New Zealand. As such, the selection of features currently present and the basis for decisions such as default values and input method have been guided by that larger project.
To ascertain that the Simulator is both easy to use and can produce usable results, the Simulator tests an individual robot interacting with a varying terrain containing multiple additional obstacles. Values used for the dimensions of this robot and its ability to handle different terrain gradients, are based on a moder-ately sized four wheel low-profile robot. The focus during testing was on the navigation (and hence also the mapping) of the robot when placed in different locations and tasked with reaching specific goals, with additional exploration not being encouraged more than was necessary to reach the goal.
The original non-graphical prototype from which this simulator progressed, was presented at the 2006 Electronics New Zealand Conference (ENZCon ‘06), exploring the potential of a USAR simulator, and demonstrating basic behaviour and usage. From the work completed during this thesis, a paper was generated
3 outlining the design considerations, hindrances and process of creating and im-plementing a novel simulation platform such as this one. This paper was accepted by and subsequently presented at the 7th IEEE International Conference on Con-trol & Automation (ICCA ‘09), alongside other papers on the design, simulation and interfacing of other autonomous vehicles and robots.
Chapter 2
Background
2.1
Urban Search and Rescue
Research into the use of robotic units in Urban Search and Rescue began in Japan after a very strong earthquake hit the regions of Kobe and Osaka on the 17th of January 1995 [1]. In the U.S. it was after the Oklahoma Bombings on the 19th of April the same year, that research first began [1]. The 9/11 terrorist attacks were the first major disaster where teleoperated robots were used to try to aid Search and Rescue teams [1]. This globally watched disaster also gave more impetus and research funding, while greatly expanding the number of institutes involved in developing robotics for post-disaster humanitarian efforts. International competi-tions have also been established to encourage innovation and provide comparison of design and effectiveness.
This field of research has seen numerous different design paths taken, each design choice with its own benefits and flaws. There are various means of robot locomotion, methods of overcoming or avoiding obstacles and techniques or sen-sors for detecting human casualties. Due to the hazardous nature of the envi-ronment, being robust yet cheap has been a primary objective, with self-righting mechanisms and stair/ledge climbing designs also being tried in attempts to min-imise the limitations of movement caused by different hazards or insurmountable obstacles.
Tethered teleoperated robots have been the primary choice for USAR robots as using a human agent is considered more reliable to make decisions and because the tether provides the reliable high-bandwidth necessary for live video which a human requires[2]. Autonomous robots can dispense with transmitting a vide-ofeed and as such have more freedom with which to move as they have no tether to get caught and are not limited by the tether length. A tether also provides additional strain/resistance as it must be pulled along, an added means of disori-entation (if tension is applied or released to the tether when the robot turns) and a tether could pose a danger as it may trip a human rescuer or if being pulled again-st/around rumble it may cause a shift or rock fall. One benefit of tethers, is that if robots delve into crevasses and fall or get stuck they can potentially be pulled out via the tether acting as a safety line.
USAR robots can provide replacements for humans and canines in dangerous situations, such as when after-shocks or secondary affects may cause further col-lapse, or when fires or toxic gases are present, thus avoiding further loss or injury. However, their usage and capabilities in this capacity are far from perfected and this is not the only task where they could provide benefit. Due to being a devel-oping and unproven field, the humans involved with search and rescue are often wary of the presence of robots and trusting the information they may produce [3]. Robots can be viewed by rescue teams as a nuisance/distraction and another ob-stacle to deal with and which may provide a hazard, in an already dangerous environment. In spite of a distrust of the robots in their conceptual role, Search and Rescue members have found alternative purposes for them such as lowering tethered robots down holes to act as a remote camera/sensor to access structural integrity of lower levels and likelihood of whether they may collapse further.
Alternative ways in which USAR robots can provide assistance to rescuers have been taken into account, with the Center for Robot-Assisted Search and Res-cue (CRASAR) developing the use of robots as a delivery system for fluids, med-ical supplies and sensors, in addition to two-way communication.
One finding of the application of USAR robots in real disaster scenarios has been that designs driven by competition results have been lacking in many ways,
2.2. ROBOT TYPES 7 such that they are not suited to real USAR due to the robots not being robust enough and the path planning etc. not being compatible with robots which were[3]. The sensors and detection systems of USAR robots need to be small and robust, however the useful ones are often too large and complex, with the potential to be damaged in a realistic scenario.
2.2
Robot types
There are four common types of locomotion used in ground based exploration. These are wheeled, tracked, walking and snake-like units, which move via un-dulation of multiple jointed segments. The hybridisation of the jointed segment design with one of the other means of locomotion is referred to as serpentine and an example of such a robot is shown in Figure 2.1 [4]. Wheeled and tracked robots are well suited to autonomous operation with the likelihood of tipping over being much less than walking units and the control being much easier than with walk-ing and snake-like or serpentine robots. However, the much greater freedom of movement of a snake-like and serpentine does allow for very adverse terrain to be traversed, with Figure 2.1 showing one such robot overcoming a piece of terrain no other design would have. Aerial robots can also be used in terrain mapping and have a variety of mobility methods which mimic planes, gliders, helicopters and dirigibles. In disaster scenarios, land based units tend to face a greater range of problems than aerial ones, including shifting terrain, hazardous drops, non-traversable slopes and limited fields of view. However, they can provide greater levels of information due to their closer proximity, especially with regards to lo-cation of human casualties.
The manner in which a robot moves and the amount of clearance necessary to do so, and what situations are hazardous or insurmountable, is dependant on the choice of locomotion and hence different robot types may be simulated differently or require different values for some parameters. The intended behaviour of a robot, such as working individually versus co-operatively, or exploring a region versus reaching a specific destination, also affects the design of a simulator and
Figure 2.1: The OmniTread, an example of an articulated serpentine robot de-sign [4].
the choice of features present within it.
Of these traversal methods available to ground based units, there are a few specifics which differentiate them from robots used in other scenarios such as office buildings, factories or entertainment/toys. Unlike the standard arrangement in most wheeled vehicles, wheeled robots for USAR purposes usually have fixed position wheels which are differentially driven, rather than having a pair of wheels which change orientation/angle to steer the vehicle.
All fully tracked vehicles are differentially driven as the tracks do not allow for the wheels to alter direction however the USAR robots have a few track designs which are not common to vehicles. Track designs can be simple, such as the flat layout of a Bulldozer labelled A in Figure 2.2, or may account for desirable behaviour as the trapezium layout of tracks on a Tank does, through allowing for bi-directional traversable over top of obstacles. For some purposes the fourth set of wheels for bi-directional obstacle climbing may be removed to produce an obtuse triangular layout, given as layout B of Figure 2.2, as unidirectional climbing capabilities may be sufficient. In addition to these relatively basic track layouts, another design which is possible for robots is having four sets of tracks, as depicted by designs C and D of Figure 2.2, with two being used for locomotion
2.2. ROBOT TYPES 9
Figure 2.2: A variety of tracked robot designs. A - Basic tracked setup. B - Fixed form climber. C - Flipper arms climber in low profile shape. D - Flipper arms climber in climb configuration. E - Tank like tracks capable of climbing in either direction of movement.
and the others being pivoting arms which can be used to raise the front or rear higher as well as for stair climbing like the obtuse triangle approach. Additionally these flipper arms can be used to right the robot if it rolls or falls, and find itself upside down. Another potential though seeming unutilised approach would be to provide higher point of view for sensors/cameras when the front is raised, to allow them to view past obstacles.
Robots which have legs can either attempt to mimic humans with bipedal mo-tion or adopt a more stable multilegged design akin to an insect or spider, though unlike animals they do not necessarily follow a symmetrical design and can have an odd number of legs. Figures 2.3 and 2.4 show examples of robots designed for bipedal and multilegged motion, respectively. While having more legs provides more points of contact and hence greater stability, each additional leg is another item which must be controlled though often only in terms of extension and place-ment as the unit will follow an overall guiding pattern of when to move each one in order to move in the desired direction. Designs which have the legs attached radially rather than in two parallel sets, can be omnidirectional as they have no clear front however often the placement of cameras and sensors may dictate a preferential direction.
Figure 2.3: A bipedal research robot used to study human motion, viewed from two angles [5].
Figure 2.4: A multilegged robot, as commercially available, shown in two posi-tions [6].
2.2. ROBOT TYPES 11 The choice of locomotion design effects the navigation in terms of poten-tial obstacles and paths. A common point amongst multilegged walkers, tracked robots, differential-drive wheeled robots and potentially some bipedal robots, is that they are capable of changing direction on the spot. This factor is beneficial for both path planning and simulation as there is no turning circle to account for or need for manoeuvres such as 3-point turns. For serpentine robots, wheeled robots without differential drive, and most bipedal designs, small adjustments in direc-tion are perfectly within their capabilities however drastic changes in orientadirec-tion can require more room than may be available or manoeuvres like 3 point turns.
Approaches which attempt to climb over obstacles affect the process of hazard identification as they introduce the potential for walls of limited height to not be obstacles. However these stair climber mechanisms hold no substantial benefit with traversing steep slopes other than providing recourse in the event the robot rolls on attempting such a slope.
To deal with the complexities of disaster sites, some research groups have opted to redesigned the whole robotic unit rather than including novel function-ality, such as stair climbing, through the addition of modules to standard robot designs. The results of these design branches include robots which can transform into different configurations or contort and shape-shift, so that they can overcome obstacles or fit through tight spaces. Other approaches have seen teams of split purpose robots which aim to specialise in different tasks associated with USAR.
2.2.1
Shape shifters
Taking solutions to a new level are shape shifting robots, which rather than hav-ing mechanisms or modules added to a design to overcome certain obstacle types, have the whole unit designed around the idea of crossing the most difficult terrain. Polymorphic robots initially tended to be of a serpentine or centipede-like design as shown in Figure 2.5, which gave them a high degree of freedom, but also meant control was difficult and movement often consumed a lot of power [7]. Balancing efficiency and ease of control against space required to change shape, the next evolution in design were units such as the Amoeba-II, which is shown in Figure
Figure 2.5: The M-TRAN III, a serpentine shape shifting robot, in a variety of permutations [9].
2.6, that can be likened to articulated truck-trailer pairs [7]. These articulated pairs provide a level of compromise, giving the ability for some shape changing but not so much as to be too complex to control, while maintaining much of the efficiency of wheeled or tracked robots. One issue which arises with these simple shape changers is that the space required for them to transform from one mode to another can be much greater. Complex serpentine robots have enough degrees of freedom that the right combination of moves can readjust it in almost any situa-tion. However, for basic designs with few joints, the turning circle/angles required for transformations could make it difficult to find appropriate areas in which to do so. This is especially difficult if the robot is to be autonomous.
While having various configurations in which the robot can traverse across terrain increases the variety of situations which can be handled, these advances in design provide an additional layer of complexity to the already problematic task of autonomous navigation. What the design and focus of current shape shifter research comes down to is the balance of versatility versus power consumption and ease of control for teleoperated robots, with the combination of autonomy and transforming designs being much further off [8].
2.2. ROBOT TYPES 13
Figure 2.6: An example of an articulated-pair shape shifting robot design. The Amoeba-II shown in two states [7].
2.2.2
Marsupial teams
‘Marsupial’ robots involve features and abilities being broken down across a set of robots of varying size and shape, with larger ones generally transporting smaller ones [8]. With the separation of tasks, functionality and cost can both be im-proved, as smaller robots with sensors for finding human life signs can get into tighter spots while safely covering great distances to get to these spots thanks to a larger more robust unit acting as a carrier. To cover a vast area, a swarm of these smaller units can be taken deep into the site and then allowed to radiate out from the carrier, or alternatively be dropped while crossing terrain, to spread out orthogonally from the carrier’s path. Thanks to the shelter of the carrier, these smaller units need not be particularly robust and as such can be much cheaper, to the point of even being financially disposable, with losses due to accidents and hazards being tolerable[10].
Unlike polymorphic designs which increase the possibilities and hence com-plexity of autonomous path planning, marsupial teams are complimentary with autonomous navigation. Each class of robot may have different parameters reflect-ing their size, hardware and purpose but can use the same approach to navigation. Smaller robots delivered by a large carrier may move in smaller increments and
hence cover a very restricted region, as well as having lower quality sensors which can not detect points as far away. Operating in a smaller region the robots may use a higher resolution/lower scale model, however as they are likely to possess limited memory and processing power, then only relatively simple algorithms can be employed.
2.2.3
Robot swarms
One concept which is reliant on autonomous navigation is using ‘Swarms’ of robot clones, where information is passed between each unit to improve the mod-elling of the terrain and also ensure greater coverage of the area without a lot of overlap[2]. Due to the nature of having so many robots on a site, having humans controlling each robot is impractical and would require many expensive worksta-tions and trained operators. Autonomous USAR robots provide a practical solu-tion to this problem. With robot swarms the advantages of autonomous naviga-tion are further embraced, using the ability to transfer informanaviga-tion and insert it into other robot’s models to build more insightful maps and coordinate activities. Swarms also allow for the positions of individual robots to be triangulated with respect to neighbouring robots and hence over an entire swarm and multiple iter-ations they can calculate fairly accurate relative positions for all, with any error that does occur being uniform/common to all[2]. This method of localisation via neighbours takes advantage of the more accurate ranging sensors to overcome is-sues of low quality odometry sensors which may be found in small disposable robots and issues of positional slip which odometry sensors are unable to detect.
As already mentioned, there are issues with the use of wireless communication in disaster sites but these are not overly problematic for swarms due to the differ-ent nature of what is being transmitted compared to teleoperated robots. Swarms require lower bandwidth as they are sending specific/quality/valuable data rather than streaming video, would be closer to recipient units, have redundant/multi-ple communication paths and the data does not have to be received in real-time, with robots still able to operate without interaction, hence wireless issues do not become a concern.
2.2. ROBOT TYPES 15 This swarm of clones differs from marsupial teams where the smaller units may communicate only with the central ‘mother’ unit, being analogous to an ad hoc network as opposed to a network with a central access point. The swarm can be efficient in that the nearer units are more likely to benefit from interaction with the robot, however a central point can provide greater resources for processing and analysing data.
2.2.4
Confined space exploration
One of most dangerous and also difficult places for humans to explore are the spaces created within/underneath fallen buildings and other civil structures, thus specific robots for delving into these tight and dangerous spaces are important [11]. In these instances the danger to a rescuer lies in becoming trapped themselves, coming across gas leaks/pockets and the rubble shifting/collapsing on them thus turning them from rescuer into victim/casualty. Sending robots into these situa-tions not only avoids endangering rescuers but also provides an ability to detect dangerous gases that may be found within the rubble as well as offering a wider range of means to detect humans through the gas/air analysis. The same detec-tion systems, such as nondispersive infrared sensors, which can be used to detect
deadly gases could also identify concentration of CO2, a by-product of human
respiration. As well as the outlined danger, it is also highly difficult for a human to delve very far into the rubble without laborious effort or the aid of heavy ma-chinery (something one is disinclined to send onto a disaster site until late in the rescue due to the weight of the machinery shifting rubble and potentially causing more trouble than benefit). The tight, rough and winding tunnels one may find in the interconnecting nooks and caverns within rubble pose little obstacle for robots of a serpentine design, which are both slender and have many points of freedom such that they can contort into a variety of shapes[4]. In some instances, such as the rubble remaining in large pieces, low profile tracked or wheeled robots may also be able to explore much of the region between rubble [11]. In these confined spaces, the line of sight is often drastically reduced due to winding tunnels as well as low cavern/tunnel ceilings (the height of which may vary in addition to the
vari-Figure 2.7: Tree diagram categorising areas of failure of mobile robots [12].
ance in the ground upon which the robot is situated). As such, in these regions of occlusion, accurate localisation becomes much more important as the limited line of sight makes it hard to detect errors or disorientation.
2.3
Analysis of Robot failures
Much of the analysis of robot failures focuses on the ruggedness of the physical aspects of the robot and/or its ability to avoid potentially damaging situations [12]. The physical component of the failure tree diagram shown in Figure 2.7, is not overly relevant to this project due to being based in the virtual world. With the human branch of the diagram, which is split between mistakes, slips in control and design flaws, it is mainly the design flaws that are of interest and more so in relation to damage avoidance rather than ruggedness.
2.4
Competitions
In the past much of the focus in locomotive robot design has been on agility and robustness, aimed at exploration vehicles for places such as the moon or Mars where there is a great deal of preparation for a task and numerous people available to work as a team to control a robot. The usefulness of exploratory robots in other applications has been seized upon, as are using them as the basis for developing artificial intelligence. A number of organisations now hold international
competi-2.4. COMPETITIONS 17 tions involving robots [1]. These competitions are aimed at creating more public interest in robotics and allowing comparison between the designs and techniques into which different institutes and research groups have been delving. Some com-petitions or branches thereof, focus on the human-robot interface and the ability to control the robot in complex tasks, while others focus on the robot’s autonomy and cognition.
One of the major competitions being run involving rescue robots, is held by the US based National Institute of Standards and Technology (NIST), which has three different arenas representing disaster site scenarios of differing complexity level [13]. The National Museum of Emerging Science and Innovation (MeSci) of Japan hosts similar competitions to NIST but interestingly, due to the country of origin the materials and scenarios encountered vary quite a lot [14]. The NIST are-nas involve typical materials of sky scrapers such as rubble from concrete blocks, tile flooring and carpet. The different architectural styles and cityscapes of Japan mean that sheet rock and wooden building materials can be found in the disaster mock-up along with tatami mats which would be extremely uncommon in North America. Figure 2.8 shows the three of the arenas used in the NIST competitions, while the arenas present in the MeSci competition can be seen in Figure 2.9, with it possible to notice some of the similarities and differences in the materials used for each competition.
For both competitions the three arenas are colour coded as yellow, orange and red in order of increasing complexity. The yellow arenas are large and designed to test the sensors and algorithms used in mapping and planning. Some areas of the arena can be altered in real-time, for example closing doors or adding blockages to passages, to test how the robots react to changes in known regions. Overall the yellow arenas, as shown in Figures 2.8 and 2.9, look like evacuated buildings rather than the sites which have sustained damage from some of a disaster.
With the orange arenas the focus shifts to testing the agility of the robots. Various flooring materials which may affect locomotion or odometry, are used across the arena as Figure 2.8 shows and there are some raised sections such as the one in Figure 2.9 which are added to create a multi-tiered environment. In
addition to ramps, more difficult means of reaching the upper level, such as via stairs or a ladder, are present to encourage and test various climbing techniques. In addition to simple obstacles hindering robots, the orange arena contains hazards which pose a danger to the robots, such as items which if disturbed could cause a minor collapse or holes in the upper level into which a robot could fall.
The most difficult scenarios are present in the red arenas, which as can be see in Figures 2.8 and 2.9, begin to resemble actual disaster environments. Building materials are strewn around creating a terrain which is not only difficult to traverse but also can be problematic for sensors and mapping due to translucent items such as plastic sheeting or discontinuous surfaces like wire meshes, gratings/vents or pallets. In addition to items which if knocked could collapse around or on a robot, the red arena includes flooring which is unstable and may potentially collapse underneath a robot. This type of collapsing hazard provides a significant threat to designs which may attempt to approach USAR through heavy duty robustness and an over abundance of sensors, resulting in heavy robots.
These competitions provide a base platform which allows USAR designs to be benchmarked and compared, however the scenarios are far from realistic. Robots which can survive and negotiate the arenas, will not necessarily be capable of sur-viving or traversing a real disaster site and the algorithms/automation is in general not portable to other robots which are suited to being used on real disasters.
The most widely known string of competitions have been the ones sponsored by the Defense Advanced Research Projects Agency(DARPA), a US Military re-search group, with the competitions being the Grand Challenge and the Urban Challenge [15]. The robotic side of the competitions is not as clear to some due to standard vehicles being used, which outwardly do not match public perception of what a robot is. However, these vehicles have been outfitted with many sensors and other robotic controls in order to attempt to autonomously traverse a rugged terrain.
The RoboCup is a group of competitions which are more aligned with public perception of robotics, with units being of a much smaller scale than a vehicle and usually having a much more science fiction like appearance [16]. The first
2.4. COMPETITIONS 19
2.5. SIMULATORS 21 competitions involved playing soccer and were split into different size categories, with a humanoid league later being added as well as competitions focussed on USAR.
2.5
Simulators
In terms of 3D Robot Simulators a number of commercial alternatives exist, with a number of very limited open source ones also available [17]. Simulations have in past been limited to a numerical basis (such as those based upon Matlab) with lim-ited or no graphical visualisation, but 3D simulators have over time been adopted by many. In terms of graphics, many have used custom rendering engines which require their own upkeep, rather than widely used pre-existing ones which are likely to stay current with improvements in technology via large development teams or communities. However, there is a trend of moving towards commercial graphics engines or pre-existing open source engines, which has made the up-take of 3D graphical simulations easier as it no longer requires a team/number of developers to implement the graphical side of a simulator.
Most of the simulators are purpose built for certain robots or specific test are-nas and in general are not of much use for the wider research community. In-stances of simulators used to recreate specific arenas, like the three NIST arenas for example, are analogous to implementing an analogue solution upon digital equipment in that they replicate solutions which had been restricted by limited capabilities and discard all the benefits which the modern technology can provide. Running in the virtual world, a computer simulator allows for drastic alterations to be made to test environments without the time, labour or material costs associated with altering or adapting a physical test arena for each new layout to be tested.
Except for one instance, all the search and rescue simulators encountered have been designed for the purpose of testing teleoperation capabilities and interfaces, focussing on improving the interaction aspect of the failure tree shown in Figure 2.7, with research into and testing of, autonomous navigation being an ignored area of potential application for simulators. At present the only autonomous
nav-igation simulator found by the Author, is the Unified System for Automation and Robot Simulation (USARSim)[18], which was not encountered until the com-pletion of this project. USARSim uses the Unreal Tournament (UT) game en-gine, which it requires to be purchased separately, and has been the basis for the RoboCupRescue virtual robot competition. While providing a very picturesque high-fidelity simulation for free and purporting to being compatible with Unix-based systems, USARSim appears to only be readily available as a pre-compiled executable file for Windows or as source code developed for Windows, and re-quires the purchase of the proprietary UT graphics engine. So as at present no other modular or truly open source simulation platforms could be found.
2.6
Autonomous Navigation
The primary constraint of almost every mobile object is energy, be they baseballs, mobile phones, humans, cars, or robots. The object’s capacity to store energy, the frequency of events or locations at which more can be acquired and the efficacy of use, all determine how an object behaves. Some robots have automated recharge points which they periodically must find and return to, other robots will have humans replace or recharge battery banks and then there are a few robots such as the Mars Rovers which once unable to obtain more energy are simply left where they lie. In all cases, the paths travelled by the robots and how they are chosen play an important role, from ensuring the robot finds the recharge point to allowing the robot to operate for as long as possible before it is useless.
The environment robots are placed in are often unknown, with data being
re-ceived from sensors which give relative range data. The lack of a priori data
means the robot has to dynamically create a representation of the terrain, so find-ing perfect paths is unlikely. Dead-ends will occur in the terrain, so the robot will at times need to back-track and thus the robot must keep data about the terrain for some time, rather than discarding upon passing.
In order to identify suitable paths through the rubble, a robot needs to be able to identify features of the landscape which could be hazardous or insurmountable
2.7. TERRAIN MODELLING 23 and determine the shortest path to the destination given the known data. As a robot travels and receives new data it will have to dynamically re-evaluate the previously determined hazards and path choices.
2.7
Terrain modelling
One section crucial to both identifying hazards and planning paths is the inter-pretation of data from the input sensors, which is dependant on the nature of the sensors. Sensors may be omnidirectional or have a limited area of detection. In instances where the received data comes from a forward facing directional sensor, such as some form of range finder, regions can often be occluded by obstacles or rises in closer areas and so when ascending a section of terrain the following de-scent is likely to be unknown. How the height value of an unknown XY coordinate is interpolated depends on the method of modelling the terrain. Models are gener-ally derived from the point cloud of data received about the real terrain, and may involve turning the points into a non-overlapping mesh representing the surface. For omnidirectional sensors occlusion may also occur, however as a robot moves and new data are received, an omnidirectional sensor may view an occluded re-gion more times and from a greater range of angles, giving it more opportunities to detect the previously occluded region.
2.7.1
LIDAR
One method of determining distances is through using Light Detection and Rang-ing (LIDAR). While live camera feeds are highly beneficial to humans teleoper-ating a robot, they are not intrinsically of benefit to an autonomous robot which would need to process the images for edge detection and try to extrapolate relative distances based on the visual expansion or diminishment of points and knowing its own motion. So LIDAR may be used instead to gather sets of relative mea-surements from which to build a model. LIDAR measures the distance to the first object a laser encounters in a straight line path and knowing the orientation and
inclination of the laser, this measurement can be used to calculate the relative po-sition of the object the laser intersected. The principles behind LIDAR are much the same as with radar systems but with LIDAR operating within the ultraviolet, visible light and infrared parts of the electromagnetic spectrum as opposed to us-ing microwaves or radio waves. The benefit of usus-ing shorter wavelengths such as IR is that tiny objects can be detected/imaged, thus differentiating the potential uses for LIDAR from radar, which is better suited to tracking large objects such as cars, planes or ships for which fidelity/resolution is of little importance.
While LIDAR is good for monitoring the proximity of obstacles, due to mea-surements being relative to the robot, the building up of a terrain map can suffer problems if the robot’s motion is imprecisely known, it slips or is disorientated. The potential for errors can be dealt with through coupling LIDAR with abso-lute positioning systems such as GPS or determining a localised position through model matching, the proximity with other robots or active beacons.
The basic process by which distances are determined with LIDAR is through pulsing a laser and then judging the return flight time based on the phase difference between transmission and receipt, and knowing the speed of the signal. There is a limited range within which measurements can be made due to the signal strength weakening and limitations of detection.
2.7.2
Tessellation
To create a terrain mesh and hence a model which can be interacted with to deter-mine surfaces, their gradients and collisions with them, the point cloud of input data has to be transformed into a set of non-overlapping shapes. This process is referred to as tessellation and can produce sets of polygons of various sizes and shapes, or sets of specific shapes such as triangles, which is also known as trian-gulation. As all polygons can be broken down into submeshes of triangles, both paths of modelling are closely related. It is preferred to use triangles for rendering large interactive terrains due to the simplicity provided through the uniform num-ber of vertices and neighbours. There are numerous ways to join any given set of points and hence there are many methods of tessellation, however one of the most
2.7. TERRAIN MODELLING 25 widely used and thoroughly tested is the technique put forward by Boris Delau-nay in 1934[19]. DelauDelau-nay’s approach has had much mathematical scrutiny and has been found to produce quality meshes which are excellent for the purposes of graphical modelling.
Delaunay
Delaunay tessellation is a well established method of turning any arbitrary model in two or three dimensions into a set of triangles or tetrahedra, respectively. The act of transforming a set of points/vertices into a set of non-overlapping triangles or non-intersecting tetrahedra which fully embody the model is certainly not a simple one. A vast number of possible combinations/permutations exist and as such Delaunay tessellation is based on a number of mathematical properties. A benefit of Delaunay triangulation is that due to the mathematic principles involved, it attempts to maintain optimal internal angles for triangles and tetrahedra which are hence produced in more uniform shape. As such, two dimensional meshes are usually devoid of slivery triangles, however in three dimensions slivery tetrahedra may still occur dependant on the terrain. At the core of the Delaunay tessellation is the feature that the defined set of edges is the dual of the Voronoi graph for the input points. A Voronoi graph being a set of non-overlapping cells, each position around a point such that any position inside the cell is closer to the enclosed point than any other point within the set. Following on from this property, no point may lie within the circumcircle or circumsphere of a triangle or tetrahedra. This characteristic makes the incremental addition of new points much simpler, as it provides a test for determining which triangles/tetrahedra are affected by the new point’s insertion and thus identifies which set of points needs to be re-processed to maintain a valid Delaunay tessellation. A number of algorithms exist to build Delaunay tessellations in two or three dimensions, with the principle applying to higher orders as well but with the complexity of ascertaining the validity of tes-sellation and hence the complexity of creation greatly rising with the inclusion of each additional dimension. A popular method of constructing Delaunay tessella-tions is the Bowyer-Watson algorithm, which starts with a large all
encompass-ing triangle/tetrahedra that tessellates as points are incrementally inserted within it[20]. There are two criteria which must be maintained for validity, firstly that no degenerative cases exist whereby a loss of precision leads to ambiguity with respect to whether additional points exist on a circumcircle/sphere. The other cri-teria requires that the polygon/polyhedron created by the set of affected points must be ‘point convex’, whereby the points/edge form a convex hull. A convex hull being when the hull or boundary enclosing a set of points is convex and has no regions within it not being covered by triangles.
A modification to Delaunay tessellation is when a set of edges are given which must not be broken or removed. Because of the restrictions imposed by this, this is referred to as a constrained Delaunay tessellation. Constrained tessellation further increases the complexity of tessellation and as such is currently only possible with two-dimensions, as an equivalent method for three has not been discovered. The benefit of these constrained tessellations would be having them coupled with edge detection algorithms, which determine the presence of edges from visual input. The lines found by the algorithms would help to ensure a greater accuracy in the depiction of the environment [21].
2.7.3
Data culling
To ensure the quality and accuracy of models, a large quantity of points are re-quired. However, the amount of data required to gain confidence in the accuracy of a model and subsequent alteration to it, can be excessive in terms of data stor-age. In order to reduce the resources used, selective filtering of points is necessary in judging which to use and keep/insert into the model.
Dependant on the terrain being viewed, the data or groups of points within the data, may be densely grouped when faced with an upwards slope or an obstacle is nearby while a downwards sloping surface or being at the top of a ridge/cliff may result in the points being spread over a greater area. To ensure having enough data about a region in the latter case, the sensor/scan increments need to be smal-l/fine and hence for the former case there is an excess of data, which needs to be culled. Eliminating points based on proximity, in order to produce a more
2.7. TERRAIN MODELLING 27
Figure 2.10: Comparison of a terrain model against results from applying data culling techniques [22]. Left: without pre-processing; Centre: with proximity suppression; Right: with coplanar point elimination.
desirable level of fidelity/resolution, is one method of culling the data which is very effective. Large flat surfaces may potentially exist within a terrain, with lit-tle value being provided through these being tessellated by numerous triangles, so combining neighbouring triangles which exist within the same plane, can help reduce the number of points used within a model. However, establishing with cer-tainty whether a surface is flat and whether modelling it with a few large triangles is accurate, is difficult as it may only appear so due to the presence or combina-tion of, sensor error/accuracy, over zealous data culling or occlusion of points due to angle/position. Sensor errors/noise can also conversely result in a flat surface being modelled by triangles which are not coplanar, so tolerance/precision factors must be involved with the removal of data, which thus provides another aspect of the modelling and culling which may lead to erroneously judging a surface to be flat, or potentially judging a coplanar region to be larger than it is. Figure 2.10 demonstrates the benefits of applying pre-processing data culling methods to a terrain model, with the frames (going from left to right) containing progressively fewer triangles while producing a model of the same terrain. The effect of elimi-nating points which are coplanar is particularly noticeable for the large flat region in the foreground of the models.
In addition to culling received data so as to minimise the resources allocat-ed/necessary for producing an accurate terrain model, further filtering and analysing already held data to limit the size/expanse of the terrain model, provides further
benefits. Having survived the filtering upon initial reception, data culled at a later stage will have had some value, so attempts to extract/acummulate/concentrate that value into less data may occur, rather than simply discarding/deleting data.
Relaxing the conditions/thresholds of retention of coplanar points, when the points are outside a distance of likely re-encountering/interest such that groups of coplanar faces/triangles are recombined is one such method of decreasing the quantity of data without significant impact on the quality, however dependant on the model or method of tessellation, removal of points may be processor intensive.
2.7.4
Simultaneous localisation and mapping
“The ‘solution’ of the SLAM problem has been seen as a ‘holy grail’ for the mo-bile robotics community as it would provide the means to make a robot truly au-tonomous [23].”
Simultaneous localisation and mapping (SLAM) is an area of research which attempts to use relative measurements of the terrain to both map the region and determine the robot’s position within the terrain. As building an accurate terrain model requires knowing the location/relative position and localisation requires accurate maps, SLAM is somewhat of a ‘chicken and the egg’ conundrum. The eventual aim is to be capable of handling the ‘correspondence problem’, which involves being able to identify/recognise a set of points common to two or more views/images of the same object/area. In the case of mobile robots this means identifying previously encountered terrain when approached from a different an-gle and position, by comparing the held map/model with the current view/data. A simple example of the goal for this field of research is the idea of a robot entering a previously visited room via an alternate door, such that the room and contents are now being viewed from the side rather than front, recognising that it had been there and hence both determining its location and further improving/building upon the terrain map. When applied in two dimensions online scan matching which compares held data with scanned data to identify patterns in order to estimate the robot’s position is not too difficult. However, when applied to 3D terrains it be-comes much more problematic as the positioning (height) and orientation(incline)
2.8. PATH PLANNING ALGORITHMS 29 of a robot has to also be accounted for [11].
While this project does not aim to solve the SLAM problem, the style of map building is similar to other autonomous systems such as the type created for this project and highlights the kind of issues which may be faced when mapping a terrain using relative measurements. Maps are built which revolve around the geometrical relevance/consistency (shapes, size, spacing etc.) of the terrain and being as accurate as possible in this respect, as opposed to identifying topologi-cal features such as altitudes/contour lines which are more relevant to large stopologi-cale approximate mapping. Over time, as features are observed from various posi-tions, the accuracy of estimates/modelling increases. Because all measurements within the model are relative, it is not just the re-observed features which improve but also other previously viewed regions, as the affect of the improved estimates propagates throughout the model. This propagation/convergence, means that lo-calised maps provide for high levels of accuracy in terms of relative measurements within a model, however they can lack accuracy with regards to where they be-lieve they, and the terrain, fit on a larger scale, with Figure 2.11 demonstrating this characteristic. Potentially, scanning matching with maps from other robots maybe necessary to reconcile global positioning (as mentioned in swarms/ad-hoc networks). An issue which can be present when using relative positioning to build maps, is that the environment may alter over time and the disparity between the held model and real terrain can flow through to affect the robot’s localisation. Using a probabilistic approach allows for variance and subsequently adjustment over time, allowing the model and localisation to eventually converge with the (newly altered) real terrain. For non-SLAM based systems it may be necessary to instead discard all the data and begin again or to have some measure of tracking trust/confidence about regions.
2.8
Path Planning Algorithms
There are multiple types of path planning, which are commonly split into two main categories. The first category is topological planning, which is when the terrain
Figure 2.11: Diagram highlighting the accuracy of measurements within a model but variance from real world locations.
to be crossed is known in advance. In most situations this is the preferred style as it produces shorter paths. However, in exploratory applications, topological planning is not possible, so a second category known as Dynamic planning or Sensor Based planning is used. Dynamic planning is where little to no data are
known a priori and thus this style can result in substantial back-tracking due to
encountering dead ends [24, 25, 26, 27].
There are many different algorithms which can be used in path planning to meet many different objectives [28, 29]. Some algorithms are very simplistic and designed to find any route through an environment, while some aim to find the perfect path with no consideration of memory size or processor limitations. There are also those in between which make different concessions in order to fit different limitations or desires. An algorithm which tries every combination of points is called a Blind Search and will find a path but can take a long time to run as, “For hard combinatorial problems the search fringe often grows exponentially with the search depth [28].” Heuristic algorithms use one or more predefined criteria to find
2.8. PATH PLANNING ALGORITHMS 31 acceptable solutions to a problem, an example being comparing sizes and placing larger items in a box first when trying to pack [30]. A rela
![Figure 2.1: The OmniTread, an example of an articulated serpentine robot de- de-sign [4].](https://thumb-us.123doks.com/thumbv2/123dok_us/637200.2576774/34.892.291.579.190.443/figure-omnitread-example-articulated-serpentine-robot-sign.webp)
![Figure 2.3: A bipedal research robot used to study human motion, viewed from two angles [5].](https://thumb-us.123doks.com/thumbv2/123dok_us/637200.2576774/36.892.215.654.218.645/figure-bipedal-research-robot-study-motion-viewed-angles.webp)
![Figure 2.6: An example of an articulated-pair shape shifting robot design. The Amoeba-II shown in two states [7].](https://thumb-us.123doks.com/thumbv2/123dok_us/637200.2576774/39.892.245.680.188.428/figure-example-articulated-shape-shifting-design-amoeba-states.webp)
![Figure 2.9: The three arenas of the MeSci competition [14].](https://thumb-us.123doks.com/thumbv2/123dok_us/637200.2576774/46.892.214.656.185.982/figure-arenas-mesci-competition.webp)
![Figure 3.8: Example of Occupancy Grids in use by a wheelchair collision avoid- avoid-ance system approaching an elderly man with a walking frame [44].](https://thumb-us.123doks.com/thumbv2/123dok_us/637200.2576774/91.892.240.681.185.545/figure-example-occupancy-wheelchair-collision-approaching-elderly-walking.webp)
