Management of Aging Aircraft using Deterministic and Probabilistic Metrics
11th Joint NASA/FAA/DOD Conference on Aging Aircraft, Phoenix, April 2008 1/21
Management of Aging Aircraft using Deterministic and
Probabilistic Metrics -
Nagaraja Iyyer1, Subhasis Sarkar1, Robert Merrill1, Scott Bradfield1 and Nam Phan2
Abstract
Aging aircraft can be effectively managed by a combination of deterministic and probabilistic metrics. The deterministic metric provides a damage index for each aircraft relative to the full-scale test. This indexing method based on crack initiation or crack growth, may not be singly sufficient to support fleet management decisions at a time when the fleet is aging. To ensure safety of fleet, a probabilistic metric has to be developed, specifically when there are deviations in operations of the fleet from the full-scale test, when significant findings are observed across fleet aircraft, or when immediate fleet actions such as inspection plans have to be formulated for safety of fleet aircraft. This paper first provides a brief discussion on deterministic metrics and their limitations. The probabilistic metrics are discussed next, specifically paying attention to the single flight probability of failure. In this context, risk analysis and assessment of aging aircraft are discussed in general with focus on engineering and management challenges in carrying out this effort. The engineering challenges emerging from lack of substantial service data and analytical limitations of existing methods are elaborated. The management challenges due to the dynamic nature of calculated risk values, decisions with respect to acceptable levels of risk, immediate fleet actions and future planning are discussed. The paper concludes with a section on promising technologies on the horizon that will provide prognosis capability to make proactive decisions to ensure flight safety. 1. INTRODUCTION
Aging aircraft problems are mainly due to time, usage, and obsolescence factors. Some of the management challenges that face aging aircraft operators are:
• Requirement to keep aging aircraft in service beyond original design goals • Need to ensure age related problems are predicted and mitigated to ensure fleet
safety and minimize risks
• Maintain Inventory and operational readiness requirements • Maximize latest technical advances and minimize cost impact
In order to meet the above management goals, several technical challenges exist as listed below that have to be addressed:
1 Technical Data Analysis, 7600 Leesburg Pike, Suite 204, Falls Church, VA 22043, USA
2 Branch Head, Patrol /Rotary Wing Structures Branch, Structures Division, U. S. Naval Air Systems
Management of Aging Aircraft using Deterministic and Probabilistic Metrics
11th Joint NASA/FAA/DOD Conference on Aging Aircraft, Phoenix, April 2008 2/21 • Where are the cracks going to form? Are analytical tools reliable to predict when and where crack is going to nucleate, will it grow, and if it grows how fast will it grow? Is there a match between analysis predictions and service and test
experience?
• How service cracking data is assessed and monitored in fleet? Are all aircraft operating loads captured and sufficient? Are all fleet actions captured and assessed?
• Are inspection intervals adequate enough to mitigate risks? Do inspections cover all critical areas? Are there some unknown and undetected locations?
• Do we have reliable inspection methods for all problem areas including
inaccessible areas, multiple failure modes? What is the probability of detection? • Are there objective measures of risk? How much credit should be given for
inspection, repair or replacement?
In a philosophical sense, the problems that operators of aging aircraft face can be grasped by reading the following poem ‘The Unknown’ given in a DoD brief by Secretary of Defense Mr. D. Rumsfield [1].
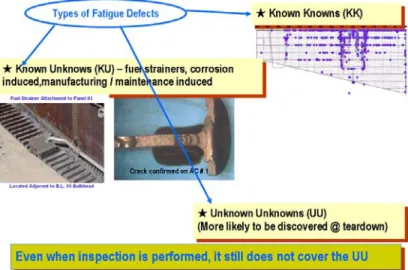
Following the poetic theme in Reference [1], almost all of the aging aircraft problems related to fatigue can be grouped into three categories: known knowns, known unknowns, and unknown unknowns, as illustrated in Figure 1 and discussed further below.
Figure 1. Types of Aging Aircraft Problems
KNOWN KNOWNS: These are known hot spots and critical locations on the aircraft structure as established by vast amounts of service data, and supported by analysis. This is to say that operators are aware and prepared upfront to address these problem areas. The usage of aircraft mainly determines the damage state at these critical locations. However, lifing metrics that quantify damage state at these locations have to be continuously checked and improved since technical challenges still persist in the reconstruction of the experienced load history, availability of reliable analytical tools, and adequacy of fleet inspections and actions.
Management of Aging Aircraft using Deterministic and Probabilistic Metrics
11th Joint NASA/FAA/DOD Conference on Aging Aircraft, Phoenix, April 2008 3/21
Reconstruction of Load History: To reconstruct the actual loading history that aircraft
experienced over several years is a big challenge because of problems with structural data collection including ground maintenance actions such as wing swaps, repairs and refurbishment. The structural data collection process itself will contain gaps either because of faulty recording or transmission errors. In addition uncertainty exists in capturing complete operations and environment loads to construct realistic spectra for analysis.
Reliable Analytical Tools: Even if the loading history is captured with great fidelity, a
baseline standard for damage measurement must exist to derive meaningful metrics. This baseline standard is a full-scale fatigue test with loading spectrum that will define life ceiling limits of the airplane structure. Since full-scale fatigue tests are prohibitively expensive, maximum use is also made of the available component or element tests, which adds to another uncertainty factor in the calculation of life metrics. It is not uncommon to find mismatch between analysis and service findings. These are due to the limitations of the available analytical models and material property used. Constant adjustment or improvement of analytical tools is always needed to determine life metrics for the aging aircraft.
Adequacy of Fleet Inspections and Actions: Fleet inspections data provide the feedback
necessary to manage aging aircraft. However, these fleet inspections have to be properly designed and applied so that majority of the problems are found and addressed. Furthermore, difficulties exist in scheduling inspections, selection of inspection areas and inspection techniques.
KNOWN UNKNOWNS: These type of problems are mainly time dependent in nature that we know are going to happen. Corrosion, stress corrosion cracking, and obsolescence problems fall into this category. Even though the fleet inspection provide an idea of the corrosion problem, it is difficult to predict which part/area is likely to be a problem area in the future. Corrosion problems occur in likely and sometimes unlikely areas. Technical challenges exist in detecting these corrosion problems without complete disassembly, identifying potential likely areas that are hither to unknown and undetected, developing new NDI techniques, and implementing non-scheduled inspections on the fleet.
UNKNOWN UNKNOWNS: This type of problem is probably the most difficult to define as well as the one to solve.Engineers would not want to see this type of problem appear as it may point to areas of limitations and uncertainty in the analysis. This last category of problem area is only identified by a thorough teardown or by accident discoveries. The discovery of these new problem areas may impose unforeseen technical and fleet actions after overcoming the challenge to determine whether the discovery is an anomaly or a pattern in the fleet.
Management of Aging Aircraft using Deterministic and Probabilistic Metrics
11th Joint NASA/FAA/DOD Conference on Aging Aircraft, Phoenix, April 2008 4/21 In order to effectively manage aging aircraft, lifing and program management metrics are needed to help in the decision making process that result in groundings, routine and special inspections, material replacements and repair, flight restrictions involving weight and/or Nz, changes to mission assignments, squadron rotations. The USAF defines metrics per the following ASIP element categories: force structural maintenance plan, inspection procedure, L/ESS, IAT, flaw size data and corrosion data, DADTA, risk analysis, business case analysis and overall engineering process [2]. Each of these elements have three possible conditions indicating level of risk, and is discussed in detail in Reference 2.
These metrics can also be broadly grouped under the following categories: • Maintenance Cost
• Aircraft Availability • Program Management • Flight Safety
Metrics for maintenance cost will provide a picture of escalating costs as the fleet ages. Total ownership costs arising from all fleet actions taken have to be considered in deriving this metric. Aircraft availability metrics relates directly to availability of fleet aircraft to meet mission requirements. The factors that drive this metric are aircraft undergoing repair, in for SDLM, experiencing delays due to long lead time for procuring parts, and downtime directly related to service findings. Program management metric looks into the future in terms of inventory projections, scheduling and implementation of fleet actions considering cost benefit and tradeoff analysis to look at different scenarios. Flight safety metrics ensure the structure is without defects that cause imminent failure. The factors that drive these metrics are basic aircraft usage data, fatigue, fracture, and risk analysis including environmental and in-service damage effects. To ensure flight safety, these types of metrics can be defined to cover basic data, fatigue and fracture analysis, and risk analysis. Metrics associated with fatigue and fracture analysis are deterministic or probabilistic based on the scope of analysis. These flight safety metrics are the focus of this paper and are described subsequently. It is to be emphasized that both deterministic and probabilistic metrics are useful for managing fleet aircraft as learned from P-3C experience [3, 4].
2.1 Metrics Associated with Basic Data
Flight safety metric related to the basic data are with respect to aircraft data collection, data checks and surveys to verify and validate assumptions on flight profiles, mission mixes and operating environment:
• Data collection metric is a measure of book keeping practices associated with logbook, maintenance records, DEK entries along with fleet data collection, storage, and retrieval and transmission activities.
Management of Aging Aircraft using Deterministic and Probabilistic Metrics
11th Joint NASA/FAA/DOD Conference on Aging Aircraft, Phoenix, April 2008 5/21 • Data check metric is a measure of goodness of data collected, which includes data validation and verification activity. Metrics that provide percent data recovery and amount of gap-fill data are examples of data check metric.
• Loads survey metric provides a measure of accuracy of loads and environment assumptions used in engineering analysis for the current operating conditions. Ground and usage survey metrics also help detect flight mission profile changes over time.
2.2 Deterministic Metrics - Fatigue and Fracture Analysis
Deterministic metrics for aging aircraft are based on a benchmark standard, usually derived from full-scale fatigue test. The deterministic techniques as calculated by both fatigue and fracture analysis lead to damage state values which are deterministic and are always pegged to the reference standard. Examples of these types of metrics are the Fatigue Life Expended (FLE) and Total Life Index (TLI) as used in the U.S. Navy’s P-3C fleet [4].
2.2.1 Safe Life Metric, FLE
Deterministic metrics based on safe life approach begins with the establishment of a life measurement standard. This is usually available from an available full scale fatigue test, but a fatigue life standard can also be defined through analysis of fleet service experience and repair information. These standards or reference benchmarks are traditionally developed by analyzing critical locations identified by gross fatigue test failures, non-destructive inspections performed during the fatigue test program, or non-destructive inspection of the fatigue test article after testing concludes. Although fatigue critical locations can be identified from fleet teardown articles, service experience, fleet repair records, and engineering hot spot analyses, a reference fatigue life standard is usually obtained from full-scale or component test. The fatigue damage of a fleet aircraft is always calculated with respect to this fatigue life measurement standard, usually defined as the time to develop a quarter-circular corner crack of radius 0.25 mm in the full-scale fatigue test. Fleet aircraft are monitored and measured against this test standard to assess relative fatigue life expenditures (FLE) using a scatter factor of 2 to account for material fatigue property variability. Figure 2 shows how reference standards are derived and used in individual aircraft tracking (IAT) application to calculate damage against the FSFT standard. More discussion on deriving the FLE metric is given in Reference [4].
Management of Aging Aircraft using Deterministic and Probabilistic Metrics
11th Joint NASA/FAA/DOD Conference on Aging Aircraft, Phoenix, April 2008 6/21 Figure 2: Referencing to full-scale fatigue test and Individual Aircraft Tracking Application
A safe life fleet metric such as FLE allows for superior fleet management, providing more lead time for component sparing requirements, and requiring less inspection and repair equipment on board carrier. However, in some instances the fatigue life of an airframe component is a function of unrecorded usage, or the usage is so variable that the gap fill rate is too penalizing, or the required scatter factor is too large, that a safe life approach is not feasible. Also, operational needs necessitate flying beyond safe life. It is in these instances that a damage tolerance metric could be chosen such as the total life index, TLI. Note that FLE is a valid metric upto crack initiation point, and extending this beyond this ceiling will be erroneous. As Fig. 3 illustrates, there exists a wide variation of crack lengths at FLE values beyond crack initiation life benchmarks of 100% FLE for actual service load histories.
Management of Aging Aircraft using Deterministic and Probabilistic Metrics
11th Joint NASA/FAA/DOD Conference on Aging Aircraft, Phoenix, April 2008 7/21 Fig. 3: Crack Length as a Function of Safe-Life Index for various aircraft
2.2.2 Damage Tolerance Metric, TLI
Although U.S.Navy’s traditionally preferred approach is safe-life, damage indices based on crack growth can be established and these could be used as another guideline specifically where aircraft have exceeded traditional 100% FLE limit and cracking is likely with aging aircraft structures. In general, damage tolerance methods are based on
crack growth control assuming initial cracks in the structure ensuring safety through
inspections. In principle, the damage tolerance approach can be effectively applied only when the structural critical components are designed so that they are accessible for inspections. That is, the design must have accommodated disassembly to provide access to the interior of the skin or fuselage or wing if necessary for inspection.
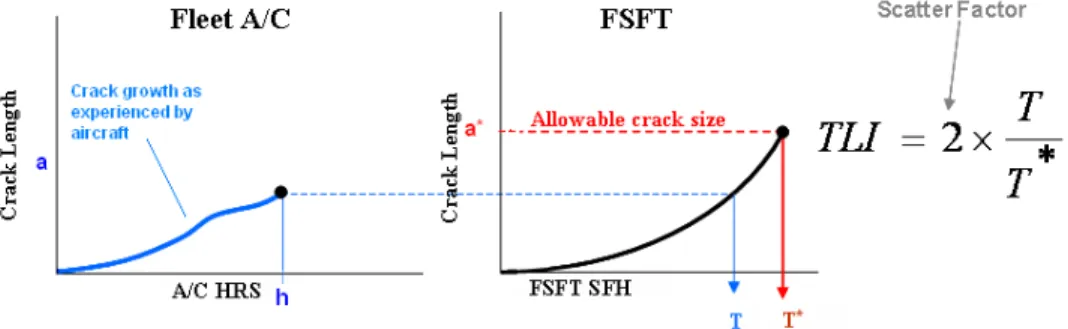
The total life approach as used by the U.S. Navy on P-3C aircraft involves an estimation of aircraft condition based on crack growth. In this approach, crack growth is tracked from a small initial flaw using individual aircraft usage stress history at critical locations. The size of the initial flaw is derived from full-scale fatigue test (FSFT) data, specifically by calculating an equivalent initial flaw size (EIFS) at time zero that would grow to the observed crack size during the test for the applied test stress sequence. Allowable or limiting crack length, a*, at a critical location was appropriately determined from observed crack sizes at test end-point, or when the repair/replacement was done during the test. The full-scale fatigue test hours corresponding to a* length was defined as the limiting test time, T*.
For each aircraft, a crack growth analysis is conducted for the unique usage experienced starting from the initial crack sizes as established from full-scale fatigue test at each critical location. The resulting final crack length value at each location is then mapped to the corresponding full-scale fatigue test curves to obtain the test time (T) when a crack of the same length was observed in the full-scale test. A total life index value, deterministic in nature, was then defined as the ratio T/T* with a scatter factor of 2 for additional safety. A schematic of the total life index (TLI) method is shown in Fig. 4.
Management of Aging Aircraft using Deterministic and Probabilistic Metrics
11th Joint NASA/FAA/DOD Conference on Aging Aircraft, Phoenix, April 2008 8/21 Fig. 4: Schematic of Total Life Index (TLI) Calculation
TLI values provide an assessment of fleet aircraft with respect to the full-scale fatigue test standard in a deterministic way to manage fleet aircraft beyond 100% FLE. This approach provides relative ranking of the fleet, useful for many management actions such as scheduling inspections, repairs and for some other time–bound management actions. Also note that TLI is a damage metric based on test-demonstrated data only and it does not account for service findings.
Note that the scope of these types of analysis can be expanded to capture variability in test demonstrated life, loading history, and geometry and material properties. This expanded scope results in metrics that have a probabilistic component such as confidence level associated with safe-life or damage tolerance metrics. However, the term probabilistic metrics are usually assigned to those metrics derived from risk analysis carried out using service findings.
In summary, the salient features of deterministic life metrics are:
• Pegged to FSFT, ranking of fleet aircraft is with respect to FSFT demonstrated life
• Easier to implement, since go or no go decisions are driven by imposed deterministic limits as the metric shows a continuous positive change over time/usage
• In general, service findings are not captured in derivation of this metric, thus may not adequately cover variations due to manufacturing differences, rogue flaws and in-service damages
2.3 Probabilistic Metrics – Risk Analysis
2.3.1 Design Metrics
Risk analyses are first performed during the design stage of aircraft with assumed service usage, and other uncertainties associated with material property and geometry parameters. Examples of risk analysis metrics calculated at this stage are design target risks, DTR [5] and to some extent the widely used damage tolerance rating system, and metrics as calculated in FAA’s SAIFE program [6]. These metrics define the risk of a
Management of Aging Aircraft using Deterministic and Probabilistic Metrics
11th Joint NASA/FAA/DOD Conference on Aging Aircraft, Phoenix, April 2008 9/21 component failure at the end of design life. Usually, if the risk is less than accepted level then the component design is accepted and incorporated into manufacturing.
2.3.2 In-Service Metric - Single Flight Probability of Failure (PoF)
More important probabilistic metric, however, is the in-service probabilistic metric that provides the risk of failure of a component during service. This metric is calculated using all available service data to-date to calculate to risk of failure in the next operating cycle. Instantaneous probability of failure in the next flight, PoF, is such an in-service risk metric. This PoF metric, which provides the degree of risk of structural/component failure, is discussed next along with engineering and management challenges in deriving and using these metrics for effective fleet management.
Calculation of PoF at select critical locations at any instant involves estimating at that instant the distributions of crack length, residual strength and load exceedances. Note that crack growth is very sensitive to initial crack size assumption, stress level, sequence besides material property and geometry variables. Therefore, the factors that affect PoF calculation are: (a) initial fatigue quality at the critical location as manifested by the equivalent initial flaw size (EIFS) distributions, (b) final crack distribution as experienced load history, environmental and crack growth and material property variability effects and (c) residual strength capability, (d) load or stress distribution function that describes the probability of exceeding a given stress value in a flight, and (e) fleet actions including inspections, repairs, and material replacement.
Given the crack size distribution and load (stress) exceedance probability, PoF values are estimated as the probability of an aircraft reaching a specific defined damage condition (crack lengths, Pa), combined with the probability of achieving a specific load condition, R, which will cause catastrophic failure. Since crack and stress distributions are assumed to be independent, the integration of the joint probability of crack and stress states over the point set determines PoF. References 7-12 discusses methods and applications of risk assessment techniques to quantify risk for aircraft structures.
PoF is the result of numerical solution of the classic load-strength interface problem involving a convolution integral of load and strength density functions. In the crack domain, PoF is obtained by multiplying the probability pc(c)of a crack of a certain size
by the failure probability pfc(c)at that crack size and summing contributions over all possible crack sizes. In the load domain, the method of obtaining the PoF is a natural complement to the crack domain approach. Here the probability of stress pσ(σ)of a certain level is multiplied by the failure probability pfσ(σ)at that stress level and the contributions are summed over all ranges of stress levels. PoF calculation in this second method is performed in load-domain, as the integration is over the load. PoF calcuations from both approaches will yield the same result. Figure 5 shows a schematic of the PoF calculations in the crack domain.
Management of Aging Aircraft using Deterministic and Probabilistic Metrics
11th Joint NASA/FAA/DOD Conference on Aging Aircraft, Phoenix, April 2008 10/21 Fig. 5: Schematic of PoF calculation - Integration in Crack Domain
The computation scheme for PoF is very straight forward given these inputs, however, the inputs have to be carefully generated. The challenges that exist in preparing these input data as learned from P-3C experience is discussed in the following.
Management of Aging Aircraft using Deterministic and Probabilistic Metrics
11th Joint NASA/FAA/DOD Conference on Aging Aircraft, Phoenix, April 2008 11/21
2.3.2.1 EIFS Distributions
The initial fatigue quality, as manifested by the EIFS distribution, at the location of interest is the main variable for the PoF analysis. Note that EIFS value must be regarded as a fictitious value which is not correlated with any real defects in the material. Further, the EIFS value is specific to the loading history, material and geometry of the surrogate location chosen and for the crack growth model used in analysis.
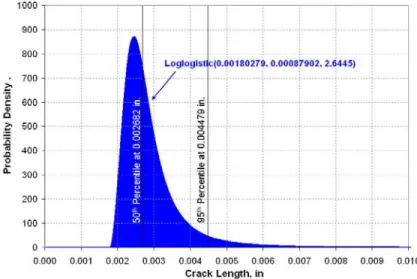
The EIFS distribution can be constructed by ‘regressing’ service fatigue cracks [4]. These service cracks, however, have to be filtered only to select only those fatigue cracks of importance leaving out all corrosion, mechanical damage, mis-oriented and span-wise cracks. Cracks of length less than 0.05 in may be excluded from regression because of limitations of crack growth model arising out of (a) validity of ∆Kth value for very small cracks and (b) calculated EIFS size may be too small where micro or small crack effects are greatly expected and thus crack growth calculations have to be questioned. An example of EIFS distribution constructed from lower wing skin panels of P-3C aircraft is shown in Figure 6.
Fig 6. Example EIFS Distribution for Lower Wing Panel
Notice that EIFS distribution is dynamic in nature, indicating possible change in EIFS distributions in future. Therefore, they need to be checked periodically when more inspection data are available from service. Continued fleet inspections and expanding inspection coverage will redefine the EIFS distribution.
Defining rogue flaw and tail probabilities in the EIFS distribution are very important as they drive the PoF. Engineering challenges exist to determine appropriate statistical distributions that will define extreme tail probabilities since the behavior of statistical
Management of Aging Aircraft using Deterministic and Probabilistic Metrics
11th Joint NASA/FAA/DOD Conference on Aging Aircraft, Phoenix, April 2008 12/21 functions at extreme values must be fully understood before using in actual PoF calculations.
Note that EIFS distributions are constructed from data from inspected aircraft. This does not guarantee that un-inspected aircraft at lower risk. We may have to assume that same EIFS distributions apply for un-inspected aircraft until proven otherwise by inspection, as large cracks may still exist in un-inspected aircraft. In addition, note that EIFS distributions constructed via ‘regression’ technique is also dependent upon the reliability service data available fleet aircraft.
Given that EIFS distribution are constructed using only cracks > 0.05 in, non-findings (no cracks or cracks <0.05 in) have to be accounted for in the final calculated PoF value. This may be done by factoring the calculated PoF value by the proportion of large cracks in the inspection data. Calculated PoF value may further be credited for inspections with the knowledge of the number of holes inspected in the zone and confidence level in inspection.
2.3.2.2 Final Crack Distributions
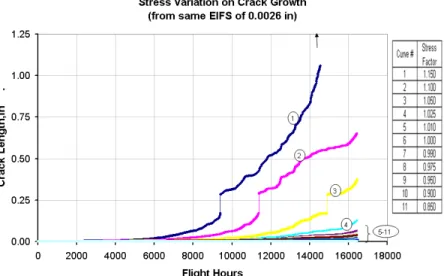
The load (stress) history as obtained from an Individual Aircraft Tracking (IAT) program that uses measured data from on-board recorder has to be utilized to determine the final crack state from the initial EIFS distributions. It is important to recognize the importance of this stress time history data as this drives the crack state and hence the PoF. Figure 7 illustrates one such dramatic effect of stress variation on crack growth.
Figure 7. Stress Variation on Crack Growth from the same EIFS
Therefore, reducing recorder errors and data collection errors are significant action items to construct realistic load history. It is ideal if the load history is obtained from an
Management of Aging Aircraft using Deterministic and Probabilistic Metrics
11th Joint NASA/FAA/DOD Conference on Aging Aircraft, Phoenix, April 2008 13/21 individual aircraft tracking program so that the composition and sequence of loads are preserved accurately.
Crack growth runs have to be made to get final crack states for the initial EIFS distribution. Contribution from environment effects to crack growth can be included if the initial EIFS distribution is not adequate to capture these factors. The crack growth and material property parameters can also be varied to get a complete distribution of final crack state. Note that the final crack state values are also limited by the accuracy of the crack growth model for all types of load histories.
To simplify the problem, however, material property and geometry parameters can be treated as invariants to allow a quick look into the relative risk states of fleet aircraft. The final crack lengths can be calculated for every possible flaw in the EIFS distribution. For efficiency, however, one could follow an approach of dividing the EIFS into bins and carrying out crack growth runs from midpoint crack lengths of each bin. As discovered in P-3C the bin density need to be varied, however, with denser bins towards the extreme larger crack lengths since PoF is affected only by the crack length probabilities of the extremes of the distribution.
2.3.2.3 Residual Strength Capability
Residual strength capability of the structure at location of interest is a function of crack state and fracture toughness value at the location of interest. Residual strength curves need to be constructed from the geometry factors appropriate to the crack geometry, pin load transfer, edge effects and other factors that influence local stress along with the variability of fracture toughness value appropriate to the thickness and material wrought form.
2.3.2.4 Probability of Stress Exceedances per Flight
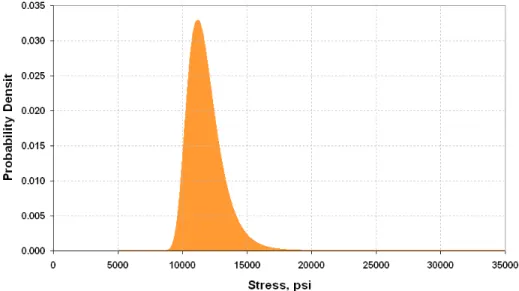
Probability of stress exceedance per flight is the other main variable in PoF analysis. The probability of stress exceedance per flight is derived from the stress exceedance information from past experience. The past experience is the only best indicator of how aircraft are going to fly in the future and future stress exceedance probabilities. There is no guarantee, however, that aircraft will fly per expectations since mission and squadron changes, combat situations and other non foreseen events may change the probability. Again, past experience data must be constructed from data in the immediate past, say last 2-3 years as it is more representative of the way the aircraft flies in the current situations. Even this interval of time may not be enough to get remote stress exceedance probabilities, and these should be included from historical data to calculate stress exceedance probabilities using binominal function or Lincoln’s method [10]. Once the stress exceedance probabilities are determined, an extreme value distribution can be fitted to this data to obtain probabilities at wide range of stress values including those of highly unusual stress events.
Management of Aging Aircraft using Deterministic and Probabilistic Metrics
11th Joint NASA/FAA/DOD Conference on Aging Aircraft, Phoenix, April 2008 14/21 The question of whether using projected stress exceedance probabilities from past data is adequate or not can only be ascertained by periodically comparing the projected stress exceedance probabilities with the actual service usage data. It should be noted that probability of stress exceedances per flight must be established using a large fleet dataset as small datasets can not characterize stress probabilities accurately. Figure 8 shows an example extreme value distribution of stress exceedance probability per flight.
Figure 8: Example Distribution of Stress Exceedance Per Flight
Again, note that the distribution of probability of stress exceedance per flight is also dynamic in nature. It is also limited by the accuracy of available exceedance data that determines the load distribution. Most challenging task is to estimate the stress exceedance probability at infrequent stress levels. Furthermore, the stress exceedance data constructed using the IAT data may not always account for failing load or structural variation between aircraft.
2.3.2.5 Fleet Actions
Fleet actions such as inspections, material replacement, wing swaps, fatigue enhancements, and repair have to be accounted for the in the PoF analysis. These effects could be considered during the PoF analysis if all data is available. In the case of wing swaps, complete history of the wing is first assembled from several aircraft where it was previously installed and then used to calculate the final crack distributions at the surrogate locations. Similarly, if the material replacement is carried out which will affect a critical location, only pertinent part of the history is to be considered for analysis.
Management of Aging Aircraft using Deterministic and Probabilistic Metrics
11th Joint NASA/FAA/DOD Conference on Aging Aircraft, Phoenix, April 2008 15/21 Accounting for repair of a single critical detail is normally done by assuming repair probability of crack distribution after repair is carried out. Similarly, the crack distribution after inspection is assumed based on the type of inspection and probability of detection POD [13-15].
PoD for any NDI technique is derived by inspecting certain samples with different flaw sizes and statistically assessing the number of hit/miss events. Current PoD research focuses on detecting small cracks, however, the risk of failure is due to the miss of large cracks. Also notice that current PoD estimates significantly vary as the ability to detect small cracks increases, thus altering the PoM of large cracks. This is not to say that current PoD research is in error, however, the point is probability of missing large cracks in real environment can not be obtained from these type of experiments.
Thus probability of miss (PoM) is a significant factor for risk analysis. The traditional way to think PoM as a complementary function of PoD (PoM = 1-PoD) holds good in a
mathematical sense for the confined experimental dataset. However, the probability of missing a large crack in real service environment may never be determined from a set of empirical set of experiments designed to capture PoD of an inspection technique. These experiments have limitations because of sample size and may not provide coverage of all possible cracking scenarios. Besides, there is great uncertainty to quantify human factors under service environment.
Since the longest crack missed is the sole driver of PoF, the PoM has to be derived from service data including accident and other extraneous events as they provide a realistic picture of PoM in the real operating environment. Thus the focus of PoM should be on long cracks, especially for quantifying the probability of failure.
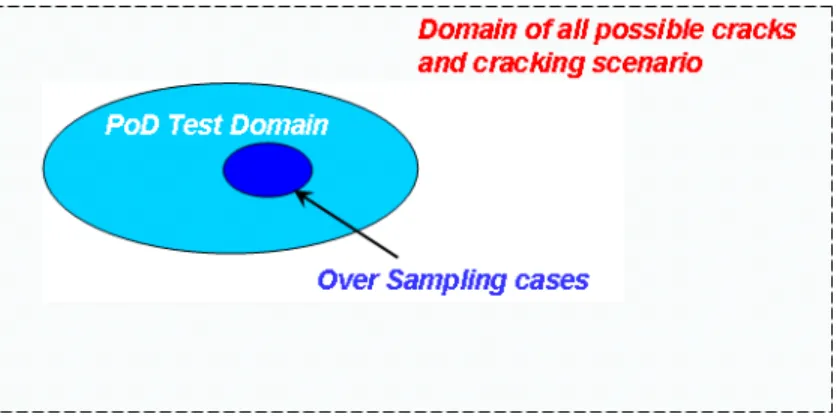
Figure 8 illustrates that domain of all cracks is much larger than the experiments can ever capture. In fact, the PoD test domain is only a small set of the universal crack domain, and in many instances the PoD domain has many cases of over sampling on a smaller subset.
Figure 9: PoD and Universal Domain of Cracks 3. MANAGEMENT CHALLENGES IN DECISION MAKING
Management of Aging Aircraft using Deterministic and Probabilistic Metrics
11th Joint NASA/FAA/DOD Conference on Aging Aircraft, Phoenix, April 2008 16/21 Risk analysis and assessment will consolidate calculated risk values into groups and prioritize risk based on fleet needs. The grouping could be done at different levels such as squadrons, aircraft value, operational usage, and age. Aggregate risk values can be calculated for all of these groupings, and combined into one fleet aggregate value. The aggregate risk may cover one or more critical locations.
The decision making with the risk begins with prioritized risk list. The four options that can be chosen to deal with risk as applied to aircraft structural integrity are transfer, eliminate, accept or mitigate risk. Transfer risk is an option and it is practiced in commercial domain when aircraft are sold to other interested parties willing to take on the additional maintenance and associated risk. Eliminating the risk is through retirement of the aircraft or procurement of new structure or substantial material replacement. Mitigating risk is carried out through fleet actions such as inspections with local material replacement or fatigue enhancement features, restricted flying, fleet rotations, limiting gross weights, limited mission operations, planned deployments, etc. The last option is to accept the risk and continue fleet operations. This decision making process is driven by fleet inventory and mission readiness requirements and the criteria for acceptable level of risk.
3.1 Acceptable Level of Risk
Using right transformation between time and flights, acceptable risk values in either basis could be calculated, but, in general, aircraft operators use single flight probability of failure to denote risk values of aircraft structures. Use of single flight probability of failure as a safety metric is also supported by the rapidly increasing risk of failure for every flight flown towards the end of service life because of accumulated damage. Besides the individual aircraft risk, fleet aggregate risk is also used as a safety metric to manage fleet. Acceptable levels of risk are thus defined for individual and fleet aggregate single flight probability of failure. Guidelines have been since developed [12] that provide acceptable levels of risk, the basis for this probability seems to come from the fact the expected number of failures in service on a given platform would be less than one.
If target acceptable level of risk is defined as ε, then it is desired that calculated PoF is less than or equal to ε. However, it should be noted that risk values are not objective or absolute values since all factors affecting risk can not be considered in any method. Therefore, calculated risk values must be grouped by a granulation scheme to fit into a system safety risk analysis matrix to help in decision making process. It may also be convenient to define a safety index values defined in a suitable way so that risk decisions can be communicated easily at all levels of management. One example of a suitable safety index, ω, that can be defined is ω = Ф-1(PoF), where Ф is the standard normal cumulative density function. This implies that for safe operations, calculated safety index value ω ≤ωε, where ωε = Ф-1(ε).
Management of Aging Aircraft using Deterministic and Probabilistic Metrics
11th Joint NASA/FAA/DOD Conference on Aging Aircraft, Phoenix, April 2008 17/21
3. 2 Dynamic Nature of PoF
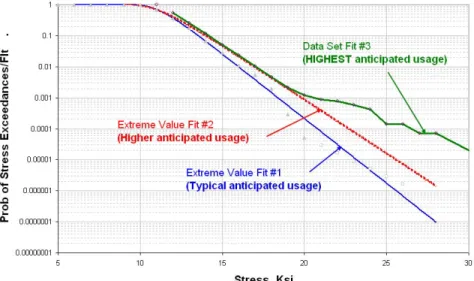
PoF is dependent on the probability of distribution of cracks and the probability of stress exceedanace per flight. The probability distribution of cracks on a given aircraft at a given location is governed by the assumed EIFS distribution and the stress history experienced by that aircraft at that location. Therefore, for a given crack distribution state, the PoF is dependent upon the anticipated stress exceedance probabilities. Calculated PoF is thus a dynamic value because this is computed from joint probability of damage (crack) state and stress exceedance probabilities. Increased damage state should not be confused with increased risk at all times because risk is a joint probability value. Even though the damage or crack state continuously increases over time, the projected stress exceedance probabilities may increase or decrease depending upon how the fleet aircraft are currently being used. For a given damage state, the risk can be very high if the stress exceedance probabilities are projected to be higher. On the other hand, the risk can be very low if stress exceedance probabilities are projected to be lower. Figure 10 shows a typical probability of stress exceedance for different scenarios, showing a typical, aggressive and extremely aggressive usage. For a given crack state, the PoF values will thus be dependent upon which usage is used in the calculations.
For example, an aircraft adhering to imposed flight restrictions, which is a typical fleet action on aging aircraft, will have a lower risk than when the same aircraft is deployed overseas in combat or in rigorous training exercises. Since each aircraft is used differently in different time periods, the PoF should be calculated, in principle, using the projected stress exceedance probabilities for each aircraft using its own immediate past data. However, since probabilities can only be determined accurately from large datasets, use of average fleet stress exceedance probabilities may be sufficient for most cases. For those aircraft operated more aggressively as indicated by the past usage data, it may be better to calculate PoF using an upper bound of stress exceedance probabilities.
Management of Aging Aircraft using Deterministic and Probabilistic Metrics
11th Joint NASA/FAA/DOD Conference on Aging Aircraft, Phoenix, April 2008 18/21
3.3 Risk Projections
Note that optimum condition exists in the fleet if c x PoF i = ∂ ∂( )
, where xi are variables affecting PoF and c is a constant. This implies PoF is changing in a linear way with
respect to changes in variables. If this is the case, then projection can easily be made on PoF. However, in reality this is not the case as PoF is non-linearly related to its variables. Expressed mathematically, ( ) p( i) i x f x PoF = ∂ ∂
. What this implies is that an acceptable PoF value at any time does not provide any insight into whether it is approaching a phenomenon or regime (such as ligament break) that would provide a big jump in calculated PoF.
Risk projections into future can be made for an assumed usage. However, projected risk values should be treated only as estimates since these are based on assumed usage. By keeping the assumed usage and per flight stress exceedance probabilities as constant over a period of time, say a 6 month period, PoF values in the future can be calculated at every 6 month interval. In this instance, the PoF values continuously increase because of continuous increase in damage state and constant stress exceedance probabilities. This scenario can be compared with situations where there is a constant or increasing risk rate over time. In these situations, the projected damage state in these into the future is entirely dependent upon the spectrum content in the assumed usage because crack growth is influenced by over-loads and under-loads because of retardation and acceleration effects. For example, if the assumed usage spectrum contains an overload causing significant retardation effects, projected crack growth will then be punctuated with this retardation behavior every period thus showing reduced damage state and, therefore reduced PoF values. For this reason, projected risk values must be used very judiciously in fleet management.
3.4. Risk Validation and Control
Validation of risk analysis and assessment begins with the analysis of management actions taken and current status of each prioritized risk. Feedback from the fleet in regard to inspection findings, especially from high risk aircraft, and continuous tracking of fleet aircraft will refine and validate assumptions made in the risk analysis. Fleet actions have to be initiated for timely and efficient collection of usage data since correct representation of the load history and fleet operations provide more accurate picture of the damage status and risk values. Additional fleet actions to gather specific service data to support risk assessment studies in the form fleet inspections, destructive assessment of stricken aircraft must be undertaken to validate the risk analysis. The nature of widespread fatigue cracking poses significant challenges to plan inspections and studies must be performed to address this issue. If the status of risk should change or mitigating action
Management of Aging Aircraft using Deterministic and Probabilistic Metrics
11th Joint NASA/FAA/DOD Conference on Aging Aircraft, Phoenix, April 2008 19/21 does not produce the intended effect, investigations should be carried out to determine causes and corrective actions taken.
4. THE WAY FORWARD
Close monitoring of fleet aircraft and constant feedback from fleet are thus necessary to reduce risk and ensure safety of aging fleet aircraft. Current inspection methods and control mechanisms are mostly reactive approaches, actions that are normally taken in response to certain fleet finding or scenario experienced. Inspection intervals may not be adequate enough to provide an accurate damage status of fleet aircraft at any given point in time because of many unknown factors that degrade the structural condition. Thus, there is a need for a true prognosis capability for damage prediction and real-time feedback of damage status from the fleet aircraft not only in P-3C but in all other platforms as well.
As observed in aging P-3C fleet, there is a need for airframe prognosis capability as demands continue in other aircraft platforms as well as go beyond traditional life ceilings set by safe-life or total life approaches. The Navy’s Prognosis is defined as a two-fold process [16]. First there is a model that forecasts structural reliability for given flight hour intervals. Second there must be a feedback capability to ensure the model’s fidelity and robustness as the model assesses structural reliability with each subsequent flight hour interval. The feedback is a Bayesian updating loop in which the evidence comes from sensors rather than hard inspections. The U.S. Navy is pursuing the concept of a sensor suite, Airborne Acoustic Integrity Monitoring Systems(AAIMS) [17] as the needed Bayesian updating evidence.
5. CONCLUSIONS
Metrics to manage aging aircraft are classified as deterministic or probabilistic depending upon the scope of analysis. Deterministic metrics are usually defined with respect to a reference full-scale fatigue test standard. Safe life metric such as FLE and damage tolerance metric such as TLI can be used as effective deterministic metrics to manage aging fleet aircraft. Probabilistic metrics are closely tied to risk analysis and several engineering challenges exist in defining this metric. Engineering challenges exist in constructing EIFS distribution, probability of stress exceedance per flight and residual strength distributions. Management challenges exist is using these probabilistic metric because of the dynamic nature of input variables used in calculating this metric as well making decisions with respect to acceptable levels of risk, immediate fleet actions and future planning. Promising technologies are on the horizon that will provide prognosis capability to make proactive condition based inspections in the fleet to ensure safety of aging fleet aircraft.
Management of Aging Aircraft using Deterministic and Probabilistic Metrics
11th Joint NASA/FAA/DOD Conference on Aging Aircraft, Phoenix, April 2008 20/21 Authors acknowledge Mr. Trung Nguyen, Mr. James Candela Dr. Jennifer Claus, and Dr. Paul Hoffman for their continuous support and valuable comments and suggestions throughout this study.
REFERENCES
[1] D. Rumsfield, Feb. 12, 2002, Department of Defense news briefing
[2]Gallagher, J.P. “A Review of Philosophies, Processes, Methods and Approaches that
Protect In-Service Aircraft from the Scourge of Fatigue Failures”, Plantema Memorial Lecture, 30th International Committee on Aeronautical Fatigue Conference, 24th ICAF Symposium, Naples, Italy, May 2007
[3] Iyyer N, Sarkar S, Merrill R, and Phan N. Managing Aging Aircraft using Risk Assessment Models- Lessons Learned from P-3C Fleet, 24th International Conference on Aeronautical Fatigue, Naples, Italy, May 2007
[4] Iyyer N, Sarkar S, Merrill R, and Phan N. Aircraft Life Management Using Crack Initiation and Crack Growth Models - P-3C Aircraft Experience. International Journal of Fatigue, Volume 29 (2007), pp 1584-1607.
[5] Millwater HJ, et. al. A Probabilistically-based Damage Tolerance Analysis Computer Program for Hard Alpha Defects in Titanium Rotors Presented at USAF Aircraft Structural Integrity Program Conference, San Antonio, Texas, 1999
[6] Dinkeloo CJ, Moran MS. Structural Area Inspection Frequency Evaluation (SAIFE) Volume V Program Demonstration. Technical Report FAA-RD-78-29, U.S. Department of Transportation, Federal Aviation Administration, 1978.
[7] Gallagher JP, Babbish CA, Malas JC. Damage Tolerant Risk Analysis Techniques for Evaluating the Structural Integrity of Aircraft Structures. Proceedings of the 11th Int. Conference on Fracture, Turin, Italy; 20-25 March 2005
[8] Berens AP, Hovey PW, Loomis JS. Update of the PROF computer program for Aging Aircraft Risk Analysis, Volume 1-Modifications and User’s Guide. Air Force Research Laboratory, Wright-Patterson Air Force Base, Ohio; November 1998.
[9] Babbish CA, Alford RE, Thomsen ML. Probabilistic Approach To Support the Force Management Decision Making Process. Proceedings of the USAF Aircraft Structural Integrity Program Conference, Savannah, Georgia, December 2003.
[10] Lincoln JW. Risk Assessment of Aging Military Aircraft. Proceedings of the First Joint DOD/FAA/NASA Conference on Aging Aircraft, Ogden, Utah; July 1997.
Management of Aging Aircraft using Deterministic and Probabilistic Metrics
11th Joint NASA/FAA/DOD Conference on Aging Aircraft, Phoenix, April 2008 21/21 [11] Tong YC. Literature Review on Structural Risk and Reliability Analysis. Aeronautical and Maritime Research Laboratory, Report # DSTO-TR-1110, Melbourne, Australia. February 2001.
[12] Babbish C, Alford R, and Thomsen M. Probabilistic Approach to Support Force Management Decision Making Process, 2003 ASIP Conference, Savannah, Georgia, 2003.
[13] Gallagher JP, Butkus LM, Brausch JC, Babish CA, Malas JC, and Berens AP “Demonstrating the Effectiveness of an Inspection System to Detect Cracks in Safety of Flight Structure” 2006 Aging Aircraft Conference Paper, 2006
[14] Thompson BR, Brasche L, Knopp J, and Malas J. Use of physics-based models of inspection processes to assist in determining probability of detection. Proceedings of 9th Joint FAA/DoD/NASA Conference on Aging Aircraft, Atlanta. 2006
[15] Bode MD, Spencer FW, Piotrowski, D. Analytical issues in determining probability of Detection. Proceedings of 9th Joint FAA/DoD/NASA Conference on Aging Aircraft, Atlanta. 2006
[16] Hoffman P. Bayesian Based Quantitative Risk Assessment. Presented at P-3 ASIWG Meeting, Andenes, Norway, June 2006
[17] Structural Integrity Monitoring - Acoustic Airframe Integrity Monitoring System (AAIMS), http://www.ultracontrols.aero/Products/pdf/15_crackdetection.pdf, July 2007.