Re-Estimating the Size of the Polar Bear Population in Western Hudson Bay
N.J. LUNN,1 I. STIRLING,2 D. ANDRIASHEK3 and G.B. KOLENOSKY4
(Received 31 July 1996; accepted in revised form 20 May 1997)
ABSTRACT. A mark-recapture study of polar bears (Ursus maritimus) ashore during the ice-free period of Hudson Bay was undertaken in 1994 and 1995 to re-estimate the size of the western Hudson Bay population. Previous estimates were based on animals caught between the Churchill and Nelson Rivers; consequently, bears in the southern part of the geographic range of this population were not sampled. We used Jolly-Seber models to re-estimate population size from two data sets: bears handled between the Churchill and Nelson Rivers from 1984 to 1995 and bears handled between Churchill and the Manitoba-Ontario border from 1984 to 1995. The latter sample incorporated mark-recapture data collected along the eastern Manitoba coast by the Ontario Ministry of Natural Resources from 1984 to 1986 and by us in 1994 and 1995. Both data sets gave similar estimates. Thus, our best estimate of the size of the western Hudson Bay polar bear population is 1200 ± 250 animals in autumn 1995. Key words: population estimates, population models, polar bear, Ursus maritimus, Manitoba, Ontario
RÉSUMÉ. En 1994 et 1995, on a entrepris une étude sur la reprise d’ours polaires (Ursus maritimus)étiquetés sur la terre ferme durant la période libre de glace dans la baie d’Hudson, en vue d’établir une nouvelle estimation de la taille de la population dans la partie ouest de cette baie. Les estimations précédentes s’appuyaient sur le nombre d’animaux pris entre les fleuves Churchill et Nelson; par conséquent, les ours situés dans la partie méridionale de l’étendue géographique de cette population n’ont pas fait l’objet d’un échantillonnage. On s’est servi de modèles Jolly-Seber pour établir une nouvelle estimation de la taille de la population à partir de deux ensembles de données: des ours marqués entre le Churchill et le Nelson de 1984 à 1995, et des ours marqués entre le Churchill et la frontière Manitoba-Ontario de 1984 à 1995. Ces derniers prélèvements renfermaient des données sur la reprise d’ours étiquetés effectuée de 1984 à 1996 par le ministre ontarien des Ressources naturelles le long de la côte est du Manitoba, et par nous-mêmes en 1994 et 1995. Les deux ensembles de données fournissaient des estimations similaires. Ainsi, pour l’automne 1995, notre estimation la plus précise de la taille de la population de l’ours polaire dans l’ouest de la baie d’Hudson est de 1200 ± 250 individus.
Mots clés: estimations de population, modèles de population, ours polaire, Ursus maritimus, Manitoba, Ontario Traduit pour la revue Arctic par Nésida Loyer.
1Department of Biological Sciences, University of Alberta, Edmonton, Alberta T6G 2E9, Canada; present address: Canadian Wildlife
Service, 5320 - 122 Street, Edmonton, Alberta T6H 3S5, Canada; nick.lunn@ec.gc.ca
2Canadian Wildlife Service, 5320 - 122 Street, Edmonton, Alberta T6H 3S5 and Department of Biological Sciences, University of
Alberta, Edmonton, Alberta T6G 2E9, Canada
3Canadian Wildlife Service, 5320 - 122 Street, Edmonton, Alberta T6H 3S5, Canada
4Wildlife Research Section, Ontario Ministry of Natural Resources, Box 5000, Maple, Ontario L6A 1S9, Canada; present address: 3790
Cavin Road, RR3, Duncan, British Columbia V9L 2X1, Canada © Arctic Institute of North America
INTRODUCTION
Largely on the basis of mark and recapture data, the popula-tion of polar bears (Ursus maritimus) in western Hudson Bay (Fig. 1) has been defined as being distributed between ap-proximately the Manitoba-Ontario border to the south and Rankin Inlet to the north (Stirling et al., 1977; Prevett and Kolenosky, 1982; Derocher and Stirling, 1990; Kolenosky et al., 1992). Derocher and Stirling (1995) estimated the mean population size for 1978 – 92 at 1000 ± 51 animals on the basis of mark-recapture studies conducted between the Churchill and Nelson Rivers during the ice-free period. They relied on the assumption that all bears within the population were equally and randomly mixed. However, these data have also indicated that polar bears showed some degree of geographic
fidelity to specific summering areas within the overall study area (Derocher and Stirling, 1990). In addition, a limited survey in 1971 (Jonkel et al., 1972) and recent incidental reports have suggested that some maternity denning occurred east of the Nelson River in the vicinity of Cape Tatnam and thus was not accounted for in previous studies. As the mark-recapture program had not covered the portion of the southern range east of the Nelson River, the population estimate of 1000 ± 51 animals was considered conservative. Conse-quently, the population was assumed to be 1200 animals for management purposes (Calvert et al., 1995; Wiig et al., 1995). Polar bears from this population are hunted by Inuit from three communities (Arviat, Whale Cove, and Rankin Inlet) along the Keewatin coast of the Northwest Territories, and a variable number of animals are taken annually in Manitoba as
Nelson River and the Manitoba-Ontario border (Cape Tatnam study area) (e.g., Prevett and Kolenosky, 1982; Kolenosky et al., 1992). Although the population boundary extends north of Churchill to Rankin Inlet, bears are largely absent from this area during the ice-free period (Derocher and Stirling, 1990), which is probably a consequence of the pattern of sea ice break-up on Hudson Bay each summer.
Hudson Bay is normally completely covered by annual ice from December through April, with maximum coverage occurring by the end of April (Danielson, 1971; Markham, 1986; Prinsenberg, 1986b; Etkin, 1991). The ice cover begins to decay towards the end of May as areas of open water form in southern James Bay and in northwestern Hudson Bay. During June and July, the ice decays rapidly; open water expands northward along the eastern coast of Hudson Bay and southward along the western coast (Danielson, 1971; Markham, 1986; Etkin, 1991). As a consequence of this pattern of breakup and the counterclockwise flow of water in the bay (Prinsenberg, 1986a), the remnant ice tends to become iso-lated in southwestern Hudson Bay off the Manitoba and Ontario coasts (Markham, 1986). By early August, Hudson Bay is essentially ice-free. Ice starts to form in northern Hudson Bay in late October. During November, the ice cover spreads rapidly southward in the western portion of Hudson Bay. In most years, the entire bay is ice-covered by mid-December (Danielson, 1971; Markham, 1986; Prinsenberg, 1986b).
METHODS Timing of Field Work
Field work was conducted during the spring (late February to mid-March) and autumn (late August to mid-September) of 1994 and 1995 in both the Churchill and Cape Tatnam study areas.
Immobilization and Handling of Polar Bears
The capture effort was distributed as evenly as possible in the study areas. Polar bears were located from a Bell 206B Jetranger helicopter and immobilized with Telazol, using standard chemical immobilization techniques (Stirling et al., 1989). Each animal had a unique identification number permanently tattooed on the inside of each upper lip and a numbered plastic tag placed in each ear.
The age of each bear handled was determined by one of two methods. If the bear was a cub-of-the-year or had previ-ously been handled as a cub-of-the-year, then it was of known age. However, if the bear was of unknown age, then a single vestigial premolar was extracted. Age was subsequently estimated by histological sectioning and staining of these teeth and counting the total number of annuli within the cementum layer using methods described by Thomas and Bandy (1973) and modified by Stirling et al. (1977). Each annulus was assumed to represent one year, and all bears were assumed to have been born on 1 January.
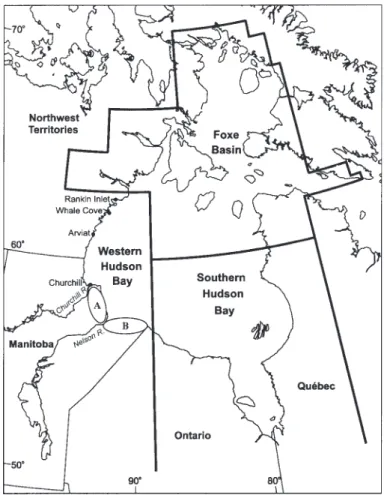
FIG. 1. Hudson Bay, showing the boundaries between the western Hudson Bay, southern Hudson Bay, and Foxe Basin polar bear populations and the two study areas, (A) the Churchill study area, between the Churchill and the Nelson Rivers, and (B) the Cape Tatnam study area, between the Nelson River and the Manitoba-Ontario border.
part of the bear control program at Churchill. Current man-agement allows for a total annual harvest of 55 polar bears which is based on the assumed population of 1200 animals and a sex ratio in the kill of 2 males to 1 female (Calvert et al., 1995; Derocher and Stirling, 1995).
In 1994, we initiated a study to re-estimate the size of the polar bear population in western Hudson Bay. The first objective was to expand the mark-recapture program to sample animals between Churchill and the Manitoba-Ontario border; the second, to determine whether there is evidence of a significant number of females denning between the Nelson River and the Manitoba-Ontario border. Such evidence would indicate that the annual productivity of this population is higher than currently thought.
STUDY AREA
We studied polar bears in Manitoba in an area bounded by 56˚10'N to 58˚50'N and 89˚00'W to 94˚10'W (Fig. 1). Although the bears north of the Nelson River (Churchill study area) have been well studied (e.g., Stirling et al., 1977; Ramsay and Stirling, 1988; Derocher and Stirling, 1992), there has been much less research on polar bears between the
From this age determination, each bear was placed into one of the following age classes: Cub-of-the-year: less than 1 year of age, accompanied by an adult female; yearling cub: between 1 and 2 years of age, accompanied by an adult female; lone yearling: single bear between 1 and 2 years of age; two-year-old cub: between 2 and 3 years of age, accom-panied by an adult female; subadult: single bear between 2 and 4 years of age; adult: any bear 5 years of age or older. Estimation of Population Size
The size of the western Hudson Bay population was estimated using the Jolly-Seber model of constant survival and variable capture probability (Seber, 1982; Derocher and Stirling, 1995). The capture data were analyzed using the program JOLLY (Pollock et al., 1990). Males and females were analyzed separately because of sex-specific segregation and sex-related differences in vulnerability to capture and harvest (Derocher and Stirling, 1990, 1995). Cubs-of-the-year were excluded from the analyses, because their survival was dependent upon the survival of their mothers (Derocher and Stirling, 1995). In the Jolly-Seber model used, survival was assumed to be constant over the period of study and was estimated from the mark-recapture analyses as part of the program JOLLY. Recruitment of cubs-of-the-year into the population was estimated by multiplying the female popula-tion size by the number of cubs per female that was calculated from the capture sample (Derocher and Stirling, 1995).
Goodness-of-fit of the model to the data was assessed by a contingency table chi-square test (Pollock et al., 1990) that examined observed and expected capture histories. The test, which examines for heterogeneous capture probabilities, is part of the program JOLLY.
For comparative purposes, we estimated the size of the population from two data sets: all bears handled in the combined Churchill and Cape Tatnam study areas (i.e., between Churchill and the Manitoba-Ontario border), and a subset of bears that were handled only in the Churchill study area. We set the starting year for this analysis to 1984, the year that Kolenosky et al. (1992) initiated a three-year mark-recapture study along the Ontario and eastern Manitoba coasts, because this was the first year in which sampling took place throughout the combined study area.
RESULTS AND DISCUSSION Numbers of Polar Bears Handled
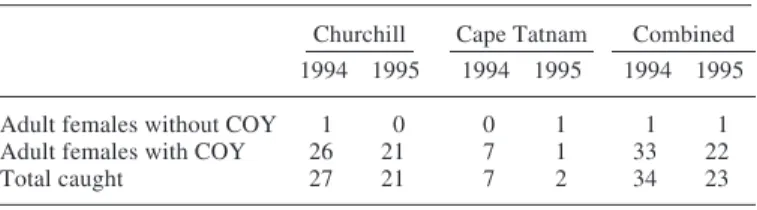
We handled 33 family groups in the spring of 1994 and 22 in 1995, as well as one solitary adult female in each year (Table 1). Although one-third of our search effort (26/78.6 hours) and surveys up to 100 km inland were flown in the Cape Tatnam study area, we found no evidence there of a concentrated denning area. Only 15% (8/55) of all family groups encountered were found in this study area. Neverthe-less, it is clear that denning does occur, albeit at low density,
TABLE 1. Number of adult female polar bears that were caught with or without cubs-of-the-year (COY) in the Churchill and Cape Tatnam study areas during the spring of 1994 and 1995.
Churchill Cape Tatnam Combined 1994 1995 1994 1995 1994 1995 Adult females without COY 1 0 0 1 1 1 Adult females with COY 26 21 7 1 33 22
Total caught 27 21 7 2 34 23
because we caught eight females accompanied by cubs-of-the-year. These family groups were travelling towards the coast at the time of their capture. Although we tried to follow their tracks back inland, we were unable to locate any dens because wind and snow had erased all but the most recent footprints. In 1971, a partial survey inland from Cape Tatnam revealed that at least 16 females had produced cubs in this area (Jonkel et al., 1972).
In the Cape Tatnam study area, in the autumn of both 1994 and 1995, we found polar bears of all sex and age classes almost exclusively along the coast (108 of 115 bears seen), despite extensive searching of inland areas. This contrasted markedly to the distribution of bears handled in the Churchill study area, where adult males tended to remain along the coast but pregnant females and females accompanied by cubs moved up to 80 km inland during the ice-free period (Derocher and Stirling, 1990). Although not known, differ-ences in inland habitat may partially explain the observed onshore distribution of polar bears in the Churchill and Cape Tatnam study areas. In the Churchill study area, bears found inland were typically located at the edge of patches of lichen or in habitat that was raised and well drained, whereas those found along the coast tended to be on sandy or gravel ridges (Derocher and Stirling, 1990; this study). These locations suggest that polar bears avoid wet areas while ashore. The inland area of the Cape Tatnam study area is generally flat and wet and offered little in the way of habitat on which bears could keep relatively dry. The relative absence of bears in this area (7 of 115 bears seen) suggests that most may have remained along the coast.
Between 1984 and 1986, 457 polar bears were tagged from the adjacent southern Hudson Bay population that spends the ice-free period along the coast of Ontario and on the islands in Hudson and James Bays (Kolenosky et al., 1992). During 1994 and 1995, we caught a combined total of 207 animals in the Churchill and Cape Tatnam study areas that had been alive during that previous study. Of those 207, 80% (165) had been previously tagged, but only 4% (6) of the tagged bears originated from the southern Hudson Bay population. The remaining 96% (159) were from the western Hudson Bay population. Only one of the six animals from the southern Hudson Bay population was caught north of the Nelson River. In addition, of 44 previously tagged bears that we caught in the Cape Tatnam study area (i.e., immediately adjacent to the southern Hudson Bay population) that had been alive during 1984 – 86, 89% (39) and 11% (5) were from
the western Hudson Bay and southern Hudson Bay populations, respectively. Thus, there was little evidence of exchange of animals between the two populations. Similar conclusions about the discreteness of these two populations have been reported previously (Stirling and Ramsay, 1986; Derocher and Stirling, 1990; Kolenosky et al., 1992). Population Estimate
Both data sets gave similar estimates for the size of the female (Table 2) and male (Table 3) populations in autumn 1995. For both data sets, the Jolly-Seber model indicated no significant departure of the observed capture histories from the expected capture histories for female bears (combined data set, χ2 = 38.8, d.f. = 32, p > 0.15; Churchill data set, χ2 = 38.9, d.f. = 30, p > 0.10). The survival rate of females
was 0.880 ± 0.017 for the combined data set and 0.890 ± 0.018 for the Churchill data set. Both rates are in agreement with the survival estimate of 0.900 ± 0.012 reported by Derocher and Stirling (1995) for this population up to 1992.
Data for male polar bears did not fit the Jolly-Seber model as well as the female data (combined data set, χ2 = 76.9,
d.f. = 34, p < 0.001; Churchill data set, χ2 = 76.1, d.f. = 33,
p < 0.001). Derocher and Stirling (1995), who also reported that the male data set was a poor fit, suggested several reasons why this might be so. First, it may be due to the introduction of an age-specific survival bias into the mark-recapture estimates, because the harvest of polar bears in western Hudson Bay is sex-biased towards males and centred on younger animals (Derocher, 1991; Derocher and Stirling, 1992). Therefore, the assumption that every animal has the same probability of surviving from one capture period to the next may have been violated. Second, they noted that the estimate of population size and the fit of the Jolly-Seber model are affected by emigration (Pollock et al., 1990). Although permanent emigration to neighbouring populations is thought to be uncommon (Derocher and Stirling, 1990), Derocher and Stirling (1995) were unable to assess the effect of temporary emigration. It undoubtedly occurs, but we were unable to quantify to what degree. The survival rate of males was 0.860 ± 0.016 and 0.859 ± 0.019 for the combined and Churchill data sets, respectively. Both rates were higher than the 0.839 ± 0.011 previously reported by Derocher and Stirling (1995).
Including recruitment of cubs (Table 4), the estimate of total population size in autumn 1995 was 1199 ± 251 (95%
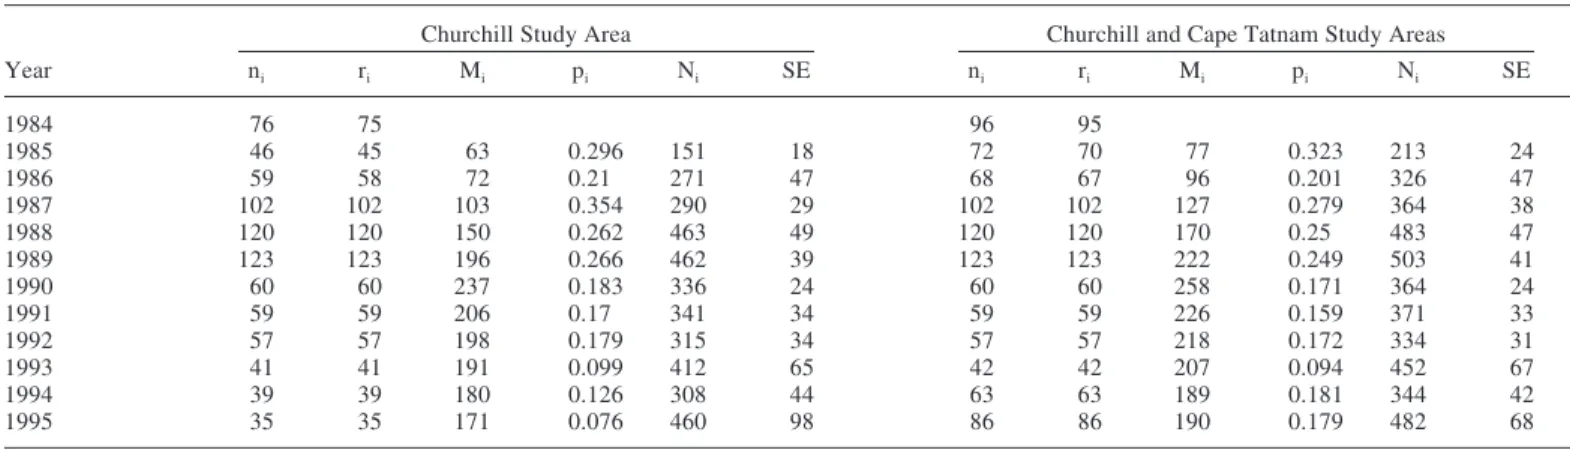
TABLE 3. Number of male polar bears (≥1 yr old) captured (ni) and released (ri) in western Hudson Bay, 1984 – 95, and estimates of the
number of males available for recapture (Mi), capture probability (pi), and population size (Ni), using the Jolly-Seber model of constant
survival and variable capture probability.
Churchill Study Area Churchill and Cape Tatnam Study Areas
Year ni ri Mi pi Ni SE ni ri Mi pi Ni SE 1984 76 75 96 95 1985 46 45 63 0.296 151 18 72 70 77 0.323 213 24 1986 59 58 72 0.21 271 47 68 67 96 0.201 326 47 1987 102 102 103 0.354 290 29 102 102 127 0.279 364 38 1988 120 120 150 0.262 463 49 120 120 170 0.25 483 47 1989 123 123 196 0.266 462 39 123 123 222 0.249 503 41 1990 60 60 237 0.183 336 24 60 60 258 0.171 364 24 1991 59 59 206 0.17 341 34 59 59 226 0.159 371 33 1992 57 57 198 0.179 315 34 57 57 218 0.172 334 31 1993 41 41 191 0.099 412 65 42 42 207 0.094 452 67 1994 39 39 180 0.126 308 44 63 63 189 0.181 344 42 1995 35 35 171 0.076 460 98 86 86 190 0.179 482 68
TABLE 2. Number of female polar bears (≥1 yr old) captured (ni) and released (ri) in western Hudson Bay, 1984 – 95, and estimates of the
number of females available for recapture (Mi), capture probability (pi), and population size (Ni), using the Jolly-Seber model of constant
survival and variable capture probability.
Churchill Study Area Churchill and Cape Tatnam Study Areas
Year ni ri Mi pi Ni SE ni ri Mi pi Ni SE 1984 49 47 62 59 1985 35 34 41 0.048 707 461 45 44 51 0.097 454 173 1986 45 45 58 0.109 406 126 53 53 69 0.128 405 101 1987 136 136 86 0.266 507 78 136 136 95 0.23 582 92 1988 144 142 178 0.267 530 49 144 142 188 0.258 549 50 1989 135 135 250 0.213 640 56 135 135 257 0.212 643 55 1990 79 79 298 0.158 507 39 79 79 303 0.157 513 39 1991 62 62 299 0.138 458 38 62 62 300 0.139 459 37 1992 74 74 287 0.169 447 42 74 74 287 0.172 444 40 1993 54 54 273 0.133 409 45 54 54 268 0.136 400 42 1994 45 45 261 0.109 418 54 64 64 260 0.12 542 74 1995 46 46 245 0.09 512 83 58 58 249 0.108 535 79
TABLE 4. Estimates of annual autumn recruitment of polar bears in western Hudson Bay, 1985 – 95.
Churchill Study Area Churchill and Cape Tatnam Study Areas
Year N SE N SE 1985 332 241 210 98 1986 145 62 145 53 1987 263 53 301 61 1988 175 36 182 37 1989 193 40 184 38 1990 260 50 263 51 1991 229 50 230 50 1992 161 38 160 37 1993 205 48 200 46 1994 222 58 328 74 1995 227 70 216 62
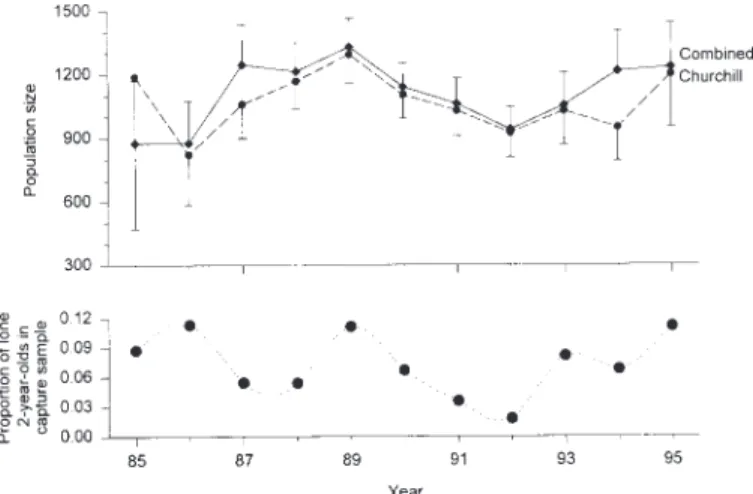
FIG. 2. Estimates of the size of the western Hudson Bay polar bear population from mark-recapture data collected in the Churchill study area and in the combined Churchill and Cape Tatnam study areas in relation to the proportion of lone two-year-old animals in the capture sample. Vertical bars represent ± 1 SE of N.
confidence interval, 707 – 1691) from the Churchill study area data set and 1233 ± 209 (823 – 1643) from the combined Churchill and Cape Tatnam study area data sets. One expla-nation for the agreement between the estimates is that the entire population was well mixed while ashore during the summer, and therefore all bears had an equal—or at least similar—probability of capture. Alternatively, because the entire area was not sampled every year, the Jolly-Seber model may not have been able to estimate the population adequately over the larger study area (i.e., from Churchill to the Mani-toba-Ontario border) in all years. Thus, estimation of model parameters may have been influenced primarily by the mark-recapture effort in the Churchill study area, resulting in similar estimates (Fig. 2).
To obtain a population estimate that was independent of a possible confounding influence from the 1987 – 93 capture effort, we used a Lincoln-Petersen model (Seber, 1982), applied to the mark- recapture data collected in the Churchill and Cape Tatnam study areas in 1994 and 1995. However, it is important to note that the Lincoln-Petersen model was designed for closed populations which assume that no birth or immigration, no death or emigration, and no loss of marks occurs between capture samples. In addition, such models assume that both marked and unmarked animals are equally vulnerable to capture, and that there is no differential survival of marked individuals. Thus, there are clear problems and limitations in applying a closed population model to mark-recapture data from an open population. However, for the data we collected in 1994 and 1995, some of the assumptions of the Lincoln-Peterson model were met. First, cubs were not included in either sample, so effectively there were no births. Second, tagged bears that are harvested are routinely re-ported; thus, any tagged bear that died between capture samples (n = 5) was treated as being marked in the first capture sample but not released. Third, because all marked bears are given a unique tattoo on the inside of each upper lip, we were certain of the identity of all bears handled at the time of second capture (i.e., no marks were lost). Fourth, we are unaware of any evidence that suggests that marked and unmarked bears are not equally vulnerable to capture. Fi-nally, permanent emigration to and permanent immigration
from neighbouring populations appears to be uncommon (Derocher and Stirling, 1990). Thus, only two assumptions of the closed population model may have been violated: tempo-rary emigration/immigration (we cannot assess this, but it is likely to be negligible) and equal survivorship of all marks (juvenile bears have lower rates of survival than adult bears, Derocher and Stirling, 1995). While recognizing the above limitations, the Lincoln-Peterson model estimated the size of the population to be 1249 ± 274 animals, which was similar to the Jolly-Seber estimates.
Although there was no clear trend in population estimate over time, it was interesting to note that the proportion of lone two-year-old polar bears in the capture samples tended to track fluctuations in the population estimate from the Churchill study area data, especially after 1986 (Fig. 2). However, there was no significant correlation when the relationship was considered over the entire period (Pearson product-moment correlation, Churchill study area, r = 0.392, d.f. = 9, p = 0.233; Combined data, r = 0.127, d.f. = 9, p =0.710). Although juvenile survival is lower than that of adults (Derocher and Stirling, 1995), the data on lone two-year-old bears suggest that high juvenile survivorship of particular cohorts may occur; which, in turn, leads to increased estimates of popula-tion size.
The high proportion of lone two-year-old bears in 1986, 1989, and 1995, relative to other years, suggests that cubs born in 1984, 1987, and 1993 may be part of particularly strong cohorts, although detailed cohort analysis is beyond the scope of this paper. We do not know what factors may have contributed to higher juvenile survival in all strong cohort years, but the apparent increased survival of bears born in 1993 may have been influenced by the eruption of Mount Pinatubo in June 1991. This eruption released a large amount of particulate matter into the atmosphere, which resulted in significant climatic cooling over the Northern Hemisphere (McCormick et al., 1995). In Hudson Bay, the break-up of sea ice was delayed by about three weeks in the summer of 1992
(Environment Canada, 1992a, b), and a strong relationship between severe ice conditions in Hudson Bay and major volcanic eruptions has been documented (Catchpole and Hanuta, 1989). Stirling and Derocher (1993) noted that bears came ashore three weeks later in 1992 than in 1991 and speculated that polar bears remain on the sea ice, hunting seals, for as long as possible. The bears that came ashore in 1992 were heavier and presumably in better condition, and natality increased in 1993 (Stirling and Lunn, 1997). Al-though the temperature in 1993 was not as cold as in 1992, it was still cooler than normal (McCormick et al., 1995); the condition of adult females did not decline to pre-1992 levels, and natality remained high into 1994 (Stirling and Lunn, 1997). Thus, the 1993 cohort was weaned during a period when their mothers were in better condition than females in other years and when bears had access to seals for a longer period of time, which probably increased survival of their cubs. In summary, our best estimate of the size of the polar bear population in western Hudson Bay, in autumn 1995, was 1200 ± 250 animals. We found no evidence to suggest that many pregnant females denned in the area between the Nelson River and the Manitoba-Ontario border. Thus, there is no evidence that annual productivity of this population is significantly higher than currently thought.
ACKNOWLEDGEMENTS
We thank the following for their support of this research: the Nunavut Wildlife Management Board, the Canadian Wildlife Service, the Manitoba Department of Natural Resources, Malden Mills, and Parks Canada. Additional financial support was provided by a Killam Post-Doctoral Fellowship to N.J. Lunn. We are grateful to the Ontario Ministry of Natural Resources, especially Marty Obbard and Howard Smith, for providing sightings of females with cubs during the Ontario Ministry’s spring aerial denning surveys. For their assistance at various stages of the study, we thank S. Miller, L. Brouzes, W. Calvert, C. Elliott, D. Hedman, C. Paddock, and C. Spencer. S. Barry provided statistical advice. A. Derocher, M. Ramsay, and two anonymous reviewers provided constructive criticism of earlier drafts.
REFERENCES
CALVERT, W., TAYLOR, M., STIRLING, I., KOLENOSKY, G.B., KEARNEY, S., CRÊTE, M., and LUTTICH, S. 1995. Polar bear management in Canada 1988-92. In: Wiig, Ø., Born, E.W., and Garner, G.W., eds. Polar Bears: Proceedings of the Eleventh Working Meeting of the IUCN/SSC Polar Bear Specialist Group. IUCN Publications Services Unit, 219c Huntingdon Road, Cambridge CB3 0DL, United Kingdom. Gland, Switzerland and Cambridge, United Kingdom: International Union for the Conservation of Nature and Natural Resources. 61 – 79.
CATCHPOLE, A.J.W., and HANUTA, I. 1989. Severe summer ice in Hudson Strait and Hudson Bay following major volcanic
eruptions, 1751-1889 A.D. Climatic Change 14:61 – 80. DANIELSON, E.W., Jr. 1971. Hudson Bay ice conditions. Arctic
24:90 – 107.
DEROCHER, A.E. 1991. Population dynamics and ecology of polar bears in western Hudson Bay. Ph.D. thesis. University of Alberta, Edmonton.
DEROCHER, A.E., and STIRLING, I. 1990. Distribution of polar bears (Ursus maritimus) during the ice-free period in western Hudson Bay. Canadian Journal of Zoology 68:1395 – 1403. DEROCHER, A.E., and STIRLING, I. 1992. The population
dynamics of polar bears in western Hudson Bay. In: McCullough, D.R., and Barrett, R.H., eds. Wildlife 2001: Populations. London: Elsevier Applied Science. 1150–1159.
DEROCHER, A.E., and STIRLING, I. 1995. Estimation of polar bear population size and survival in western Hudson Bay. The Journal of Wildlife Management 59:215 – 221.
ENVIRONMENT CANADA. 1992a. Seasonal outlook, northern Canadian waters, summer 1992. Ottawa: Ice Centre, Atmospheric Environment Service. 23 p.
———. 1992b. Weekly and monthly Hudson Bay regional ice charts. Ottawa: Ice Centre, Atmospheric Environment Service. ETKIN, D.A. 1991. Break-up in Hudson Bay: Its sensitivity to air temperatures and implications for climate warming. Climatological Bulletin 25:21 – 34.
JONKEL, C., KOLENOSKY, G.B., ROBERTSON, R.J., and RUSSELL, R.H. 1972. Further notes on polar bear denning habits. International Conference on Bear Research and Management 2:142 – 158.
KOLENOSKY, G.B., ABRAHAM, K.F., and GREENWOOD, C.J. 1992. Polar bears of southern Hudson Bay. Polar Bear Project, 1984 – 88, Final Report. Maple, Ontario: Ontario Ministry of Natural Resources. 107 p.
MARKHAM, W.E. 1986. The ice cover. In: Martini, I.P., ed. Canadian inland seas. Amsterdam: Elsevier Science Publishers B.V. 101 – 116.
McCORMICK, M.P., THOMASON, L.W., and TREPTE, C.R. 1995. Atmospheric effects of the Mt Pinatubo eruption. Nature 373:399 – 404.
POLLOCK, K.H., NICHOLS, J.D., BROWNIE, C., and HINES, J.E. 1990. Statistical inference for capture-recapture experiments. Wildlife Monographs 107. 97 p.
PREVETT, J.P., and KOLENOSKY, G.B. 1982. The status of polar bears in Ontario. Le Naturaliste Canadien (Revue d’Écologie et de Systématique) 109:933 – 939.
PRINSENBERG, S.J. 1986a. The circulation pattern and current structure of Hudson Bay. In: Martini, I.P., ed. Canadian inland seas. Amsterdam: Elsevier Science Publishers B.V. 187 – 204. ———. 1986b. Salinity and temperature distributions of Hudson Bay and James Bay. In: Martini, I.P., ed. Canadian inland seas. Amsterdam: Elsevier Science Publishers B.V. 163–186. RAMSAY, M.A., and STIRLING, I. 1988. Reproductive biology
and ecology of female polar bears (Ursus maritimus). Journal of Zoology, London 214:601 – 634.
SEBER, G.A.F. 1982. The estimation of animal abundance and related parameters. 2nd ed. London: Charles Griffen & Company Ltd. 654 p.
STIRLING, I., and DEROCHER, A.E. 1993. Possible impacts of climatic warming on polar bears. Arctic 46:240 – 245. STIRLING, I., and LUNN, N.J. 1997. Environmental fluctuations
in arctic marine ecosystems as reflected by variability in reproduction of polar bears and ringed seals. In: Woodin, S.J., and Marquiss, M., eds. Ecology of arctic environments. Special Publication No. 13 of the British Ecological Society. Oxford: Blackwell Science Ltd. 167 – 181.
STIRLING, I., and RAMSAY, M.A. 1986. Polar bears in Hudson Bay and Foxe Basin: Present knowledge and research opportunities. In: Martini, I.P., ed. Canadian inland seas. Amsterdam: Elsevier Science Publishers B.V. 341– 354. STIRLING, I., JONKEL, C., SMITH, P., ROBERTSON, R., and
CROSS, D. 1977. The ecology of the polar bear (Ursus maritimus) along the western coast of Hudson Bay. Canadian Wildlife Service Occasional Paper 33. 64 p.
STIRLING, I., SPENCER, C., and ANDRIASHEK, D. 1989. Immobilization of polar bears (Ursus maritimus) with Telazol® in the Canadian Arctic. Journal of Wildlife Diseases 25:159– 168.
THOMAS, D.C., and BANDY, P.J. 1973. Age determination of wild black-tailed deer from dental annulations. The Journal of Wildlife Management 37:232 – 235.
WIIG, Ø., BORN, E.W., and GARNER, G.W., eds. 1995. Polar Bears: Proceedings of the Eleventh Working Meeting of the IUCN/SSC Polar Bear Specialist Group. IUCN Publications Services Unit, 219c Huntingdon Road, Cambridge CB3 0DL, United Kingdom. Gland, Switzerland and Cambridge, United Kingdom: International Union for the Conservation of Nature and Natural Resources. 192 p.