Ri
s
k
s
har
i
ng
and
por
t
f
ol
i
o
al
l
ocat
i
on
i
n
EMU
Yul
i
ya
Demyanyk,
Char
l
ot
t
e
Os
t
er
gaar
d
and
Bent
E.
Sør
ens
en
Economi
c
Paper
s
334|
Jul
y
2008
EUROPEAN
Economic Papers are written by the Staff of the Directorate-General for Economic and Financial Affairs, or by experts working in association with them. The Papers are intended to increase awareness of the technical work being done by staff and to seek comments and suggestions for further analysis. The views expressed are the author’s alone and do not necessarily correspond to those of the European Commission. Comments and enquiries should be addressed to:
European Commission
Directorate-General for Economic and Financial Affairs Publications
B-1049 Brussels Belgium
E-mail: [email protected]
This paper exists in English only and can be downloaded from the website
http://ec.europa.eu/economy_finance/publications
A great deal of additional information is available on the Internet. It can be accessed through the Europa server (http://europa.eu )
ISBN 978-92-79-08259-7 doi 10.2765/85145
Risk Sharing and Portfolio Allocation in EMU
∗Yuliya Demyanyk Federal Reserve Bank
of St. Louis
Charlotte Ostergaard Norwegian School of Management
and Norges Bank Bent E. Sørensen
University of Houston and CEPR June 2008
Abstract
This paper investigates whether risk sharing, measured as income and consumption smoothing, among countries in the EU and the European Economic and Monetary Union (EMU) has increased since the adoption of the euro. We ask: Have the recent increase in foreign equity and debt holdings been associated with more risk sharing? Do certain classes of assets (debt, equity, foreign direct investment) provide relatively more or less risk sharing? Do liabilities provide risk sharing differently from assets? Do investments in EMU countries provide more or less risk sharing per euro invested compared to investments in non-EMU countries? Has increased banking integration improved risk sharing? Due to the short span of years since the introduction of the euro, our results are tentative, but they indicate that the monetary union has facilitated risk sharing, although the level of risk sharing is still much below the level found among U.S. states.
∗This study was conducted with financial support from the European Commission, contract
ECFIN/263/2007/477567. We thank Marie Donnay for comments and advice. The views expressed herein are solely those of the authors and do not necessarily reflect the views of Norges Bank, the Federal Reserve Bank of St. Louis or the Federal Reserve System.
Executive Summary
This paper investigates whether risk sharing in Europe has increased since the adoption of the euro. We consider the effect on risk sharing of diversified financial ownership for both EMU countries and EU countries outside the monetary union.
Diversified financial ownership may lead to better risk sharing if the income flows from foreign asset holdings help separate a country’s income growth rate from the growth rate of its output, so-called “income risk sharing.” If a country can issue any kind of assets that makes its income proportional to aggregate EMU output, perfect risk sharing among EMU members will have been accomplished. In principle, this could be achieved by issuing liabilities that transfer the right to domestic output to foreign investors, while using the proceeds to purchase rights to aggregate EMU output.
While perfect income risk sharing is unlikely to be achieved, a country may achieve a high degree of risk sharing if the return on foreign assets is highly correlated with EMU output growth and the return on foreign liabilities is highly correlated with domestic output growth. Such correlations would help smooth a country’s income relative to its output and the level of income risk sharing would be roughly proportional to the quantities of foreign assets held and liabilities issued. We therefore consider the effect of EMU countries’ portfolio diversification on risk sharing.
We measure the amount of “consumption risk sharing” obtained beyond income risk sharing, that is, the degree to which the growth rate in consumption is detached from output growth. Consumption risk sharing is determined by income risk sharing and by patterns of saving. Simplified, one may think of the way people share risk as a situation where people first attempt to insure their income as much as possible by holding a diversified portfolio, and conditional on income, decide how much to further smooth consumption by adjusting saving.
We also consider the effect of banking market integration on risk sharing. Banks may affect risk sharing through their lending behavior and hence banking integration may work as a channel of risk sharing in addition to that of financial asset ownership. Both domestic and foreign banking consolidation may be associated with improved risk sharing and we consider the effect of both.
Our empirical results are as follows. We document that overall income risk sharing has been higher in the five years following the introduction of the euro than during the previous five year period, and that the improvement has been higher for the group of EMU members. In the same period, however, overall consumption risk sharing has decreased,
except among EMU members. Our results imply that financial integration between the EMU countries, and financial globalization in general, has facilitated the smoothing of income. We suggest that temporary shifts in consumption in response to, e.g., taste shocks or increased availability of credit, are responsible for the dis-smoothing of consumption.
We further show that international portfolio diversification has increased for both EU and EMU members. We find evidence that increased holdings of foreign assets have been associated with increased income risk sharing. The estimates are somewhat imprecise which may reflect that significant international integration of asset markets is very recent and still on-going. The effect of diversification on risk sharing is approximately similar whether one considers assets held against foreign residents (domestic assets) or foreigners’ assets holdings against domestic residents (domestic liabilities). Our results show, however, that assets and liabilities invested outside the EMU have the largest effect on risk sharing per euro invested, which indicates that such securities may have returns that are less correlated with the output of the EMU countries and therefore better able to smooth income. Increasing international asset holdings have been correlated with declining consumption risk sharing. We believe that these are transitory patterns due to, for example, simultaneously high consumption growth and improved availability of credit in some countries.
Finally, we investigate the effect of banking market integration on risk sharing. In-come risk sharing has improved following domestic banking consolidation when we focus on country-specific trends in consolidation. However, the countries with a higher average level of banking consolidation do not on average obtain more risk sharing. We do not find any evidence of a similar effect from foreign banking consolidation, but we believe that too little foreign consolidation has yet occurred that one may identify such an effect.
Overall, our results leave little doubt that the process of financial integration among EMU countries has been associated with beneficial welfare effects, in particular in the form of improved smoothing of income. Financial integration, however, is progressing only slowly and the overall level of integration is still lagging behind the level of integration between U.S. states where cross-state investment and securities holdings are much more pervasive.
1
Introduction
Financial markets in the European Union (EU) are becoming better integrated following regulatory convergence and the removal of legal barriers. One advantage of financial inte-gration is that capital-scarce countries may receive funds from countries with higher saving, resulting in higher growth in the capital scarce countries and better returns to saving in countries with high saving. A second, increasingly recognized, advantage of financial in-tegration is that diversified financial ownership promotes risk sharing. Diversification of income sources is, of course, at the core of financial economics; however, the effect on
con-sumption volatility has only recently been researched.1 Obstfeld and Taylor (2004) refer to
the growth and risk sharing benefits of financial integration as “development finance” and “diversification finance,” respectively, and point out that developed countries have obtained large increases in diversification finance in later years.
We examine whether the advent of the euro has led to better international asset diver-sification among countries in the Economic and Monetary Union (EMU). In our analysis, we also consider EU countries which are not in the EMU—if the euro has deepened liquid-ity in financial markets and lowered transaction costs, this might have benefitted financial integration also for non-EMU countries.
The first part of this article examines if risk sharing has increased since the creation of the EMU and analyzes the connection between the amount of cross-border asset holdings and risk sharing. Sørensen, et al. (2007) find that larger holdings of foreign assets are associated with better risk sharing for countries in the EU and the OECD. For EU countries, they also find a trend in risk sharing that is not explained by foreign asset holdings. We suspect this trend is explained by features of financial integration that work through other channels than equity and bond markets. Bank intermediated finance is a likely candidate for such a channel. Several EU-initiatives with the aim of furthering integration of European banking markets have been launched both prior to and during the period we consider. In the second part of the article, we therefore study whether integration of EU banking markets help explain increasing risk sharing. We proceed in a manner similar to recent work by Demyanyk, Ostergaard, and Sørensen (2007) who find that risk sharing between U.S. states improved significantly following various types of banking deregulation—even
branching deregulationwithinstates had a significant impact on risk sharing. We consider
the impact of both foreign bank entry and domestic bank consolidation.
1Early papers are Mace (1991), Obstfeld (1994), and Asdrubali, Sørensen, and Yosha (1996), who study
Our work has relevance for current EU policies and regulations because the welfare benefits of increased international asset holdings depend partly on how effectively finan-cial diversification may insure income and consumption against adverse output shocks. It therefore has implications for initiatives aimed at removing regulations that limit the diver-sification of asset ownership of households, firms, and financial intermediaries. For example, restrictions on pension fund management such as minimum holdings of certain asset classes or limitations on assets with relatively risky returns may be detrimental to the extent that they limit households’ ability to share risk. The conclusions from the banking integration analysis have implications for the current debate over the benefits and drawbacks of foreign bank ownership and banking consolidation.
2
Risk sharing: Income smoothing and consumption
smooth-ing
The situation where consumption growth rates in all countries in a group, such as the EMU, are identical is denoted “full (or perfect) consumption risk sharing.” This will be an equilibrium allocation if consumers have identical Constant Relative Risk Aversion utility functions and access to a complete set of Arrow-Debreu markets—see Obstfeld and Rogoff
(1996) for a textbook treatment of risk sharing.2
The simple characterization of the equilibrium allocation makes it obvious that the exis-tence of a full set of Arrow-securities is not necessary for reaching the optimal consumption
allocation.3 If a country can issue any kind of asset that makes its income proportional to
aggregate output, perfect risk sharing will have been accomplished. In a textbook world this could be achieved by issuing liabilities that transfer the right to aggregate domestic output to foreign investors, while using the proceed to purchase rights to aggregate (EMU) output. Robert Shiller (1998), in his book “Macro Markets Creating Institutions for Man-aging Society’s Largest Economic Risks,” suggests that countries establish markets in such output-linked assets; however, such assets do not currently exist.
In the national accounts, “income” of a country, Gross National Income (GNI), equals
2The implication of the model is that consumption in each country is a constant share of aggregate
consumption, but the empirical literature, following Mace (1991), typically test the implication that growth rates should be identical.
3Adding physical investment to the model leads to the result that each country consumes a constant
fraction of aggregate consumption rather than aggregate output, see Obstfeld and Rogoff (1996), and this is the prediction that is usually tested. If a labor-leisure choice is added to the model consumption growth rates will not be exactly identical but they are likely to be very similar; see Backus, Kydland, and Kehoe (1992).
“output,” Gross Domestic Product (GDP), plus income from investments in foreign countries
minus payments on liabilities while consumption roughly equals income minus saving.4
Consider the identity:
GNI = GDP + Net Factor Income. (1)
If Net Factor Income equals the country’s share in aggregate EMU output growth minus
growth in domestic output, the perfect risk sharing allocation will be obtained.5 We may
split foreign assets into three broad types: Debt (bonds or bank loans), equity, and direct investment (FDI). We can write
Net Factor Income = rdebt,DBD−rdebt,FBF+reqt,DED−reqt,FEF
+ rf di,DFDID−rf di,FFDIF , (2)
where B is holdings of debt, E is equity, and FDI is foreign direct investment. r denotes the
realized rates of return on debt, equity, and FDI, respectively, as indicated by the first part
of the subscript. Subscript “F” denotes investments in the relevant country by foreigners
(i.e., liabilities) and “D” denotes foreign assets held by domestic residents.
Typically, high risk sharing will be achieved if the return on foreign assets is highly correlated with EMU output growth and the return on foreign liabilities is highly correlated with domestic output growth. The logic is that income will be smoothed if payments on foreign liabilities are high when output growth is high and if income from foreign assets is high when domestic output growth is low. The latter is often hard to achieve but as long as payments from liabilities are tied more closely to domestic output than income from
foreign assets, income with be smoother than output. If therates of returnof international
assets have such beneficial correlations, then the amount of risk sharing obtained will be
proportional (roughly speaking) to thequantitiesof foreign assets and liabilities held. Good
measures of realized rates of returns on foreign assets are not easily available but we will
4In the national accounts,
GNI equals GDP (the value of domestic production) plus net factor income
from the rest of the world. Net factor income from the rest of the world is net asset income plus domestic residents’ wage income from foreign countries minus wage income of foreign residents from the domestic country. Since the latter type of factor income is based on residency rather than citizenship, it is typically small. Subtracting depreciation and net indirect business taxes fromGNIgivesnational income. Subtracting
corporate profits and net personal interest payments and adding transfers givespersonal income. Subtracting personal taxes givesdisposable personal incomeand subtracting personal saving givespersonal consumption. The major part of the difference betweenGNIand consumption is gross saving which consists of depreciation
and net saving (by governments, corporations, and individuals). Sørensen and Yosha (1998) and Balli and Sørensen (2007) examine the contribution of the various components ofGDPto international risk sharing in
much more detail.
5Kalemli-Ozcan, Sørensen, and Yosha (2001) derive a formula for the equilibrium share of aggregate
examine in our empirical work if risk sharing increases with the quantities of foreign assets traded and we will consider which categories of assets or liabilities provides better risk sharing.
The formation of a monetary union is likely to increase financial integration in the sense that member countries will hold more foreign assets. On the other hand, the creation of a
monetary union may lower the amount of risk sharing obtained per euro invested abroad,
if it makes the returns of assets issued by different countries more similar. Convergence of EMU rates of returns have been documented by Baele, et al. (2004).
Convergence of returns have been particularly strong for risk free government bonds within the EMU. With the elimination of currency risk, interest rates become identical, and if, for example, French households swap French government bonds for German government bonds, this will not contribute to risk sharing between those countries. The returns on corporate bonds may also become more similar but the realized return paid on, say, Spanish corporate bonds are likely to have a higher correlation with Spanish output than risk free Spanish government bonds if, for example, Spanish firms default more often in bad times when Spanish aggregate output is declining. Hence, the credit risk embedded in corporate bonds may contribute to international risk sharing if the ownership of corporate bonds is internationally diversified. A similar logic applies to the bank loan component of debt,
where domestic holdings of foreign debt BD include cross-border loans of domestic banks
to foreign residents and foreign holdings of domestic debt BF include foreign banks’
cross-border loans to domestic residents.
Financial integration may also increase the correlation of equity returns, for example if equity returns become more affected by global risk tolerance, liquidity preference, discount rates for future dividends, etc. Stock market returns, however, will also reflect the country-specific performance of listed firms and equity returns are therefore likely to be positively correlated with the output of the issuing country.
Finally, FDI returns are likely to be more directly tied to the earnings of foreign owned establishments, because sales are often correlated with the output of the host country and earnings are not subject to as many fluctuations as returns on traded equity. Therefore income streams associated with FDI assets and liabilities may be particularly effective in providing risk sharing.
For each category of assets, EMU countries can invest in other EMU countries or in the rest of the world. If market integration makes the rates of return on EMU assets
more similar, more risk sharing may be obtained from investing in non-EMU countries.6
While the returns on non-EMU assets may be less correlated with aggregate EMU output and, therefore, not able to bring the EMU countries to the perfect risk sharing allocation, such assets may nevertheless provide effective diversification benefits and help lower the correlation between income and domestic output.
Perfect income smoothing is likely an illusive goal because of moral hazard (if income is fully insured, why work hard?) and costs of gathering information and trading assets. However, economic agents derive utility from consumption and the perfect risk sharing benchmark involves consumption. A slightly simplified view of how people share risk is one where people insure their income as much as possible and, conditional on income, decide how to further smooth consumption by adjusting their level of saving. Consider the (simplified) identity:
CONS = GNI − Gross National Saving. (3)
Procyclical saving has the potential of smoothing fluctuations in income: Individuals may save in “good” years and dissave in “bad” years. Forward-looking risk-averse consumers will attempt to keep a smooth path of consumption; however, rational expectation mod-els of consumption, such as the permanent income hypothesis, do not necessarily predict significant consumption smoothing as we measure it—if shocks are highly persistent, the optimal behavior involves little saving in response to shocks. In other words, simple bench-mark models are not necessarily informative about whether consumption should be more
or less smooth than income.7 Recent models stress that precautionary saving, credit
ra-tioning, and developments in housings markets may affect consumption.8 Consider a
coun-try where mortgage markets have historically been undeveloped and credit generally scarce. A relaxation in credit availability is typically followed by a rapid increase in consumption simultaneously with a rapid expansion in output. According to our measures of consump-tion risk-sharing, this situaconsump-tion reflects “dis-smoothing” as both consumpconsump-tion and output jump to new higher levels. Such temporary volatility in consumption, however, is clearly
amount of diversification obtained per euro invested.
7In econometric jargon “high persistence of shocks” refers to the situation where a positive income shock
typically signals more positive income shocks to follow. Campbell and Deaton (1988) showed that U.S. aggregate shocks tend to be so persistent that consumers according to the standard permanent income model of Hall (1978) ought to dissave following positive shocks. The prediction is not satisfied by the consumption data and this mismatch between consumption patterns and the predictions of Hall’s model is denoted “excess smoothness of consumption.”
8The buffer-stock model of consumption, popularized by Carroll (1997), assumes that agents are
im-patient (having a discount rate higher than the interest rate) and credit-constrained. While this model also have some problems fitting consumption data, extensions that include housing (an illiquid asset that can only be bought and sold at a cost) have the potential of explaining why aggregate consumption reacts sluggishly to income as shown by Luengo-Prado and Sørensen (2008).
associated with beneficial developments and countries that have experienced a relaxation of credit-constraints will likely also improve their ability to insure output risks, such as productivity shocks. Because such economies are not close to a steady-state, our stylized consumption measures will pick up dis-smoothing during the period of adjustment and will not catch that risk sharing opportunities have in fact improved. Consumption may also fluctuate due to “taste shocks”—that is, changes in desired consumption not explained by income—examples could be changing fashions or changes in relative prices (electron-ics, energy, etc.). Such desired consumption fluctuations may also make the consumption outcomes differ from the benchmark of stable growth rates across countries.
A significant part of consumption smoothing is due to the behavior of governments. In this paper we treat government consumption as a perfect substitute for private consumption and our main measure of consumption (“final consumption”) is the sum of government and private consumption. Fluctuations in government consumption may be considered a form of taste shocks: Governments may increase government consumption, for example due to wars or hurricane damage or political expediency. If government saving is procyclical it will smooth consumption because the saving could alternatively have been used for government consumption or rebated to the private sector and used for private consumption. In the same fashion, private saving smooth consumption if it is procyclical. Government and private saving are available from the national accounts, and we estimate the contribution to risk sharing of each in order to examine if consumption risk sharing is particularly affected by government or private saving.
It is our experience that measures of income risk sharing tend to reveal trends in risk sharing more clearly than consumption-based measures—the income-based measures are relatively less likely to be affected by adjustments toward new steady-states or taste shocks.
3
Measuring risk sharing: Income smoothing and
consump-tion smoothing
As it is common in the literature we construct measures of the degree of consumption risk sharing among groups of countries, e.g. the EMU, that takes a value of unity (100 percent) if the growth rates of country-level consumption are identical, and, therefore, equal to the growth rate of aggregate EMU consumption.
Denote countryi’s year t(per capita real, government plus private) final consumption,
year t (real per capita) output, GDPit, and aggregate output of the EMU in year t, GDPt. Our measures build on the observation that the correlation of country-specific consumption,
∆ logCit−∆ logCt, with country-specific output shocks, ∆ logGDPit−∆ logGDPt, is zero
under perfect risk sharing. We consider country-specific growth rates because aggregate shocks cannot be eliminated by the sharing of risk, and the aggregate component is therefore deducted from the individual countries’ growth rates. A correlation of unity has the natural interpretation of zero percent risk sharing.
We also consider income smoothing and say that income risk sharing is perfect if
country-specific (real per capita) gross national income,GNIit−GNIt, is uncorrelated with
country-specific output, where GNIit and GNIt are the year t per capita aggregate gross national
income of countryiand the EMU, respectively. We do not present actual correlations, but
follow Mace (1991) and rely on regression coefficients (these are proportional to correlation coefficients in the simplest case, but allow for more flexibility).
3.1 Year-by-year measures of risk sharing: Specification
Our empirical approach builds on the decomposition of Sørensen and Yosha (1998). We specify regressions that quantify deviations from perfect income and consumption risk shar-ing, respectively.
Consider a group of countries and the following set of cross-sectional regressions—one
for each yeart:
∆ logGNIit−∆ logGNIt = constant + βK,t (∆ logGDPit−∆ logGDPt) + ²it. (4)
The coefficient βK,t measures the average co-movement of country-specific GNI growth
with country-specific GDP growth in year t. Under perfect risk sharing, the left-hand side
of equation (4) will be zero implying that βK,t is zero. The smaller the co-movement of
idiosyncratic GNI with GDP, the more GNI is buffered against GDP fluctuations and the
smaller the estimated value of βK,t. Since GNI equals GDP plus net factor income from
abroad, this regression measures the amount of income risk sharing provided by net factor
income flows—the lower βK,t, the higher is income risk sharing in year t. The estimated
coefficients,βK,t, measure the evolution of risk sharing over time. Often it is more instructive
to look at the equivalent series 1−βK,t. This series will take the value one if risk sharing
In a similar manner, we estimate year-by-year the relation
∆ logCit−∆ logCt = constant + βC,t (∆ logGDPit−∆ logGDPt) + ²it, (5)
whereCit is country i’s year tper capita final consumption, and Ct is the yeart per capita
aggregate final consumption for the group of countries in the regression. The coefficient
βC,t measures the average co-movement of the countries’ idiosyncratic consumption growth
with their idiosyncratic GDP growth in year t. The smaller the co-movement, the more
consumption is buffered against GDP fluctuations. Therefore, this regression provides a measure of the extent of consumption risk sharing.
3.2 Year-by-year measures of risk sharing: Plot
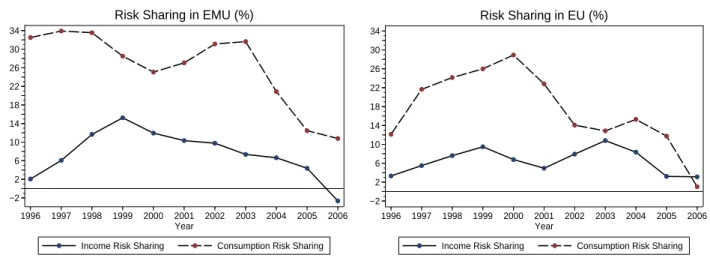
Figure 1 displays the series of risk sharing measures for EMU and EU countries in order to see if any “trend” is immediately obvious (the series are smoothed to highlight the trend).
More precisely, we display the estimated values of 100·(1−βK,t) which we interpret as the
percentage of income risk sharing obtained, and 100·(1−βC,t), which we interpret as the
percentage of consumption risk sharing.
Income risk sharing improved in the late 1990s but has declined in the EMU since then. Sørensen, et al. (2007) similarly found an increase in income risk sharing in the late 1990s while Sørensen and Yosha (1998) robustly found no income risk sharing before 1990. Our interpretation is that financial integration has improved risk sharing over time although the level of income risk sharing is still quite modest. The decline in the point estimates is likely “noise”—the low dispersion of output shocks among the EMU countries (“little risk to share”) has the effect of making the estimated risk sharing estimates somewhat fragile. Consumption risk sharing has declined during our sample period. We strongly believe
that this does not reflect a declinein the ability of EMU citizens to share risk but rather
patterns of consumption preferences that are determined by factors such as, for example, expectations or financial innovation that cause consumption growth to deviate from output
growth in the short run. On the other hand, the results do indicate that the level of risk
sharing between EMU countries is far from perfect. The picture for the EU is quite similar, although the decline in consumption risk sharing is even steeper than for EMU. Estimated income risk sharing is very similar to that of the EMU countries.
3.3 Panel data regressions: Specification
We estimate panel data regressions of the form:
∆ logGNIit−∆ logGNIt = µi + κ (∆ logGDPit−∆ logGDPt) + ²it. (6)
This regression is similar to (4) except that it is now a panel obtained by pooling the years in the sample. In this specification, suggested by Asdrubali, Sørensen, and Yosha (1996),
(1−κ) is a scalar that measures the average amount of income risk sharing during the
time-period considered. The coefficient κ measures the average co-movement of the countries’
idiosyncratic GNI-growth with their idiosyncratic GDP-growth over the sample period. The
symbol µi indicates the inclusion of a dummy variable for each country—usually referred
to as a country fixed effect. The inclusion of country fixed effect is, in OLS regressions, mathematically equivalent to subtracting the country averages over the sample period for each variable and then running the regression without a constant. Alternatively, we can run the regression without country fixed effects:
∆ logGNIit−∆ logGNIt = constant + κ (∆ logGDPit−∆ logGDPt) + ²it. (7)
The difference between the two specifications is that the regression with country fixed
effects has removed the country averages ∆ logGNIi. = T1ΣtT=1∆ logGNIit and ∆ logGDPi.=
1
TΣTt=1∆ logGDPit. If there is high risk sharing at longer intervals (in our samplesT would be
six years) then ∆ logGNIi.will not be highly correlated with ∆ logGDPi..9 Usually the focus
is on short-term patterns in discussions of risk sharing and we will show results of panel data
regressions that include country fixed effects.10 In order to highlight the relation between
the time averaged variables, such as ∆ logGDPi., we tabulate their values in Table 1.11
3.3.1 Risk sharing from government versus private saving
We provide measures of the contribution from channels of saving to risk sharing similar to
Sørensen and Yosha (1998). Consider (real per capita) government savingGSit in country
9Notice that for any variableX, ΣT
t=1∆Xt=XT−X1. Therefore, the subtraction of the country fixed
effects remove the impact of changes from year 1 to year T—in other words, the regression results will capture only short term changes after country fixed effects have been included in the panel regression.
10There are several reasons for the focus on shorter frequencies: Risk sharing at longer horizons may be
harder to accomplish, although insurance against long lasting shocks may be more important, or long run trends in consumption may capture factors such as demographic trends rather than risk.
11One could test for the significance of the dummy variables but, as we verified, they are all insignificant
due to the short samples. The important issue is, however, that the inclusion of country fixed effects changes the interpretation of the results to short-term risk sharing.
i at time t. Government and private saving are determined simultaneously, but we may get an estimate of the contribution to risk sharing from government saving by making the
thought experiment that private saving is zero. In this case consumption is NNDIit−GSit
(whereNNDIis net national disposable income). The smoothing of consumption, relative to
income, in this situation is the difference between ∆ logNNDIitand ∆ log(NNDIit−GSit). We
may then measure the contribution of government saving to risk sharing as the coefficient
γ in the panel data regression
∆ logNNDIit−∆ log(NNDIit−GSit) =µi + γ (∆ logGDPit−∆ logGDPt) + ²it. (8)
In this regression, γ directly measures the amount of risk sharing. If government saving
is procyclical NNDIit−GSit will co-vary less with output fluctuations than NNDIit and the
estimated value of γ will be positive, indicating positive risk sharing from government
saving.
Correspondingly, we may run a similar regression substituting private for government saving to get an estimate of the contribution to risk sharing from private saving.
4
Does higher foreign asset holdings in the EU lead to better
income and consumption risk sharing?
We follow M´elitz and Zumer (1999) and Sørensen et al. (2007) and impose structure onκ.
We allowκ to change over time and across countries as follows:
κ = κ0 + κ1t + κ2(FAit−FA), (9)
where FAit ≡ is a measure of foreign assets or liabilities of country i at time t. As a
technical matter, we deduct the mean value of FA because this keeps the interpretation
of κ0 unchanged.12 The term, FA, is generic and may refer to, e.g., total foreign assets
relative to GDP and FA is the average across countries and years. The estimated value
of 1−κ0 corresponds to the average amount of income risk sharing within the group and
12WhenFAis not included in the regression,κ
0 measures (approximately) the amount of risk sharing for
a country with an average amount of financial assets. In a regression in which FA is included and FA is
not subtracted, the interpretation ofκ0 is the amount of risk sharing for a country with no foreign assets.
Typically, if ˆκ0 is the estimate of κ0 from the former regression and ˜κ0 is the estimate from the latter
regression, one would find ˜κ0 = ˆκ0−κˆ2FAwhile the estimated value ofκ0 will be approximately invariant
when the average has been subtracted from foreign assets. The estimated value of κ2 is mathematically
1−κ0 −κ1t − κ2(FAit −FA) measures the amount of income risk sharing obtained in
periodt by countryi. We include a time trend in order to guard against the trend in asset
holdings spuriously capturing trend changes in risk sharing that may be caused by other developments in national economies. In the specification implied by (6) and (9), the amount of income risk sharing is allowed to change across countries with foreign asset holdings. The
estimate of −κ2 measures how much a unit change in FA increases the amount of income
risk sharing obtained.
We will obtain a positive significant value of −κ2 if countries that hold more foreign
assets (liabilities) obtain higher risk sharing, but the coefficient will also be positive if increasing asset holdings over time have been associated with more risk sharing—in other words, the interaction term may primarily capture either the trend or country-by-country
differences.13 Sometimes we want to ask only if increasing asset holdings over time leads to
higher risk sharing while controlling for average differences in asset holdings across countries. In this case we use the specification
κ = κ0 + κ1t + κ2(FAit−FAi.), (10)
where the country-specific averages over time of the interaction term FA have been
sub-tracted. In this specification the estimate of κ2 reflects the time series variation in foreign
asset holdings in the average country while differences in the level of asset holdings between, say, Ireland and Germany, will not affect the result.
4.1 Data
We use data for GDP (Gross Domestic Product), GNI (Gross National Income), NNDI (Net National Disposable Income), Government Revenue, Government Expenditure, Popu-lation, Final Consumption, and Consumer prices from Eurostat. We calculate Government Saving as Government Revenue minus Government Expenditure. We calculate Private Sav-ing as the difference between Total SavSav-ing (NNDI minus Total Final Consumption) and Government Saving. We calculate the growth rate of per capita real GDP, GNI, and (Fi-nal) Consumption by calculating per capita values and deflating all series by the Consumer Price Index of the corresponding country. We obtain portfolio equity and debt holdings by issuing country from the IMF Coordinated Portfolio Investment Surveys. These data record which foreign countries a country in the sample have invested in. These surveys were
13The year-by-year risk sharing regressions reflect on the time series pattern and are not affected by
conducted using consistent guidelines for measuring security holdings across countries and
the data are likely to be of high quality. The surveys were conducted for investor
coun-tries, including most OECD countries. Aggregate foreign equity, debt, and foreign direct investment (FDI) asset and liability data can be obtained from Lane and Milesi-Ferretti (2007). Data on banking integration are from the databases Bankscope and Zephyr, both published by Bureau van Dijk.
5
Empirical findings: Portfolio holdings
In order to get an impression of growth-patterns by country, we display in Table 1 the average growth rates of output, gross national income, and consumption for each country for the sub-samples 1995-1999 and 2000-2006 surrounding the year of the introduction of the euro. The long-term EU-countries such as France, Germany, and Italy have been among the slowest growing countries during the 1995-2006 period while less developed economies such as Estonia and Slovenia have been fast growing. Ireland had such high growth in the 1990s that its output now is clearly above the EU average even if it started below the EU average. As Ireland has reached the level of development of the older EU-countries, growth has slowed down while the growth rates of Estonia and Latvia have accelerated into the double digits after the turn of the millennium. If there is significant risk sharing at the 5-6 year horizon the county-by-country consumption growth rates would not very similar to output growth rates. One quick glance at the table reveals that risk sharing is still very low among the EU countries at the 5-year frequency: Ireland and Estonia have rapid consumption growth and Germany has low consumption growth and those average growth rates are very similar to the output growth rates of the respective countries. Maybe there is more risk sharing at higher frequencies and we turn to that question next.
5.1 Panel data regressions: Risk sharing among EMU and EU countries
Table 2 shows the results of panel risk sharing regressions for the years 1995–1999 and 2000–2006 for different groups of EU countries. In particular, we estimate the degree of risk sharing among EMU member countries in columns (1) and (2), “old” EU countries in columns (3) and (4), “new” EU countries in columns (5) and (6), and all EU countries in columns (7) and (8), for each of the two subperiods. The table displays results for both income and consumption risk sharing. The results are presented with country fixed effects (country dummy variables).
Considering first income risk sharing among the group of EMU countries, we find no risk sharing in the early (1995-1999) sample but 15.7 percent risk sharing in the 2000-2006
sample.14 For the larger group of long-standing EU countries, columns (3) and (4), income
risk sharing has declined in the new millennium. We believe that the underlying amount of income insurance may be increasing but that temporary effects, in particular recessions, can skew the numbers. However, the larger decline in income risk sharing for this group of countries, compared to the EMU group, strongly suggests that financial integration within the EMU has facilitated risk sharing. The new EU countries display positive and increasing income risk sharing. For the full group of EU countries income risk sharing is positive and statistically significant—partly due to lower standard errors that results from the larger
sample.15
Consider consumption risk sharing.16 Consumption risk sharing in the EMU is 42.3
percent in the early sample and 52.9 percent in the late sample. Consumption smoothing for the old EU group is similar in 1995-1999 but declined a little for 2000-2006 but these differences are not significant. Consumption risk sharing among the group of new EU countries is very low. Possibly this is due to financial developments making credit more available than in the past and if this results in a consumption surge in some of these countries simultaneously with a surge in output, we will estimate low consumption smoothing. The estimates for 2000–2006 are even lower than income risk sharing, implying that saving didn’t contribute to risk sharing at all. Consumption risk sharing for the full group of EU countries is almost as low as for the new EU group.
Overall, the estimates are somewhat noisy. This is to be expected when using short samples, but there is little doubt that income risk sharing is currently positive while it was close to zero in the early 1990s. We believe this is a result of financial globalization which is partly caused by EU integration and the formation of the EMU. However, the data do not indicate any sudden sharp break at the time the common currency was introduced.
14Sørensen and Yosha (1998) robustly found no income risk sharing between EU (and OECD) countries in
the 1970s or 1980s. In their regressions Belgium, Denmark, France, Germany, Ireland, Italy, the Netherlands, and the United Kingdom comprised “the EU.” For the EU-countries they found consumption risk sharing of 43 percent during 1966-1980 and 22 percent during the 1980s. They did not include country dummies in their regressions.
15The risk sharing estimate for the full groups of EU countries does not equal the average of the estimated
risk sharing for the sub-groups although it may often be close. The estimate for the full groups is partly
driven by the amount of risk sharing betweenthe group of old EU countries and the group of new EU
countries. For example, if there is high risk sharing within these two groups but low risk sharing between the groups, the estimate for the full group will be below both of the within-group estimates.
16Some authors, such as Sørensen and Yosha (1998), define consumption smoothing to reflect whether
consumption is “smoother” than disposable income while consumption smoothing here captures risk sharing from all sources including income smoothing. This choice is mainly one of exposition.
Income risk sharing is mainly a result of countries owning assets in other countries and very large amount of international assets is needed to significantly smooth income. From casual observation it appears that the amount of foreign owned businesses in, say, Germany, are much below the amount of out-of-state asset holdings of typical U.S. states. Therefore, we do not find it surprising that income risk sharing in Europe is much below that found for the United States by Asdrubali, Sørensen, and Yosha (1996). Further, financial integration has harmonized interest rates on safe bonds and international trade in such bonds are now unlikely to provide substantial intra-EMU risk sharing. Overall, we find that procyclical saving is not smoothing consumption much, particularly in the new EU countries. We will briefly consider the contributions to risk sharing from government and private saving, respectively, in order to explore if this finding is due to government fiscal policy.
5.2 The role of government and private saving
Table 3 displays the amount of consumption smoothing due to saving. If saving is procyclical this will help smooth consumption. The results for EMU countries reveal quite erratic
patterns of smoothing from saving.17 In the EMU private saving dis-smooth consumption
in the early sample while procyclical government saving helped smooth consumption. In the late sample this pattern is reversed. For the larger EU sample a more systematic pattern is visible. Private saving has contributed significantly at about 35 percent to consumption smoothing while government saving contributed little at 8 percent (but not significant at the 10 percent level) to consumption smoothing in the early sample and not at all in the late sample. In the new EU countries private saving has been countercyclical making
consumption more volatile than income.18 Considering all EU countries together, there
has been little contribution to consumption smoothing from either government or private saving. The sum of the contributions from government or private saving do not exactly add up to the difference between income and consumption smoothing in the previous table but the message of these tables are the same: Procyclical saving has not played a large role in consumption smoothing in the EU since 1995. Possibly, this is pattern of saving is perfectly rational according to permanent income theory but it will take us much to far afield to answer that question.
17Of course, our results do not reveal if, say, the levels of government saving are optimal or in-optimal in
any sense.
18Recall, that our risk sharing regressions are impacted only by country-specific patterns, so in the
5.3 Foreign asset and liabilities
The simplest measure of the relative importance of foreign asset holdings is the amount of gross assets relative to GDP. We calculate this measure for portfolio equity and debt (bonds). In Table 4, we show foreign equity, debt, and FDI holdings for the years 1995 and 2004 (the last year for which we have data). Equity and debt holdings vary consid-erably across countries; Ireland holds significantly more assets relative to GDP than most other countries and Luxembourg has a character of an outlier. A trend toward increased diversification is clearly visible. If we take Ireland as an example of a very open economy with significant risk sharing, it is clear from the table that even though most countries have increased their holdings of international assets significantly they still seem too small for significant income smoothing. Another way of thinking of this is as follows. If a country has net foreign assets and liabilities in the order of GDP, then if the return on assets is one percent higher than the return on liabilities this results in net earnings from international assets equal to one percent of GDP. If this happens in a years where GDP growth is 1 per-cent below the average of the EU, the asset income will have smoothed income perfectly. We suspect a return difference of a full percent is hard to come by, at least for debt, and return differences will not always have the right sign (such as to provide smoothing) relative to output. It is our conjecture that gross asset holdings need to be in an order of 10 times GDP (which is about the level found for Ireland) to provide the level of income smoothing found between U.S. states. This is admittedly a crude calibration but our reading of Ta-ble 4 is nonetheless that most EMU countries still have some way to go before the level of financial integration found between U.S. states is achieved.
We examine if risk sharing is correlated differently with the amount invested in EMU countries (where returns are likely to more similar) than with assets invested in other
countries.19 In Table 5, we show how large a fraction of foreign assets EU countries have
invested in other EMU and EU countries, respectively. Most EU countries invest the majority of their foreign equity in EMU countries (with the Netherlands and Malta as notable exceptions). On average, EMU equity holdings have increased, although mainly in non-EMU EU countries, perhaps because the euro has lowered trading costs. There has also been an increase in the amount of EU-country equity held by EU countries, but it appears that this increase is no larger than the increase found for EMU-country equity. Overall, the equity investment of EU countries is overwhelmingly (about 60 percent) invested in EU
19The data that allow us to make this breakdown are from the IMF’s coordinated portfolio survey which
countries. A similar pattern applies to investments in debt securities. An increase in EMU country debt and an even stronger bias toward EU debt can also be observed.
5.4 Foreign asset holdings and risk sharing
Table 6 considers if higher amounts of foreign assets are associated with more income risk sharing. The interpretation of the interaction coefficient is the increase in risk sharing that would result from an increase in foreign asset holdings equal to GDP. Because holdings of, say, equity and debt tend to be highly correlated, with some countries holding large amounts of each while other countries hold few foreign assets of either kind, the results are
somewhat tentative.20 The results for the EMU and the EU are similar, although the EMU
results have higher standard errors and some of the coefficients appear noisy. Most of the interaction coefficients are not significant but the interaction terms with asset holdings are all positive which is a strong indicator that there really is a positive effect. The coefficients to assets (whether debt or equity) invested outside the EMU are significant which indicates that such assets may have returns that are less correlated with the output of the investor countries and therefore are better able to smooth income.
Table 7 displays results for consumption risk sharing from regressions similar to those of the previous table. The results of these regressions reveal a negative association of asset holdings with risk sharing. A decrease in consumption smoothing has occurred during this period where asset holdings have been increasing. We do not believe that this finding reflects that countries which increase foreign asset holdings become more exposed to output risk—while a full investigation of this issue is beyond the scope of this study, we think that
easier access to credit may have lead to high growth of outputand consumption in certain
countries. This implies that risk sharing is far from perfect but probably not that risk sharing has declined in a deeper sense.
In Table 8 the coefficient to risk sharing is a function of equity, bond, and FDI holdings and liabilities. The results do not appear noisy and the coefficient estimates are quite similar for the EMU and the full EU. The coefficients to all assets and liabilities are positive and significant; however, the asset holdings are so correlated that the coefficient to bonds may be positive not because bond holdings are efficient for risk sharing but because bond holding are correlated with, say, FDI holdings. The estimated coefficients are largest for debt assets as well as liabilities. We doubt that this is due to returns to, for example, debt
20If the sample was substantially larger, we could include interaction terms for equity and debt invested
in EMU, EU, and rest-of-the-world in one multiple regression and get a cleaner picture of the relative importance of each term.
assets being more correlated with output. We do not attempt to trace out the mechanisms underlying the results but we point out the underlying mechanisms can be quite indirect. For example, if the government of a country aggressively borrows abroad by issuing bonds during recessions, we will see debt correlated with risk sharing. Or the amount of corporate debt may reflect structural differences between economies.
Table 9 reports on estimates of consumption risk sharing for specifications similar to those of the previous table. Most coefficients are insignificant indicating that the risk sharing effects of saving adds a level of noise to our income based regressions. Only the coefficient of interaction with debt holdings is significant. This may reflect the results of the previous tables or it could reflect that countries with high saving rates hold more debt assets and find it easier to smooth consumption.
Overall, higher stocks of international assets help smooth income and assets held outside the EMU seem to provide better risk sharing per euro invested. Our short samples do not really warrant any further conclusions.
6
Integration of European banking markets through
consol-idation and foreign entry
An analysis of the impact of European banking market integration on risk sharing may be approached in a similar fashion to the analysis above, investigating the smoothing of income and consumption from the part of net foreign income resulting from bank loans and bank sector FDI. Banks, however, may facilitate risk sharing through channels not considered above. In the following, we therefore use the approach of Demyanyk, Ostergaard, and Sørensen (2007a,b) to analyze these questions. Demyanyk, Ostergaard, and Sørensen have recently showed that deregulation and integration of individual U.S. states’ banking markets have entailed welfare gains for, especially, small business owners whose personal income has been smoothed considerably.
Banking integration may smooth households’ personal income relative to output fluctu-ations, i.e., income risk sharing, by increasing the availability of loans to households or by altering the lending pattern of banks. For illustration, consider an owner of a small business that is entirely self-financed (a sole proprietorship). In this case, the small business owner bears all the firm’s output risk himself/herself—shocks to the surplus created in the firm will be transferred one-to-one to his or her personal income. When the owner obtains external finance, the linkage between his or her personal finances and those of the business is relaxed
and the covariation of personal income with output may fall. Banks may share risk with the owner by avoiding initiation of formal bankruptcy procedures and liquidation of assets when the business hits hard times, allowing the borrower to fall behind with payments of interest and installments, and renegotiating loan contracts. When businesses default, banks share risk by absorbing part of the losses. Furthermore, the availability of external finance may help small business owners smooth their income to the extent it furthers diversifica-tion of the owners’ sources of income. It may facilitate accumuladiversifica-tion of assets outside the business, e.g., in domestic or foreign financial investments, generating a stream of future income that is less than perfectly correlated with the success of the business.
In the beginning of the 1980s, U.S. banking markets were heavily regulated at the state level: Most states did not allow entry by banks from other states and several states did not permit in-state banks to set up state-wide branch networks. During the 1980s and 1990s, however, most states eliminated these restrictions and two waves of bank mergers and
acquisitions ensued. The first wave entailed consolidationwithinstates, the second entailed
consolidation across state borders. Demyanyk, Ostergaard, and Sørensen show that the
percentage of states’ output shocks smoothed, and therefore not passed on to personal income, increased by twenty percentage points for the group of states with most small businesses. For the average state, the effect of banking deregulation was in the order of ten
percentage points.21 An important conclusion of Demyanyk, Ostergaard, and Sørensen is
that both consolidationwithinmarkets (domestic consolidation) and consolidationbetween
markets (cross-border consolidation) are associated with improvements in risk sharing. Fundamentally, banks’ ability to share risk is determined by their ability to assume
and bear risk on their balance sheets.22 The better banks may withstand economic shocks,
the less those shocks will be passed on to their borrowers. It follows directly that a bank that expands operations into new markets, either through direct cross-border lending or by establishing foreign subsidiaries or branches, may improve the geographical diversification of its loan portfolio and lower its susceptibility to national business cycle fluctuations. Hence, cross-border lending and investments in banking markets may improve risk sharing through net factor income in a manner similar to debt and FDI, as discussed in Section 2, but also because diversification of banks’ asset portfolios may improve their consolidated risk-return tradeoff and smooth revenues, which, in turn, may impact banks’ ability to bear
21Further evidence is provided by Demyanyk (2005, 2008) who shows that income growth rates improved
among self-employed following U.S. banking deregulations.
22Of course, banks may alternatively pass assumed risk on to third parties through securitization or loan
sales, in which case the banks do not bear the risks on their balance sheets, but facilitates risk sharing as intermediaries.
risk and their pattern of lending.23
It may be less obvious that also within-market consolidation may improve risk sharing. Demyanyk, Ostergaard, and Sørensen argue that this effect works through two main chan-nels. The first channel is wholesale banking markets. Small banks are typically without
access to wholesale money and interbank markets due to informational frictions.24 From
an EU perspective, therefore, domestic bank consolidation may give more banks access to international wholesale markets where banks and other financial institutions share risk with each other. That is, risk sharing between banks themselves may improve. For example, a bank operating in a particular country may avoid terminating borrowers’ loan contracts by borrowing in wholesale markets in the face of adverse country-specific shocks. This channel, hence, works through interbank international (cross-border) borrowing and lending.
The second channel is competition in retail banking markets. Outside entry, or the threat of outside entry, may improve the average efficiency of banks, either through ef-ficiency improvements among incumbent banks or because more efficient entrant banks drive incumbent banks out of business. Banks with superior screening or monitoring of customers, or financially less constrained banks, have more financial “slack” and therefore more leeway for sharing risk with their borrowers. Hence, intensified competition may not just lead to more competitive pricing, but also to improved risk sharing.
Assessing the integration of banking markets is important because small and medium enterprizes (SME) are heavily dependent on bank finance. Small firms do not typically have access to corporate bond or equity markets, and integration of these European securities markets, therefore, do not necessarily benefit this group of firms. SMEs are important cata-lysts in the economy—much new innovation and job creation takes place in small businesses. However, small firms’ investment is especially vulnerable to business cycle fluctuations and the extent to which banks are willing and able to bear borrowers’ risk may therefore have important implication for economic growth and the welfare of entrepreneurs.
When we consider the existing empirical evidence of the integration of European whole-sale and retail banking markets, respectively, the conclusion is generally that wholewhole-sale markets are strongly integrated but the retail markets are much less so. Baele et al. (2004) quantify the evolution of market integration after the introduction of the euro and find that repo and unsecured money markets are close to perfectly integrated. Barros et al. (2005) report that the European interbank market is two-tiered: Large domestic banks hold
po-23Houston, James, and Marcus (1997) demonstrate that U.S. bank holding companies manage capital and
liquidity at the consolidated level.
sitions against foreign banks and reallocate funding to smaller national banks. Hence, if domestic banking consolidation, through the creation of larger banks, have improved banks’ (direct and indirect) access to well-functioning pan-European wholesale markets, EU-wide risk sharing may have improved as a consequence.
On the other hand, considering retail banking markets, several studies have pointed to an apparent lack of integration. Loan interest rates differ considerably between European countries, and while the cross-country dispersion of loan rates has decreased during the 1990s, it is still considerable, especially in the market for consumer and short-term business loans (Baele et al. (2004), and Gual (2004)). This seems to suggest that competition between regional banking markets is still relatively limited. Also, banks hold only a fraction of their assets and liabilities—typically 5–10 percent—directly against resident non-bank counterparties (Barros et al. (2005), Dermine (2005)). Direct cross-border non-banking transactions are relatively small in magnitude. Buch, Driscoll, and Ostergaard (2006) show that banks’ asset portfolios are excessively (when considering potential gains from international diversification) tilted toward domestic assets. Dermine (2005) argues that to the extent financial services are non-tradable, it is unlikely that one should observe a lot of direct cross-border banking, especially when considering small business finance. Small business lending is heavily dependent on subjective (soft) information about borrowers, information that banks can not collect without geographical proximity to their borrowers. We should therefore expect integration to be achieved through cross-border investment, that is, through foreign bank entry, rather than cross-border banking.
Currently, entry by foreign banks has been limited in many European countries but a substantial consolidation among domestic banks has occurred in many of the “old” EU-member countries. In the period up to the introduction of the euro, around 60 percent of all mergers and acquisitions in Europe took place in domestic markets (Buch and DeLong
(2004), Table 1) with only a few significant cross-border deals.25 Political opposition and
merger control legislation may be other factors that explain the relative absence of foreign bank acquisitions (Carletti, Hartmann, and Ongena (2007)). Recently, however,
cross-border mergers seem to be gaining some momentum.26
25The latter included the Dutch ING Group, the pan-Scandinavian Nordea Bank, and the German Hypo
Vereinsbank, see Dermine (2005).
26It is often proposed that banking consolidation may sever bank relationships and harm small borrowers,
suggesting that small business owners will be harmed from integration. For example, Degryse, Masschelein, and Mitchell (2006) find that commercial borrowers of target banks in Belgian mergers and acquisitions are more likely to discontinue a bank relationship than borrowers of non-merging banks, and that this effect is larger for small than for large firms. A related concern is that bank competition may be harmful to bank-borrower relationships by limiting the sustainability of implicit contracts and the sharing of intertemporal
The picture is turned upside down, however, when one considers the transitional economies among the group of new countries that joined the EU in 2004. Foreign banks are pervasively present in many of these countries as a result of the transition to market-based economies, and in several countries foreign-owned banks dominate the market completely. Giannetti and Ongena (2007) demonstrate that foreign bank lending in transitional economies has
been associated with considerable positive growth effects for SMEs.27
6.1 Does integration in banking markets predict better income and con-sumption risk sharing?
We investigate the effect of domestic and cross-border consolidation in banking markets on risk sharing using the approach outlined in Section 3. That is, we estimate the regression (6), reproduced below, including an interaction effect for different measures of banking
integration in countryi, datet, generically denotedINTit.
∆ logGNIit−∆ logGNIt = µi + κ (∆ logGDPit−∆ logGDPt) + ²it,
κ = κ0 + κ1t+κ2(INTit−INT), (11)
where 1−κ is the measure of risk sharing.
Because the institutional structure of financial markets may vary considerably between the countries in the sample, we also run regressions that remove country-specific consolida-tion effects by subtracting out a country’s average level of consolidaconsolida-tion of the interacconsolida-tion
effect, INTi.. This specification essentially removes permanent differences between
coun-tries in the level of consolidation and the resulting regression captures the effect of the time-variation in banking consolidation on income and consumption risk sharing.
κ = κ0 + κ1t+κ2(INTit−INTi.). (12)
Permanent differences in financial structure are evident if we compare the groups of old and new member countries. For new member countries, the pre-transitional banking sectors have been completely transformed, but financial markets and institutions are overall still
surplus between borrowers and lenders (Petersen and Rajan (1995)). The effect of European banking consolidation, therefore, must be assessed empirically. The analysis of Demyanyk, Ostergaard, and Sørensen (2007b) shows that, in the United States, such detrimental effects are far outweighed by beneficial first order effects on risk sharing. In particular, they find that the largest effect on risk sharing comes from deregulations that eliminate local monopoly markets for community banks.
less developed compared to old member countries. Hence, if new member countries tend to experience relatively less risk sharing but a relatively higher degree of consolidation, the outcome of regressions that do not control for permanent differences in banking consolida-tion are likely to estimate a lower overall effect of banking consolidaconsolida-tion on risk sharing. Permanent differences in structure also exist among the group of old member countries, es-pecially Belgium stands out by having experienced a considerably higher degree of foreign bank entry than the average country.
6.2 Data and measures of banking integration
Cross-border ownership
We first measure banking integration as cross-border bank ownership. In particular, we
compute the proportion of bank assets (or loans) in countryithat are owned by institutions
registered in another EU country. (This measure is akin to the FDI liability measure, FDIF,
in equation (2)). The proportion of foreign ownership of a given bank is defined as the the product of foreign owners’ equity stake, measured in percent, and the value of total assets (loans) of the bank, provided that the foreign holders’ equity stake is at least 50 percent. The proportion of foreign ownership of bank assets (loans) in a given country is then summarized over all banks and divided by the value of aggregate bank assets (loans) in that country. This measure of integration will vary over time and is sensitive to the organizational form of banks with foreign ownership, i.e., this measure will not capture foreign entry if it occurs by the formation of bank branches. Preliminary investigations (not shown), suggest that these ownership measures are quite noisy and may vary considerably from year to year for a given country.
Data of foreign ownership is available from Bankscope published by Bureau van Dijk. Banks considered are commercial, savings, and cooperative banks.
Cumulative acquired bank assets in domestic and foreign M&A deals
As a second measure of banking integration, we consider the cumulated (real) value of
bank assets in country ithat were acquired in domestic, respectively foreign, merger and
acquisition (M&A) deals from the beginning of the sample up to and including year t.28
We scale this measure by the (real) value of aggregate bank assets in countryiin yeart. In
a given country, this measure will be increasing over time to the extent that consolidation
28In the regressions, we take logarithms and rescale the measure as log(1 +
INTit*100)*1000 to eliminate
the influence of outliers (we take the log of “one plusINTit” because the cumulative acquired value of bank
assets for a given country may equal zero in some years). Multiplication by 1000 is for the purpose of rescaling the parameter estimates and does not affect statical significance.