Abstract— Data mining (DM) may be viewed as the process of detecting and finding knowledge within data warehouses using of a set of analytical and intelligent tools. In this study, we focus on the use of DM techniques for the discovery of the associated factors of Alzheimer's disease (AD), which is a progressive brain disorder that causes a gradual and irreversible loss of some brain functions, including memory and language skills in addition to the loss of the ability to care for oneself. In order to do so, we make use of two techniques namely Naïve Bayes and Decision trees. It was found that the most accurate classificationwas reached through Decision Tree technique followed by Naive Bayes. Association rules technique was then used to identify the links between different features, and determine the strength of each relationship. Some of the most important associated factors discovered are gender, age group, attention level, education level, and occupation. Future opportunities to be explored by interested researchers may be adding other data mining techniques, such as Genetic Algorithm, to predict the causes of Alzheimer's disease, adding patient data extracted from MRI and/or CT scan in order to get more accurate results and finally using the output of the model in the development of an expert systems for the diagnosis of the disease.
Keywords: Data Mining, Naïve Bayes, Decision tree, Association rules, Alzheimer’s disease.
I. INTRODUCTION
Data mining is a process that aims at detecting and finding knowledge within data warehouses through the use of a set of analytical and intelligent tools. It has been used in different areas such as Medicine, with the purpose of improving medical diagnosis, detecting the causes of the diseases, and predicting the patient's health condition in the future. Examples of such applications are the early diagnosis of cancer, and the automated measurement of the weakness of the work and functions of the heart. Other applications address mental illness such as dementia. This study focuses on the use of data mining techniques for the discovery of the associated factors of Alzheimer's disease.
1.1Background
Alzheimer disease (AD) is a progressive brain disorder that causes a gradual and irreversible loss of higher brain functions such as memory, language skills, and perception of time. This leads eventually to the loss of the ability to care for oneself. It is one of the most common causes of the loss of mental functions in people over the age of 65, as in this age, 5 % to 10 % have Alzheimer‟s, and this proportion increases to about 10 % to 15 % among those in their 70s and to 30 % to 40 % among people 85 years of age or older [1]. It is a devastating disease because those who suffer from it experience frustration, anger, and fear as the disorder begins to take away their abilities and memories. Hence, it affects not only the patients, but also those who love and care for them as they suffer immeasurable pain and stress watching the disease slowly taking their loved ones from them [2].
1.2Problem of the Research The research problem lies in:
A Proposed Data Mining Model for the Associated
Factors of Alzheimer’s Disease
Dr. Nevine Makram Labib and Mohamed Sayed Badawy
Department of Computer and Information Systems
Faculty of Management Sciences,
Sadat Academy for Management Sciences
Corniche El Nil, Maadi, Cairo, Egypt
[email protected]
1. The difficulty of identifying the real causes of AD. 2. The inability to predict the health status of the patient and calculate the extent to which the patient is suffering from this disease.
3. The difficulty of identifying the relationship between Alzheimer's disease and other diseases.
1.3 Research Objectives The research aims at:
1. Discovering the associated factors of Alzheimer's. 2. Predicting the rate of Alzheimer disease for a
particular patient.
3. Comparing between different data mining techniques in the diagnosis of the disease.
1.4 Importance of the Research
The diagnosis of Alzheimer‟s reflects the doctor‟s best judgment about the causes of a patient‟s symptoms, based on the performed tests. An early diagnosis may help individuals receive treatment for symptoms and gain access to programs and support services. This will enable them to take part in decisions concerning care, living arrangements, money and legal matters. A timely diagnosis often allows the patient to participate in this planning and to decide who will make medical and financial decisions on his or her behalf in later stages of the disease.
II. RECENT STUDIES OF DATA MINING DEALING WITH ALZHEIMER’S DISEASE
This section of the study sheds light on selected recent studies addressing the problem domain.
2.1 Recent Studies
A research paper proposeda novel sparse inverse covariance estimation algorithm that discovers the connectivity among different brain regions for Alzheimer‟s study [3]. The proposed algorithm can incorporate the user feedback into the estimation process, while the connectivity patterns can be discovered automatically. Experimental results on a collection of FDG-PET images demonstrate the effectiveness of the proposed algorithm for analyzing brain region connectivity for Alzheimer‟s disease study.
Another research presented a novel technique, based on association rules, that is used to find relations among activated brain areas in single photon emission computed tomography (SPECT) imaging [4]. The aim of this work was to discover associations among attributes which characterize the perfusion patterns of normal subjects and to make use of them for the early diagnosis of Alzheimer‟s disease. The proposed methods were validated by means of the Leave-one-out cross validation strategy, yielding up to 94.87% classification accuracy, thus outperforming recent developed methods for computer-aided diagnosis of Alzheimer‟s disease.
A third studyproposed various models for the classification of different stages of Alzheimer‟s disease by considering the different cognitive tests, physical examinations, age, neuropsychiatry assessments, mental status examination and laboratory investigations [5]. These methods included Neural Networks, Multilayer Perceptron, Bagging, Decision Tree, CANFIS and Genetic algorithms. The classification accuracy for CANFIS was found to be 99.55% which was better when compared to other classification methods.
2.2 Results of the Review
Based on the previous review of some studies related to the problem domain, it is concluded that there are several data mining techniques that proved to be successful in the early diagnosis of the disease. The most important of these techniques are Decision Trees, Naïve Bayes, Association Rules, and Neural Network Classifier.
III. DESCRIPTION OF THE PROPOSED DATA MINING MODEL FOR THE ASSOCIATED FACTORS OF ALZHEIMER'S DISEASE
This section provides the description of the proposed model that makes use of data mining techniques in order to discover the associated factors of Alzheimer disease.
First, we will start by developing two models; each of them depends on a specific data mining technique namely Naïve Bayes and Decision Trees, in order to recognize the most influential attributes of the disease. Second, attributes extracted from the previous models will be considered as inputs to another model that makes use of Association Rules technique, to determine the relationships between the attributes and their strength regarding the state of the disease.
The proposed data mining model consists of the following stages:
3. 1 Data Collection
Data have been compiled from more than one source as follows:-
3.1.1 Sources:-
A-Textbooks: medical books and references specialized in Alzheimer's disease (AD).
B- Patient Records: extracted from „Dar Ome we Abe‟, that provides care for elderly people with Alzheimer's disease, and the educational hospital of Alexandria University. 3.1.2 Methods:-
A- Literature Review of AD to find out the relevant factors and the relationships between them.
B- Structured Interviews with Geriatricians who work in governmental hospitals and private medical centers.
3.2 Data Purifying
In this step, all the missing values were replaced by the arithmetic mean or the mode with respect to that attribute, and all incorrect or non-clear data were excluded.
3.3 Data Selection
Only 45 attributes have been selected from the patients‟ files based on the recommendation of the geriatricians. Then, the mining techniques were applied to these specific data items in order to reach the ones that are of interest for the domain. 3.4 Data Integration
The data was integrated into one structure as the sample was collected from various sources and formats including text, Excel, and Microsoft database access format.
3.5 Data Mining Tool
The database was built using SQL Server Management Studio 2008.This software was selected specifically because of its compatibility with SQL Server Business Intelligence Development Studio. The database was then tested and validated after undergoing 11 stages that resulted in the successful transfer of 868 rows.
As for the data mining tool, Microsoft Visual Studio2008 was usedsince it provides a full set of easy to use, graphical administration tools for creating, configuring and maintaining databases, data warehouses, and data marts. 3.6 Data Mining Techniques
The selected techniques include Decision Trees, Association Rules, and Naïve Bayes.
IV. Exploring the Data Mining Models 4.1 Decision Trees Model
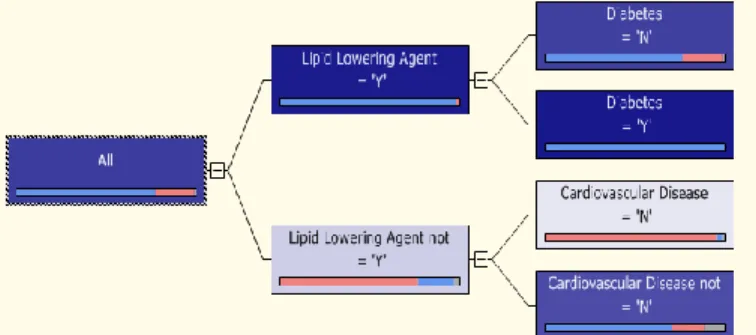
Using the decision tree model, it was found that: 1 - Decision Tree of the diagnosis of Alzheimer's disease consists of three levels, each level is a tipping point to split the data into two parts.
2 - A set of effective attributes in the diagnosis of Alzheimer's disease, are “Lipid Lowering Agent”, “Diabetes”, and “Cardiovascular Disease”. 3 - There is a very strong relation between the incidence of the disease and the presence of “Lipid Lowering Agent = Y” and “Diabetes = Y” together.
4- There is a very strong relation between incidence of the disease and the presence of “Lipid Lowering Agent not = Y” and “Cardiovascular Disease = N” together.
4.2 Naïve Bayes Model 4.2.1 Dependency Network
Following is the dependency network that shows the attributes that have an impact on the diagnosis.
Figure 2. Dependency Network for Naive Bayes Model 4.2.2 Attribute Characteristics
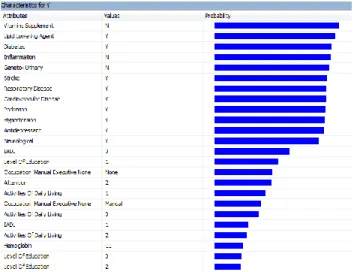
The following figure shows the arrangement of attributes using the percentage of the probability that occur in Diagnosis = Y. These attributes have been arranged in descending order according to the probability of patients suffering from the disease. It has been observed that there is a set of features that occupies the first rank in the probability of the disease. It includes Vitamins Supplement = N, Lipid Lowering Agent = Y, Diabetes = Y, Inflammation = N, Geneto- Urinary = N, Stroke = Y, Respiratory Disease = Y, Cardiovascular Disease = Y, Parkinson = Y, Hemoglobin = Y, Antidepressant = Y, Neurological = Y.
Figure 3. Attribute Characteristics for Diagnosis = „Y‟ V. Validating Model Effectiveness
The effectiveness of both models was tested using two methods: Lift Chart and Classification Matrix. The purpose was to determine which model gave the highest percentage of correct predictions for diagnosing patients with Alzheimer's disease.
5.1 Lift Chart with Predictable Value
To determine if there was sufficient information to learn some patterns in response to the predictable attribute, columns in the trained model were mapped to those in the test dataset. The model, predictable column to chart against, and the state of the column to predict patients with AD were also selected. The following Lift Chart shows the comparison between the different models.
This chart includes the two models using the same data; the x-axis of the chart represents the percentage of the test dataset that is used to compare the predictions while the y-axis of the chart represents the percentage of predicted values. To determine if there was sufficient information to learn patterns related to the predictable attribute, columns in the trained model were mapped to columns in the test dataset. The top red line shows the ideal model; it captured 100% of the target population for patients with Alzheimer's disease using 60% of the test dataset, the bottom blue line shows the random line which is always a 45 degree line across the chart. It shows that if we randomly guess the result for each case, 50% of the target population would be captured using 46% of the test dataset. Two models line (green represents Decision Trees Model and purple represents Naïve Bayes Model) fall between the random-guess and ideal model lines, showing that both two have sufficient information to learn patterns in response to the predictable state.
5.2 Statistics for the Comparison of Models Following is a figure that shows a set of statistics for a comparison between the different models.
Figure 5. Comparison between the Different Models The data was interpreted in the form that is suitable for the Decision Trees technique in order to receive a 1.00 in the score column. Moreover, it got a 99.60% in the Predict Probability column, followed by Naïve Bayes technique that has a 1.00 in the column Score and earned 99.54% in column Predict Probability. It also got both of the two models a 59.52% in the column Target Population. Therefore, it is closer to the ideal solution.
Once the testing phase of the models is complete, and their validity is ensured, it is followed by the stage of extracting the factors affect the diagnosis of Alzheimer's disease, as in the following table:-
Table 1. Factors Affecting the Diagnosis of AD Attributes
Vitamins Supplement Lipid Lowering Agent Diabetes Geneto- Urinary
Stroke Cardiovascular Disease Parkinson Hypertension Antidepressant Neurological
Attributes
Attention Activities Of Daily Living Level Of Education Occupation Manual
Executive None Respiratory Disease IADL
Inflammation Hemoglobin
To finalize the knowledge discovery process, another model is developed. It aims at identifying the extent of correlation of these features with a certain diagnosis. It has as input the features extracted from the previous model.
VI. ASSOCIATION RULES MODEL 6. 1 Rules
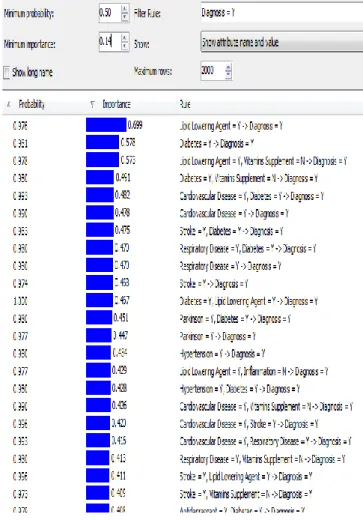
The rules represent the qualified association rules.The rule grid displays all qualified rules, their probabilities, and their importance scores. The importance score is designed to measure the usefulness of a rule, the higher the degree of importance of this gives credence to the rule .
Figure 6. Rules of the Association Rules Model The following table shows the set of rules produced by the model, which explains the power of relationship between different Attributes with Diagnosis = „Y‟.
Table 2. Relationship between Different Attributes with Diagnosis = Y Probability Importance Rule 0.979 0.858 Lipid Lowering Agent = Y -> Diagnosis = Y 0.982 0.673 Lipid Lowering Agent = Y, Vitamins Supplement = N -> Diagnosis = Y 0.991 0.608 Diabetes = Y -> Diagnosis = Y 0.990 0.519 Diabetes = Y, Vitamins Supplement = N -> Diagnosis = Y 1.000 0.518 Diabetes = Y, Lipid Lowering Agent = Y -> Diagnosis = Y 1.000 0.518 Cardiovascular Disease = Y, Diabetes = Y -> Diagnosis = Y 0.997 0.513 Cardiovascular Disease = Y -> Diagnosis = Y 0.990 0.503 Stroke = Y, Diabetes = Y -> Diagnosis = Y 0.981 0.496 Lipid Lowering Agent = Y, Inflammation = N -> Diagnosis = Y 0.975 0.486 Antidepressant = Y -> Diagnosis = Y 0.978 0.484 Stroke = Y -> Diagnosis = Y 0.987 0.470 Hypertension = Y -> Diagnosis = Y 0.990 0.468 Hypertension = Y, Diabetes = Y -> Diagnosis = Y 0.990 0.468 Parkinson = Y, Diabetes = Y -> Diagnosis = Y 0.990 0.468 Respiratory Disease = Y, Diabetes = Y -> Diagnosis = Y 0.990 0.468 Respiratory Disease = Y -> Diagnosis = Y Probability Importance Rule 0.987 0.463 Parkinson = Y -> Diagnosis = Y 0.990 0.461 Antidepressant = Y, Diabetes = Y -> Diagnosis = Y 0.997 0.452 Cardiovascular Disease = Y, Vitamins Supplement = N -> Diagnosis = Y
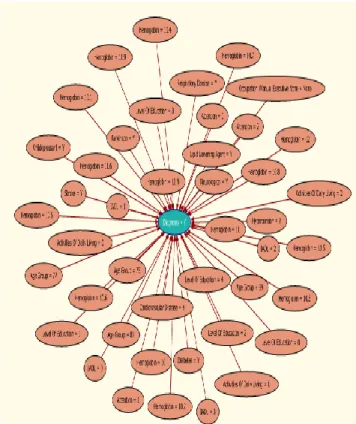
The following figure shows the link of a group of attributes with diagnosis value = „Y‟.
Figure 7. Link to a Set of Attributes to the Disease 6.2 Mining Model for Prediction
6.2.1 Prediction Using the Data Used in the Sample First, the model is determined based on Decision Tree technique. The following table shows the outcome of prediction.
Table 3. Prediction Results
The previous table shows the probability of occurrence or non occurrence of the disease in 50% of the patients, using Decision Trees.
6.2.2 Prediction Using the Extracted Data
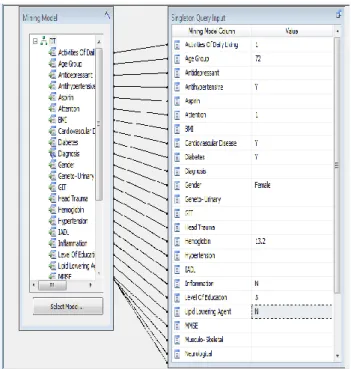
In this step, the diagnosis of the condition is predicted through the use of the three models as shown in the Singleton Query Input dialog box, whose columns are mapped to the columns in the mining model.
Figure 8. Singleton Query Input Dialog box
The previous figure shows the prediction of having the disease based on the use of some input data about a certain patient and extracting the rest of the data using the three models, based on the trained system.
As for the prediction probability of each of the three models used on the other 50%, they are illustrated in the following tables.
Table 4. Prediction Result of Decision Tree Model Predict Probability Diagnosis
0.699745547073791 Y
Table 5. Prediction Result of Naïve Bayes Model
Predict Probability Diagnosis
0.583410138248848 Y
Table 6. Prediction Result of Association Rules Model Predict Probability Diagnosis
0.491304347826087 Y
6.3 EVALUATION OF DATA MINING OBJECTIVES Three objectives of data mining were defined based on both the exploration of Alzheimer's disease dataset and the objectives of this research. They were evaluated against the trained models. Results showed that all three models had achieved the stated objectives, suggesting that they could be used to provide decision support to medical doctors for diagnosing patients and discovering medical factors associated with Alzheimer‟s Disease.
The objectives were as follows:
First objective was to discover the significant influences and relationships in the medical inputs associated with the predictable state Alzheimer's disease. The Dependency viewer in Association Rules, Decision Trees and Naïve Bayes models showed the results from the most significant to the least significant medical predictors. Medical Doctors can use this information to further analyze the strengths and weaknesses of the medical attributes associated with Alzheimer disease.
Second objective was to predict those who are likely to be diagnosed with Alzheimer disease, given patients‟ medical profiles. It was found that all models were able to perform this task using singleton query, which made use of single input cases and multiple input cases respectively, and also to show the rate of the disease.
Third objective: was to compare between the different data mining techniques. It was found that Decision Tree model was the best in the diagnosis process and Naïve Bayes model was the best in identifying the characteristics of patients with Alzheimer's disease and showing the probability of each input attribute for the predictable state.
VII. CONCLUSION AND FUTURE WORK: 7.1 Conclusion
The main purpose of this study was to build a model that has the ability to discover the associated factors of Alzheimer‟s disease in order to provide a better diagnosis and prognosis. The most important points that have been reached were the following:-
1. Decision Tree technique was able to provide more accurate results than Naive Bayes.
2. Using association rules technique was very useful in identifying the links between different features and determining the strength of each relationship.
7.2 Future Work
Based on the previous conclusions and a number of issues that arose during the study, some topics may be considered as future opportunities to be explored by interested researchers. They are the following :
1. Using additional data mining techniques, such as Genetic Algorithms in the predicting phase of Alzheimer's disease.
2. Adding patient data related to MRI and/or CT scan in order to get more accurate results.
3. Using the output of the model in the development of an expert system for the diagnosis and prognosis of the disease.
ACKNOWLEDGEMENT
The researchers would like to thank the medical doctors and administrative staff who provided them with the required data and knowledge that helped conducting the study.
REFERENCES
[1] E. Floyd, Bloom, B. M. Flint., D. J. Kupfer; the Dana Guide to Brain Health: A Practical Family Reference from Medical Experts, Simon and Schuster publisher, 2006. [2] C. L. Linda, H..Juergen, and M. D. Bludau; Alzheimer‟s Disease, ABC-CLIO Publisher, September 2012.
[3] S. Liang, P. Rinkal, L. Jun, C. Kewei, W. Teresa, and L Jing; “Mining Brain Region Connectivity for Alzheimer‟s disease Study via Sparse Inverse Covariance Estimation,” KDD '09 Proceedings of the 15th ACM SIGKDD International Conference on Knowledge Discovery and Data Mining, pp. 1335-1344, 2009.
[4] R.Chaves, J. M. Górriz., J. Ramírez., I. Aillán., D. Salas-Gonzalez, and M.Gómez-Río; “Efficient Mining of Association Rules for the Early Diagnosis of Alzheimer‟s Disease,” Physics in Medicine and Biology, 21, 56(18): 6047-63. doi: 10.1088/0031-9155/56/18/017. Epub Aug 26, 2011.
[5] L. S Joshi, V. Simha , D. Shenoy, K. R. Venugopal, and L. M. Patnaik; “Classification and Treatment of Different Stages of Alzheimer‟s Disease Uusing Various Machine Learning methods,” International Journal of Bioinformatics Research; 2010, Vol. 2, Issue 1, p. 44.