Simulation of Web Service Enabled Smart Meters
in an Event-based Infrastructure
Stamatis Karnouskos, Anastasia Izmaylova
SAP Research
Vincenz-Priessnitz-Str 1, D-76131, Karlsruhe, Germany Email:{stamatis.karnouskos,anastasia.izmaylova}@sap.com
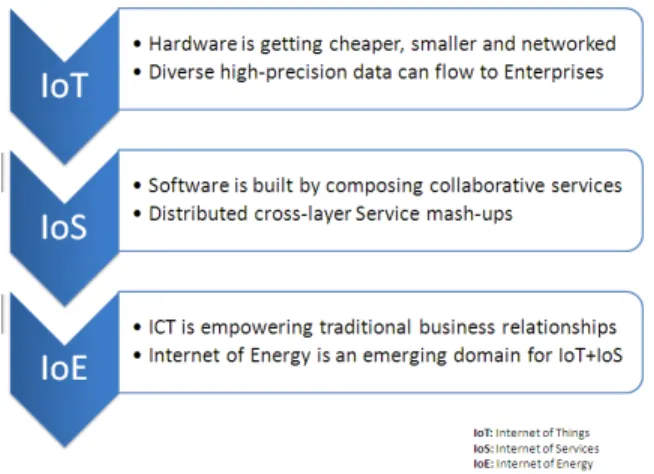
Abstract—A revolution in utilities domain is underway, namely the Internet of Energy. Networked Embedded Devices (NEDs) are making the electricity grid itself, the homes and the factories smarter, increasing the possibilities of collaboration among them. It is expected that NEDs will offer their functionality as one or more services, one of which will be a real-time measurement of the energy they consume or produce. In such highly distributed heterogeneous infrastructures it is clear that the metering goes beyond the classical understanding; it is becoming ubiquitous, distributed and will be the core for future value added services. Modeling such dynamic event-based systems is a challenging approach. We focus our work on simulating large scale in-frastructures where multiple web-service enabled devices offer metering data on an event based mode and provide some metrics for evaluating them.
I. MOTIVATION
In the future service-based Internet of energy, several al-ternative energy providers, legacy providers, businesses and households are interconnected. Via smart meters, one is able to interact with a service based infrastructure and perform actions such as selling and buying electricity. More advanced services are envisaged that will take advantage of the near real-time information flows among all participants. Furthermore the energy consuming/producing devices will be no more considered as black-boxes but will also get interconnected [1], which will provide fine-grained info e.g. energy optimization per device. Existing efforts in the emerging Internet of Things and Internet of Services, will be combined and be a crucial part in the envisioned Internet of Energy (Figure 1).
Energy Efficiency is the goal for multiple industries. In order to achieve that, the first step is to raise energy awareness. This can be achieved only if adequate methods to monitor the energy consumption and provide accurate metering results is possible. It is expected that in the years to come, any electrical device will be able to monitor its energy consumption and provide it as a service to its environment. Other devices or services could subscribe to these measurements, get them and evaluate them. Multiple uses can be considered e.g. billing of mobile entities such as electric cars, real-time adaptation of the shop-floor to lower energy consumption etc. If millions of devices are to be interconnected over Internet technologies (e.g. 6lowpan [2]) as envisioned by the Internet of Things, the metering will become a challenge. Especially if the devices offer it to numerous entities in the network over a service oriented way and in an event based modus. The stability and
Fig. 1. Internet of Energy based on Internet of Services and Internet of Things
reliability of the metering services will be critical for some business services such as billing, but more tolerable by others e.g. informational services.
II. ADVANCEDMETERINGINFRASTRUCTURE
Advanced Metering Infrastructure (AMI) refers to systems that measure, collect, and analyze energy usage, from ad-vanced devices such as electricity meters, gas meters, and/or water meters, through various communication media on re-quest or on a pre-defined schedule. These are usually referred to as “smart meters”, and can feature advanced technologies. AMI is empowering the next generation of electricity network e.g. as the one depicted in the SmartGrid www.smartgrid.eu Vision.
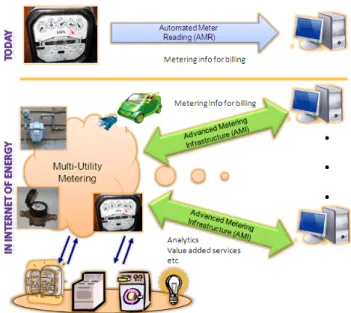
Today we see the deployment of Automated Meter Reading (AMR) related devices (depicted in the upper part of Figure 2) used for traditional billing purposes, which can merely only report their data in electronic form. This can be considered as an intermediate step towards AMI, which envisions that the meters will be more sophisticated and smart, but also be able to cooperate with other devices and network services and provide advanced functionality [3].
Smart meters empower an advanced metering infrastructure which is able to react almost in real time, provide fine-grained energy production or consumption info and adapt its behavior proactively. These smart meters will be multi-utility ones, managing not only electricity but also gas, heat, water
Fig. 2. Service-based multi-utility metering
etc., they will be able to cooperate and their services will be interacting with various systems not only for billing, but for other value added services as well (depicted in the upper part of Figure 2). New information-dependent intelligent energy management systems will be needed for an infrastructure capable of supporting the deregulated energy market. Smart meters will have to be installed for millions of households and companies and get connected to online transaction platforms. Smart meters provide new opportunities and challenges in networked embedded system design and electronics integra-tion. They will be able not only to provide (near) real-time data, but also process them and take decisions based on their capabilities and collaboration with external services. That in turn will have a significant impact on existing and future energy management models. Decision and policy makers will be able to base their actions on real-world, real-time data and not general vague predictions. Households and companies will be able to react to market fluctuations by increasing or decreas-ing consumption or production, thus directly contributdecreas-ing to increased energy efficiency.
III. SIMULATION REQUIREMENTS
Dealing with a high dynamic metering infrastructure that involves a large number of smart meters communicating in a peer-to-peer way, puts a great challenge of designing com-plex non-deterministic business behaviors where the ability of acquiring and processing real-time metering data is critical. Therefore, simulating such behaviors would significantly con-tribute in providing additional confidence in correctness and consistency of the resulting system.
In an attempt to efficiently address the goal, we decided to simulate a large number of web-service enabled smart meters and evaluate their interaction. Previous work carried out [4], [5] has been extended. As a first effort in developing such a metering infrastructure simulation framework some
requirements specifying the intended simulation environment architecture are discussed and implementation for basic behav-ioral simulation allowing for possible functional extensions is provided. Such an implementation is a first step in deriving the appropriate simulation framework and contributes some valuable estimation results.
A. Basic behavioral simulation requirements:
A future metering infrastructure is expected to deal with large networks of heterogeneous smart meters that are unstable or partially reachable e.g. joining and leaving a network, changing their location within the network and roam various networks, as would be the case of electric cars, changing their connectivity and therefore appearing to be online or offline as a result of malfunctioning or predefined life cycle maintenance [4], [5] etc. Such mobile heterogeneous smart meters with inherent volatile nature, form highly dynamic infrastructure requiring devices and their services to be dynamically discov-erable and cope with unreliability.
Integrating a metering service in business processes depends on the quality of metering information delivered. A metering simulation environment should be transparent with respect to simulated device functionality as well as generated metering data distributions. The simulation framework should also be able to use real or virtual sources of data [5] in order to reach semi-real conditions and simulate large numbers of devices. Scalability is also an issue and therefore has to be thoroughly addressed by the simulation framework.
Our first efforts focus on the ability of smart meters to expose their functionality in a service-oriented way and pro-vide real-time metering data. However, the next steps include further development of more complex and business-aware smart meters that depict additional attributes such as being autonomous (with respect to managing the attached devices), as well as cooperative (in order to better achieve their goals).
IV. TECHNOLOGYCONSIDERATIONS
Device Profile for Web Services (DPWS [6]) is a collection of web service standards that empowers embedded devices by allowing them to run web services natively. It provides:
• peer-to-peer communication of networked resource-constrained devices,
• dynamic device discovery mechanisms allowing devices to advertise themselves and their services to the network, and a network to be probed for specific devices,
• metadata exchange allowing dynamic access to device’s metadata and service descriptions through dynamic inter-pretation of WSDL and XML definitions,
• eventing mechanism allowing devices to communi-cate through asynchronous event messages in a pub-lish/subscribe manner [7].
Several projects such as SIRENA (www.sirena-itea.org), SODA (www.soda-itea.org) and SOCRADES (www.socrades. eu) provide a platform to develop a DPWS stack targeting though mostly industrial automation devices on the shop floor. Several implementations of DPWS exist in Java and
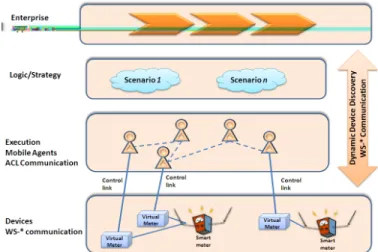
Fig. 3. Simulator Architecture: coupling of software agents and web service enabled devices
C (www.ws4d.org, www.soa4d.org), while Microsoft has also included a DPWS implementation (WSDAPI) by default in Windows Vista and Windows Embedded CE.
Using DPWS we can tackle our requirements for the intended simulation framework of a smart metering infras-tructure. We can wrap real meters as web service enabled devices and also create simulated mobile heterogeneous smart meters based on profiles (described in XML). The behavior of the meters and their services is implemented to depict their volatile nature. Furthermore the DPWS-enabled meters and their services are dynamically discoverable (due to WS-Discovery support) and totally transparent for the outside of the simulator world (meaning they are indistinguishable from any real device with respect to their behavior).
We have coupled the DPWS devices with a Multi-Agent System (MAS). This allows further development with respect to the additional requirements on simulation of more complex non-deterministic behaviors. The Java Agent Development framework (JADE [8]) was used for this purpose.
The intended metering infrastructure simulation architecture is a special case of the general three-layered architecture [5] represented in Figure 3. It is worth to note that the simulation architecture encapsulates two different communication and control mechanisms provided by MAS and DPWS which gives us additional degrees of freedom with respect to the monitoring of DPWS devices as well as their control by the respective agents (MAS level).
A. DPWS stack selection
There are several implementations of the DPWS proto-col, and our programming requirement was Java. We have therefore considered only two DPWS implementation stacks, namely the DPWS4j toolkit 0.9 (www.soa4d.org) and WS4D Java Multi Edition DPWS Stack v0.9.6 (www.ws4d.org); both of which are provided as open source implementations. Both stacks implement the same standard [6], however their philosophy as well as the features provided to the application
developer differ. Some of the differences that had an effect on our intended simulation include:
• Device development principles. One of the signifi-cant aspects that differentiates DPWS4j stack from WS4D(JMEDS) stack is the principle of creating a DPWS device. DPWS4j toolkit relies on code generation using predefined WSDL description of device services that defines operations and data types of input/output parameters. This allows automatic mapping back and forth of SOAP-XML messages and Java methods, and transparent access to remote services from a client. With the resulting code a developer is left with implementation of hosted services functionality. In contrast, a new device within WS4D framework is created only by programming means. The WSDL description of services is generated on demand when a client asks for it in order to create remote proxy objects from remote services. That results in a very dynamic framework where WSDLs can be generated, sent, received and interpreted on-the-fly al-lowing in turn automatic usage of new services. The last efficiently promotes the SOA paradigm and greatly eases the developer’s task.
• Device searching and discovery mechanism. Both stack
support the DPWS specifications with respect to the device search and discovery. However, device searching and discovery mechanisms in the WS4D stack provide flexible and optimized ways that allow specifying so-phisticated search filters, particularly Universally Unique Identifier (UUID) filter for a specific device search, and registering for listening discovery messages supporting an active device search. These mechanisms along with efficient cache memory management techniques applied for storing, and following re-usage of device metadata and its service descriptions, contribute in significantly reducing communication and processing power cost.
• Multi-Agent framework integration. The envisioned me-tering infrastructure simulation architecture integrates a Multi-Agent System on top of a DPWS metering in-frastructure that allows more complex non-deterministic behavioral simulation. The integration of the multi-agent system is much more complex with DPWS4j toolkit due to the fact that it does not presently provide direct access to device service objects after their creation, and requires developing an additional client part of an agent that provides access by means of SOAP-XML messages. In contrast, WS4D stack comes up with the architecture providing two separate classes for “hosting services” and “hosted services” according to the DPWS specification.
• Thread explosion. As we aim at simulating large scale infrastructures, performance is an issue when selecting the basic technologies. We have encountered significant differences in the two evaluated implementations. Cre-ation of a single new device with the DPWS4j stack results in creating six new threads (so n devices would require≥6n threads) that inevitably leads to early ending
of our simulation efforts with the Java Virtual Machine (JVM) throwing an “OutOfMemoryException”. This is also coupled to the predefined thread stack memory for each thread, and puts limits on scalability of the simulation framework. In contrast, WS4D framework applies specific communication mechanisms and thread checking techniques that optimize thread usage and leave approximately the same small number of threads running during simulation.
We understand that this is not a strict or detailed evalu-ation of the two stacks, and that future implementevalu-ations of them might tackle existing inefficiencies and perform better. However, at the time of our short and targeted evaluation, we resulted in using the WS4D stack to proceed with, for the reasons mentioned. The simulations described in this paper and the results obtained are reproducible with the WS4D (JMEDS) stack.
V. SIMULATION
A. Metric Definition
As pointed earlier, initial efforts in developing the simula-tion framework are focused on implementing basic behavioral simulation requirements and deriving first results that are expected to estimate feasibility of the simulation framework with respect to incorporation of Web Service enabled smart meters providing real-time metering data.
WS-Eventing provided by the DPWS stack, enables one web service to subscribe to event messages generated by another web service; this is important mechanism of the intended simulation framework. In the simulated metering infrastructure smart meters communicate through event mes-sages in a publish/subscribe manner. Timely availability of information provided i.e. metering data is of particular signif-icance as well as the reliability of such service with respect to communication. Hence, the subscription valueis estimated that we define in terms of subscription liveness, expected subscription reliability, and expected subscription relevance introduced below. Scalability is an issue that has to be thor-oughly addressed and here we approach it with respect to the number of virtual smart meters that can be simulated on a single host i.e the computer that the simulator runs. Virtual smart meters simulate one or more source smart meters at other hosts, therefore the number of valuable subscriptions that can be managed by one source smart meter has to be evaluated.
Subscription liveness.By thesubscription livenesswe mean the number of subscriptions that are not ended (therefore are alive) by a source smart meter at the end of a simulation run. The possible reasons for appearing as a virtual smart meter without subscriptions in a simulation run are unreachability of a source, or unreachability of a virtual smart meter leading to ending the established subscription after the predefined number of tries. Subscription livenessis defined as
L= nsubscriptions
N , 0≤L≤1,
whereN is the number of virtual smart meters simulated for a particular source, and nsubscriptions - the number of alive subscriptions at the end of a simulation run.
Expected subscription reliability. We define it through the number of missed event messages evaluated for every sub-scription. Such a miss depends on hardware performance, e.g. CPU, associated RAM, execution environment e.g. OS, Java Platform, DPWS implementation, network capabilities e.g. transfer rate, transmission delays etc. We defineexpected subscription reliabilityas R= 1 N0 N0 X i=1
n(i)received events n(i)generated events
, 0≤R≤1,
whereN0is the number of virtual smart meters come up with established subscriptions, n(i)received events is the number of events received by a virtual smart meter with thei-th subscrip-tion, andn(i)generated events is the number of events generated by a source smart meter for the i-th subscription. Note the assumption ofn(i)received events ≤n(i)generated events, i= 1..N0. This can be violated in some particular cases e.g. in the case of malicious intrusion resulting in more (possibly duplicate) events received than the ones generated (e.g. at replay attacks). Such a metric can be used as a warning signal that abnormal behavior is detected in the network and that possibly security-issues need to be checked. The usage of WS-Reliability and/or WS-Security in this context needs to be investigated.
Expected subscription relevance. The intended advanced metering infrastructure deals with real-time metering data carrying some business critical information. Therefore, data availabilitythat can be estimated as follows
A=L·R, 0≤A≤1
has to be defined more precisely by considering subscription processing time factor. This factor refers to the time required for preparing, sending, receiving and handling messages spec-ified by the DPWS specification framework, managing HTTP connections, transmission delays, etc. In turn, it determines relevance factor of metering data by estimating the time difference,∆t(e(i))
, between a measurement generation and its reception at destination, wheree(i)denotes an event message received by a virtual smart meter with the i-th subscription. Thisrelevance factorcan be introduced in terms ofrelevance interval:
Irelevance= [0,∆t],
as a condition of discarding event messages, so that e(i) is defined to berelevant if∆t(e(i))∈Irelevance. This results in two sets,Erelevant(i) andEirrelevant(i) , of relevant and irrelevant event messages, correspondingly, such that
E(i)=Erelevant(i) ∪E(i)irrelevant, E(i)relevant∩Eirrelevant(i) =∅,
whereE(i) - set of all event messages received with thei-th subscription.
TABLE I INITIALESTIMATIONS
Number of simulated smart meters,N 5000 10000
Subscription Liveness,L ≈0.999 ≈0.983
Expected subscription reliability,R ≈0.999 ≈0.996
Data availability,A=L·R ≈0.999 ≈0.979
TABLE II
FORN= 5000SIMULATED SMART METERS
Expected Subscription Relevance,Rel
≈0.754,∆t= 1min ≈1.0,∆t= 30min ≈1.0,∆t= 60min Subscription Value,V al ≈0.746,∆t= 1min ≈0.999,∆t= 30min ≈0.999,∆t= 60min
Finally, theexpected subscription relevanceis defined as
Rel= 1
N0
N0 X
i=1
n(i)relevant events n(i)received events
, 0≤Rel≤1,
wheren(i)relevant events is the number of received events con-sidered as relevant with respect to the predefined relevance interval Irelevance, and refers to the cardinality of the set
Erelevant(i) bringing to equivalent representation
Rel= 1 N0 N0 X i=1 |E(i)relevant| |E(i)| , 0≤Rel≤1,
Subscription value. Now we can estimate subscription value defined as
V al=Rel·L·R, 0≤V al≤1.
Estimations of a subscription value as well as separate evaluations of subscription liveness, expected subscription reliability,expected subscription relevancestress optimization issues that have to be addressed in underpinned hardware, software, and DPWS implementation decisions.
B. Evaluation
In the first simulation tests, scenarios of creating populations ranging from 5000 to 10000 virtual smart meters simulated at one host with one or two source smart meters managed by another host were run. Virtual smart meters were created at the machine of the following configuration: 64-bit Linux, Intel®Core™2 Duo CPU 6600, 2.4GHZ (x64), 8GB RAM, 64-bit SUN Microsystems Java SE v1.6.
Depending on the required number of virtual smart meters being created the following estimations were derived:
Subscription liveness:L≈0.983 for N = 10000 contribu-tion of the ended subscripcontribu-tions ≈0.005 whereas contribution of not established subscriptions≈0.017.
When estimating expected subscription relevance, the rele-vance intervalswere considered, and the corresponding results that were derived are depicted in Table II and Table III.
TABLE III
FORN= 10000SIMULATED SMART METERS
Expected Subscription Relevance,Rel
≈0.748,∆t= 1min ≈1.0,∆t= 30min ≈1.0,∆t= 60min Subscription Value,V al ≈0.732,∆t= 1min ≈0.979,∆t= 30min ≈0.979,∆t= 60min
Estimation results for the expected subscription relevance highly depend on performance characteristics allocated to a source smart meter managing subscriptions, and can lead to very low values due to the time difference between data generation and reception at destination. This difference e.g. for a population of 10000 smart meters with respect to different performance characteristics could vary from 3 minutes to several hours, especially when all thousands of meters are generating events at a high rate (e.g. every 1 sec).
When dealing with metering data being generated in real-time, the event queuing problem can be faced in large in-frastructure simulation runs. The subscription management time increases with the number of virtual smart meters being created that results in exceeding a data generation rate at some point of time. This first effort metering simulation framework is not aimed to address this issue and avoids it in its design by putting limits on data generation rate with lower limit of 5 milliseconds and upper limit depending on the time required to handle all actual subscriptions, i.e. a new measurement is not generated till a current event is notified to all pending subscribers, or 5 milliseconds is timed out. Such a design choice simplifies estimating expected time of a subscription handling, and subscription management time stability of the resulting simulated infrastructure.
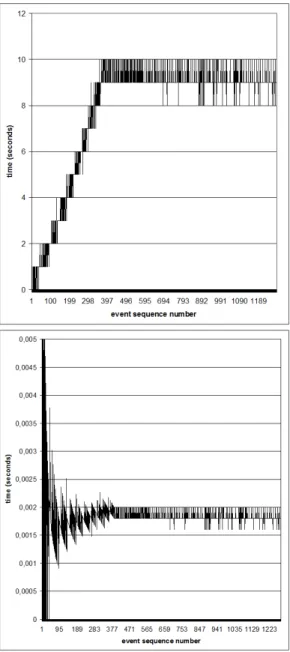
The estimations ofexpected time of a subscription handling derived for the simulated infrastructure of 5000 virtual smart meters resulted in a value of ≈ 0.002 seconds that can be further affected by subscription handling time deviations depicted during the simulation run for particular events, and presented in upper part of Figure 4. The established infras-tructure stability estimation with respect to the time required for handling all subscriptions depicted for particular events is shown in lower part of Figure 4.
The conducted tests have shown that even in the stable presence ofdata availability,expected subscription relevance can be very low and considered as one of the main weaknesses of our first efforts in this simulation framework. During simulation framework tests some performance characteristics were monitored that influence measures discussed above, especially,expected subscription relevanceand, therefore, the finalsubscription value.
VI. CONCLUSION ANDFUTUREDIRECTIONS
In order to achieve energy efficiency we need to be able to accurately measure energy. The smart metering capabilities of the devices of the future, are expected to host at a metering
Fig. 4. System performance: Simulation of 10000 virtual smart meters
service and offer it over an event based infrastructure. We have simulated and evaluated large numbers of such web-service enabled devices using multi-agent systems and the web services on embedded devices via the usage of the DPWS protocol. Several characteristics have been measured and evaluated; the results show that a single device can offer its metering data to thousands that subscribe to it, however with the number of subscriptions increasing so does the need for more computational power and memory. The exact equilibrium up to which the device can handle by itself the requests and the turning point that this functionality will be delegated to another possibly more powerful device e.g. a mediator will depend on several parameters, including the hardware and software capabilities as well as the dependability requirements and the role of the device. Future steps include several issues that have been touched through this paper, most notably, further
evaluating the performance of the DPWS as well as that of similar approaches e.g. REST [9], in different infrastructures e.g. over IPv6, or unstable wireless links. Security has not been addressed, and is critical for any real deployment of smart meters [10]; as such of great interest is also the impact of WS-Security or WS-Reliability. Furthermore we want to simulate more complex approaches where large populations reside in distributed hosts, and in different network segments. Finally the enterprise application behavior and performance needs to be evaluated with respect to dynamic discovery, device management, subscription dependability etc over such large scale heterogeneous infrastructures.
ACKNOWLEDGMENT
The authors would like to thank the European Commis-sion and the partners of the SOCRADES (www.socrades.eu), SmartHouse/SmartGrid (www.smarthouse-smartgrid.eu), and CONET (www.cooperating-objects.eu) projects for their sup-port.
REFERENCES
[1] C. Bennett and D. Highfill, “Networking ami smart meters,” inProc.
IEEE Energy 2030 Conference ENERGY 2008, 17–18 Nov. 2008, pp.
1–8.
[2] J. W. Hui and D. E. Culler, “Extending ip to low-power, wireless personal area networks,”IEEE Internet Computing, vol. 12, no. 4, pp. 37–45, July–Aug. 2008.
[3] S. Karnouskos, O. Terzidis, and P. Karnouskos, “An advanced metering infrastructure for future energy networks,” in IFIP/IEEE 1st International Conference on New Technologies, Mobility and Security
(NTMS 2007). Springer, 2007, pp. 597–606. [Online]. Available:
http://dx.doi.org/10.1007/978-1-4020-6270-4 49
[4] S. Karnouskos and M. M. J. Tariq, “An agent-based simulation of soa-ready devices,” in Proc. Tenth International Conference on Computer
Modeling and Simulation (UKSIM) 2008, 1–3 April 2008, pp. 330–335.
[5] S. Karnouskos and M.-M. J. Tariq, “Using multi-agent systems to simulate dynamic infrastructures populated with large numbers of web service enabled devices,” inThe 9th International Symposium on
Au-tonomous Decentralized Systems (ISADS 2009), Athens, Greece, March
23-25 2009.
[6] S. Chan, C. Kaler, T. Kuehnel, A. Regnier, B. Roe, D. Sather, J. Schlimmer, H. Sekine, D. Walter, J. Weast, D. Whitehead, and D. Wright, “Devices profile for web services,” Microsoft Developers Network Library, May 2005, http://specs.xmlsoap.org/ws/2005/05/devprof/devicesprofile.pdf. [7] F. Jammes, A. Mensch, and H. Smit, “Service-oriented device
com-munications using the devices profile for web services,” inProc. 21st International Conference on Advanced Information Networking and
Applications Workshops AINAW ’07, vol. 1, 21–23 May 2007, pp. 947–
955.
[8] F. L. Bellifemine, G. Claire, and D. Greenwood,Developing Multi-Agent
Systems with JADE. Wiley & Sons;, 2007.
[9] C. Pautasso, O. Zimmermann, and F. Leymann, “Restful web services vs. ”big”’ web services: making the right architectural decision,” inWWW ’08: Proceeding of the 17th international conference on World Wide Web. New York, NY, USA: ACM, 2008, pp. 805–814.
[10] F. M. Cleveland, “Cyber security issues for advanced metering in-frasttructure (ami),” inProc. IEEE Power and Energy Society General Meeting - Conversion and Delivery of Electrical Energy in the 21st