Jieyan Fang
An Analysis of the Mutual Fund Industry: Mutual
Fund Investors, Mutual Fund Managers and Mutual
Fund Companies
Inauguraldissertation
zur Erlangung des akademischen Grades
eines Doktors der Wirtschaftswissenschaften
der Universität Mannheim
Dekan: Dr. Jürgen M. Schneider
Referent: Professor Dr. Stefan Ruenzi
Korreferent: Professor Dr. Erik Theissen
This dissertation was completed at the University of Mannheim by mid 2012. It would not have been successfully finished without the guidance and the help of many people. Therefore, I would like to thank those people for their valuable contribution and assistance.
First and foremost, I would like to express my deepest gratitude to my supervisor, Prof. Dr. Stefan Ruenzi, for his excellent guidance in the completion of my dissertation and offering me a brilliant atmosphere for doing research.
I appreciate remarks and comments by Prof. Dr. Erik Theissen, my second examiner.
I would also like to thank Dr. Knut Griese and Prof. Dr. Alexandra Niessen-Ruenzi for their valuable comments and insights. Discussions with them always helped me to revise and improve my dissertation.
I also very appreciate my current and former colleagues, Alexander Hillert for his outstanding support in the data collection, Dr. Knut Griese, Dr. Kerstin Drachter, Dr. Philipp Finter, Dr. Meike Hagemeister and Daniel Simon for surviving tough times and enjoying good times together.
My special thanks go to Stephen Huntze for his excellent proofreading and several student assistants for their support in manually collecting the data needed.
Last but not the least, I would like to thank my parents Yin Zhou and Jing Fang for their loving support and encouragement throughout my whole life. Without them this thesis would have never been completed.
CONTENTS
1. GENERAL INTRODUCTION ... 1
1.1. Motivation and Background ... 1
1.2. Levels of Analysis ... 5
1.3. Main Research Questions and Main Results ... 8
2. RAPID TRADING AMONG GERMAN EQUITY FUNDS ... 14
2.1. Introduction ... 14
2.2. Data and Methodology... 18
2.3. Results ... 22
2.3.1. Performance Flow Relationship ... 23
2.3.2. Evidence of Rapid Trading ... 27
2.3.3. Determinants of Rapid Trading ... 31
2.3.3.1. Proxies for Rapid Trading ... 31
2.3.3.2. Proxies for Rapid Trading over a Year ... 32
2.3.3.3. Determinants of Rapid Trading and Explanations ... 33
2.3.4. Influence of Rapid Trading ... 40
2.4. Conclusion ... 45
3. SMART OR DUMB? ASSET ALLOCATION ABILITY OF MUTUAL FUND INVESTORS AND THE ROLE OF BROKER ADVICE ... 48
3.1. Introduction ... 48
3.2. Data and Methodology... 52
3.2.1. Data ... 52
3.2.2. Summary Statistics ... 53
3.2.3. Measurement of Asset Allocation Ability... 55
3.2.4. Significance Tests ... 60
3.3. Empirical Results ... 60
3.3.1. Asset Allocation Ability of Aggregate Mutual Fund Investors ... 60
3.3.1.2. Evidence from New Cash Flows ... 61
3.3.2. Asset Allocation Ability in Different Broker Channels ... 64
3.3.2.1. Evidence from Total Net Assets ... 64
3.3.2.2. Evidence from New Cash Flows ... 65
3.4. Additional Analysis ... 68
3.5. Conclusion ... 69
4.
FUND MANAGER ALLOCATION ... 70
4.1. Introduction ... 70
4.2. Data ... 74
4.3. Market Efficiency and Average Fund Performance of the Investment Grade and the High Yield Corporate Bond Market ... 76
4.4. Managerial Skill, Market Efficiency and Fund Performance ... 78
4.5. Manager Allocation ... 81
4.6. Conclusion ... 84
5.
ENTREPRENEURSHIP IN THE MUTUAL FUND INDUSTRY ... 86
5.1. Introduction ... 86
5.2. Constructing the Dataset ... 91
5.3. Empirical Design ... 94
5.4. Results ... 98
5.4.1. Managerial Characteristics of Entrepreneurs ... 98
5.4.2. Change in Behavior Due to the Transition from Agent to Principal... 106
5.5. Conclusion ... 108
APPENDICES ... 109
LIST OF TABLES
Table 2.1: Descriptive statistics ... 19
Table 2.2: Types of funds of the anonymous fund company and the enlarged sample .... 22
Table 2.3: Description of control variables ... 24
Table 2.4: Performance flow relationship ... 25
Table 2.5: Relationship between inflows and outflows ... 29
Table 2.6: Relationship between inflows and outflows - sector funds & country funds .. 30
Table 2.7: Rapid Trading in each calender month ... 32
Table 2.8: Fund characteristics of rapid trading deciles ... 34
Table 2.9: Determinants of rapid trading ... 36
Table 2.10: Influence of rapid trading on fund performance ... 42
Table 3.1: Summary statistics ... 54
Table 3.2: Average asset allocation weights of different portfolios ... 54
Table 3.3: Sharpe ratio of different portfolios with four asset classes ... 60
Table 3.4: Performance of net cash flow portfolios for all fund CF portfolio and the CF benchmark ... 62
Table 3.5: Sharpe ratio of different sales channel portfolios with four asset classes ... 64
Table 3.6: Performance of net cash flow portfolios for different sales channels, especially non-proprietary vs. proprietary brokers ... 66
Table 3.7: Performance and risk of asset allocation fund portfolio and other portfolios with four asset classes ... 68
Table 4.1: Summary statistics ... 75
Table 4.2: Average performance of corporate bond funds ... 78
Table 4.3: Impact of GMAT on alpha: overall analysis ... 79
Table 4.4: Impact of GMAT on alpha: segment specific analysis ... 81
Table 4.5: Impact of GMAT on segment assignment ... 82
Table 5.1: New startups and founders (1980-2009) ... 92
Table 5.2: Founder characteristics vs. non-founder characteristics ... 94
Table 5.4: Demographic characteristics, education and experience of would-be
entrepreneurs ... 100
Table 5.5: Behavior and trading activity of would-be entrepreneurs ... 104
Table 5.6: Media coverage of would-be entrepreneurs... 105
LIST OF FIGURES
Figure 1.1: Development of the worldwide mutual fund industry from 1998 to 2010 ... 3 Figure 1.2: Development of the mutual fund industry in the U.S. and in Germany from
1998 to 2010 ... 4 Figure 2.1: Average monthly relative net flows, relative inflows and relative outflows ... 21 Figure 5.1: Number of startups and founders in different years ... 93
LIST OF VARIABLES
Chapter 2
α : Regression constant
β: Regression coefficient
k
δ : Regression coefficient of kth piece in piecewise linear regressions
γ : Regression coefficient vector of control variables
ε: Residual from a regression model
2
.
Adj R : Adjusted coefficient of determination from a regression
model
,
Asia i m
D : Dummy variable that takes on the value 1 when fund i has an investment focus in Asia in month m, 0 otherwise
,
Int i m
D : Dummy variable that takes on the value 1 when fund i is an internationally investing fund in month m, 0 otherwise
,
i m
EuroOF : Euro outflows of fund i in month m
,
i m
EuroIF : Euro inflows of fund i in month m
,
i m
ExR : Excess return of fund i in month m compared to the average return of all other funds in the same market segment and month
,
i m
FrontFee : Front-end load of fund i in month m
,
i m
IF : Growth rate of inflows of fund i in month m
,
lnAgei m: Natural logarithm of age (in months) of fund i at the end of month m
,
lnTNAi m: Natural logarithm of total net assets (in Euro) of fund i at the end of month m
,
i t
,
i m
NF : Growth rate of net flows of fund i in month m
,
i m
OF : Growth rate of outflows of fund i in month m
,
i m
P : Net asset value per share of fund i in month m
,
i m
Perf : Performance of fund i in month m
,
i m
R : Net return of fund i in month m 2
R : Coefficient of determination from a regression model
,
1i m
RT : Proxy 1 for Rapid Trading of fund i in month m
,
2i m
RT : Proxy 2 for Rapid Trading of fund i in month m
,
_ i m
Seg NF : Growth rate of net flows of the segment which the fund i
belongs to in month m (without fund i)
1 ,
J i m
SegRank : The relative rank of the return of a fund i compared to the return of all other funds in the same market segment in the 12 months prior to month m
1 ,
J i m
Std : Return standard deviation of a fund i in the last 12 months, i.e. from month m-12 to the end of month m-1
( )
1 i m,Tercile : The bottom piece in the piecewise linear regression based on
performance rank of fund i in month m among all funds which belong to the same segment like fund i
( )
2 , i mTercile : The middle piece in the piecewise linear regression based on
performance of fund i in month m among all funds which belong to the same segment like fund i
( )
3 , i mTercile : The highest piece in the piecewise linear regression based on
performance of fund i in month m among all funds which belong to the same segment like fund i
,
i m
TNA : Total net assets (in Euro) of fund i at the end of month m Y: A vector of control variables
Chapter 3
α : Regression constant
β: Regression coefficient
ε: Residual from a regression model t
AverageTNA: The average of the TNA at the beginning of month t and the
TNA at the end of month t
t
Inflow : Inflows in a certain asset class in month t
,
i t
NCF : Net cash flow in asset class i in month t
,
i t
NegNF : Negative cash flows of asset class i in month t
t
Outflow: Outflows in a certain asset class in month t
,
i t
PosNF : Positive cash flows of asset class i in month t
neg t
R : The average return earned on negative net cash flows in month t
overall
R : The overall average return earned on $1 net cash flows over the entire sample period, 1996-2009
pos t
R : The average return earned on positive net cash flows in month t
,
h i t
r : h-month return on asset class ih months after t
t
R: The average return earned on net cash flows in month t
i
Turnover: Turnover ratio of asset class i in month t
T: Number of months
Chapter 4
α : Regression constant
ε: Residual from a regression model
Γ: Regression coefficient matrix of the lagged index changes
φ: Cumulative normal distribution
(
i)
CV Manager : Vector of control variables of manager i
CFA i
D : Dummy variable that takes on the value 1 when manager i
has a CFA, 0 otherwise CPA
i
D : Dummy variable that takes on the value 1 when manager i
has a CPA, 0 otherwise HY
i
D : Dummy variable that takes on the value 1 when fund i is an high yield fund in month m, 0 otherwise
OtherMaster i
D : Dummy variable that takes on the value 1 when manager i
has a non-MBA master's degree, 0 otherwise OtherDegree
i
D : Dummy variable that takes on the value 1 when manager i
has another post-graduate degree i
GMATDEV: Deviation between a manager's GMAT and the average
GMAT of all managers employed by the fund family (both divided by 100)
i
GMATRANK : GMAT rank of manager i across all managers employed by
the same fund management company at the assignment date
,
_ i t
Expense ratio : Expense ratio of fund i in month t
,
i t
Exp : Experience of the manager of fund i in month t, measured in years
,
lnAgei t: Natural logarithm of age (in years) of fund i in month t
,
Chapter 5
,
i m
α : Regression constant from a factor model for fund i in month
m ,
i m
ε : Residual from a regression model for fund i in month m
bond t
ε : Residual from a regression model for bond index return change in day t
cds t
ε : Residual from a regression model for CDS index premium change in day t
,
i t
Activeshare : Asset weighted average of active share of all funds managed
by the manager i in year t
,
i t
Age : Age of manager i in year t
,
_ 4 _ i t
C alpha gross : Asset weighted average of gross Carhart four factor alpha of
all funds managed by manager i in year t
_
Dummy gender: Dummy variable that takes on the value 1 when manager i is
a male, 0 otherwise
_
Dummy mba: Dummy variable that takes on the value 1 when manager i
has a MBA degree, 0 otherwise
_ _
Dummy other master: Dummy variable that takes on the value 1 when manager i
has a non-MBA master's degree, 0 otherwise
_
Dummy PhD: Dummy variable that takes on the value 1 when manager i
has a PhD degree, 0 otherwise
_
Dummy professional: Dummy variable that takes on the value 1 when manager i
has a professional designation i.e. CFA, 0 otherwise
,
i t
Entrepreneur : Dummy variable that takes on the value 1 when manager i
becomes entrepreneur in year t, and 0 otherwise
,
_ _ i t
Ex peer grossret : Asset weighted average excess peer group gross return of all
,
_ 3 _ i t
FF alpha gross : Asset weighted average of gross Fama-French three factor
alpha of all funds managed by the manager i in year t
,
_ _ _ i t
fraction of sole fund : Fraction of sole managed funds of manager i in year t
,
i t
Gross_Return : Asset weighted average gross return of all funds managed by
the manager i in year t
_ _ t
Growth rate MF : Growth rate of U.S. mutual fund market in year t
,
_ i t
Jensenalpha gross : Asset weighted average of gross Jensen's one factor alpha of
all funds managed by the manager i in year t
,
lnsumTNAi t: Natural logarithm of sum of net assets of all funds managed
by the manager i in year t
, 1,
_ i t t n
Media Coverage − − : Number of newspaper articles which mention fund manager i
in the n years prior to t.
_ t
Market return: Market return in year t.
_ _ t
No of funds: Number of funds managed by manager i in year t
_ _ t
No of IPO : Number of IPOs in year t
,
_ _ i t
No of seg : Number of different segments which funds managed by
manager i belong to in year t
,
_ _ i t
Seg adj IR : Asset weighted average of segment-adjusted investment restriction of permitted investment practices of all funds managed by the manager i in year t
,
_ _ i t
Seg adj STD : Asset weighted average of segment-adjusted past annualized standard deviation of the fund return time series of all funds managed by the manager i in year t
,
_ _ i t
Seg adj Turnover : Asset weighted average of segment-adjusted turnover ratio of
,
_ _ i t
Seg adj Utilization : Asset weighted average of segment-adjusted utilization of
permitted investment practices of all funds managed by the manager i in year t
,
_ i t
Style extremity : Asset weighted average style extremity of all funds managed
by the manager i in year t
,
_ _ i t
Style extremity SMB : Asset weighted average SMB-style extremity of all funds
managed by the manager i in year t
,
_ _ i t
Style extremity HML : Asset weighted average HML-style extremity of all funds
managed by the manager i in year t
,
_ _ i t
Style extremity MOM : Asset weighted average Momentum-style extremity of all
funds managed by the manager i in year t
,
_ i t
Style extremity : Asset weighted average style extremity of all funds managed
by the manager i in year t
,
_ i t
Sum percentageFlow : Sum of percentage flows of all funds managed by the
manager i in year t.
,
i t
Tenure : Tenure of manager i in the fund industry in year t
,
i t
LIST OF ABBREVIATIONS
ABBB: Arellano/Bond-Bover/Blundell estimator AMEX: American stock exchange
AR: Auto regression
BaFin: Bundesanstalt für Finanzdienstleistungsaufsicht
BM: Benchmark
BVI: Bundesverband Investment und Asset Management e.V. CDS: Credit default swap
CEO: Chief executive officer
CF: Cash flow
CFA: Chartered financial analyst CIC: Chartered investment counselor CPA: Certified public accountant CRE: Clustered robust standard error CRSP: Center for research in security prices
Dif: Difference
ETF: Exchange traded funds Form N-SAR: Form N, semi-annual report
GMAT: Graduate management administration test GMM: Generalized method of moments
HY: High yield
ICI: Investment company institute
IG: Investment grade
IPO: Initial public offering
MBA: Master of business administration MSCI: Morgan Stanley capital international
NASDAQ: National association of securities dealers automated quotations NAV: Net asset value
NYSE: New York stock exchange OLS: Ordinary least squares
PCSE: Panel-corrected standard errors PhD: Doctor of Philosophy
Prop: Proprietary brokers
SEC: Securities and exchange commission Syst.: Simultaneous equation system TNA: Total net asset
U.S.: United States USD: United States dollar VAR: Vector autoregressive
1. General Introduction
Chapter 1
General Introduction
1.1. Motivation and Background
In this dissertation I investigate the mutual fund industry, especially the three most important participants within this industry: mutual fund investors, mutual fund companies and mutual fund managers. Mutual fund investors are persons who purchase and redeem fund shares. Mutual fund companies are financial service providers which are responsible for fund administration, e.g. setting up the fund, bookkeeping, collecting fees and preparing annual reports, and they also hire mutual fund managers to manage funds. Mutual fund managers are professionals who are responsible for the portfolio management. They make the actual portfolio decisions, e.g. which stocks are bought and sold, and are therefore mainly responsible for the performance of mutual funds. These three main participants have already been the subject of investigation in the existing literature. The aim of this dissertation is to examine new research questions in terms of the three main participants in order to obtain a deeper understanding of the mutual fund industry.
For several decades, the mutual fund industry has been of interest to researchers. This interest has been intensified by the fast development of the mutual fund industry, especially in the 1980s and 1990s. Different groups of investors have contributed to this rapid growth:
private investors, businesses and institutional investors. For example, at the end of 2010 mutual funds accounted for about 50% of the retirement assets of all households in the U.S. More and more businesses and institutional investors are also investing in mutual funds, as for instance money market funds can be used as appropriate products to manage cash and short-term assets. Furthermore, due to the large amount of assets under management in the mutual fund industry, mutual funds have become the largest owner of financial securities in the U.S. Based on the ICI fact book 2011, at the end of 2010 mutual funds held 23% of U.S. corporate equity, 12% of U.S. and foreign corporate bonds, 11% of U.S. treasury and government agency securities, 29% of U.S. municipal securities and 45% of all commercial papers. Worldwide capital markets can be significantly influenced by mutual funds and especially by participants in the mutual fund industry. Therefore, investigations into the mutual fund industry are becoming more common.
The rapid growth of the mutual fund industry can be explained by the various advantages mutual funds offer. By investing in mutual funds, investors can obtain better diversification opportunities. They can also acquire access to new asset classes and new securities which they are not able to invest in by themselves. Mutual funds also provide liquidity for investors. Mutual fund investors can purchase and redeem fund shares on a daily basis. Furthermore, there is no issuer risk associated with investing in mutual funds, since fund assets are legally separate. They are bankruptcy remote from the fund company and fund manager. We can observe the rapid growth of the mutual fund industry in Figure 1.1.
Figure 1.1 shows that the number of mutual funds increased from 50,266 in 1998 to 69,519 in 2010. Apart from the years during the global financial crisis, 2008 and 2009, total net assets have also been steadily increasing from 1998 to 2010. At the end of 2010 the number of funds increased by 38% as compared to 1998 and reached its record peak. The total net assets almost rebounded to the historical high in 2007.
The most important mutual fund market is the U.S. market. It accounts for about 50% of the worldwide mutual fund market. The German mutual fund market is relatively small, but it also experienced very fast development from 1980 to 2010. The development of the mutual fund markets in the U.S. and in Germany is shown in Figure 1.2.
Figure 1.1: Development of the worldwide mutual fund industry from 1998 to 2010
This figure shows the development of the worldwide mutual fund industry for the time period 1998 to 2010. The data of total net assets and number of funds are obtained from the ICI (Investment Company Institute).
We can observe a similar development of both of these mutual fund markets in terms of total net assets and number of fund share classes. In the U.S. the assets of mutual funds increased from $135 billion in 1980 to $11,820 billion in 2010 with equity funds as the most important fund category. At end of 2010 almost 50% of mutual fund assets were invested in equity funds.
Due to the increasing interest in the mutual fund industry worldwide, it is especially important to investigate the different participants in the mutual fund industry: mutual fund investors, mutual fund companies, and mutual fund managers. In this context important questions arise: How do mutual fund investors behave when they trade mutual funds? Do they exhibit asset allocation ability in terms of mutual fund purchases? Do mutual fund companies allocate their fund managers in an efficient way in order to generate better performance for investors and higher profitability for themselves? What does the career path of a mutual fund manager look like?
0 10.000 20.000 30.000 40.000 50.000 60.000 70.000 80.000 $0 $5.000 $10.000 $15.000 $20.000 $25.000 $30.000 1998 1999 2000 2001 2002 2003 2004 2005 2006 2007 2008 2009 2010
Figure 1.2: Development of the mutual fund industry in the U.S. and in Germany from 1998 to 2010
This figure shows the development of the mutual fund industry in the U.S. and in Germany for the time period 1980 to 2010. The data of total net assets and number of funds are obtained from the ICI (Investment Company Institute) and BVI (Bundesverband Investment und Asset Management e.V.).
0 5.000 10.000 15.000 20.000 25.000 $0 $2.000 $4.000 $6.000 $8.000 $10.000 $12.000 $14.000 1 9 8 0 1 9 8 1 1 9 8 2 1 9 8 3 1 9 8 4 1 9 8 5 1 9 8 6 1 9 8 7 1 9 8 8 1 9 8 9 1 9 9 0 1 9 9 1 1 9 9 2 1 9 9 3 1 9 9 4 1 9 9 5 1 9 9 6 1 9 9 7 1 9 9 8 1 9 9 9 2 0 0 0 2 0 0 1 2 0 0 2 2 0 0 3 2 0 0 4 2 0 0 5 2 0 0 6 2 0 0 7 2 0 0 8 2 0 0 9 2 0 1 0
Mutual fund market in the U.S.
Total net assets (billions of U.S. dollars) Number of fund share classes
0 1000 2000 3000 4000 5000 6000 7000 €0 €100 €200 €300 €400 €500 €600 €700 €800 1 9 8 0 1 9 8 1 1 9 8 2 1 9 8 3 1 9 8 4 1 9 8 5 1 9 8 6 1 9 8 7 1 9 8 8 1 9 8 9 1 9 9 0 1 9 9 1 1 9 9 2 1 9 9 3 1 9 9 4 1 9 9 5 1 9 9 6 1 9 9 7 1 9 9 8 1 9 9 9 2 0 0 0 2 0 0 1 2 0 0 2 2 0 0 3 2 0 0 4 2 0 0 5 2 0 0 6 2 0 0 7 2 0 0 8 2 0 0 9 2 0 1 0
Mutual fund market in Germany
In the following section I will briefly describe the three participants in the mutual fund industry and my respective research findings.
1.2. Levels of Analysis
1.2.1. Mutual Fund Investors
A large number of papers investigate the determinants of purchases and redemptions of mutual fund investors. One of the most important factors is the past performance of mutual funds. Spitz (1970) finds a positive relationship between past performance and fund flows. Ippolito (1992) and Sirri and Tufano (1998) identify a convex performance flow relationship in the U.S. Since this convex relationship is well documented in different countries. e.g., Ber, Kempf and Ruenzi (2007) find similar evidence for the German mutual funds. This convex relationship suggests that mutual fund investors buy funds with the best performance ranks. However, they do not punish the funds with a bad past performance rank by redeeming them. Different studies have tried to explain this asymmetric relationship. Generally, there are two groups of explanations: rational and irrational.
Goetzmann and Peles (1997) explain the convex performance flow relationship with cognitive dissonance. They argue that investors who bought a fund that performs poorly do not want to admit their failure and thus continue to hold it. That is one reason why we do not observe punishment of bad performance. Ippolito (1992) explains the convexity with a rational argument: transaction costs. Transaction costs for mutual funds are important. Mutual fund investors face front-end and back-end loads when they purchase and redeem fund shares. Such transaction costs prevent investors from redeeming fund shares with bad performance.1
Another important strand of literature focuses on the ability of mutual fund investors to choose funds with superior future performance. Gruber (1996) and Zheng (1999) find evidence of a short-term smart money effect, which means that mutual fund investors are able to pick funds with superior short-term future performance. However, Sapp and Tiwari (2004) argue that this smart money effect is not due to superior picking abilities of
1 Other rational explanations for the convex performance flow relationship can be found in Berk and Green (2004), Sirri
investors and can rather be explained by stock momentum. Furthermore, Frazzini and Lamont (2008) find a long-term dumb money effect, which means that mutual fund investors record worse performance in the long-term due to repeated switching among different mutual funds. The timing ability of mutual fund investors is investigated by Friesen and Sapp (2007) and Braverman, Kandel and Wohl (2005). Both studies find evidence of poor timing ability among mutual fund investors.
1.2.2. Mutual Fund Companies
Mutual fund companies play a central role in the mutual fund industry. The goal of mutual fund companies is to maximize profits, which are mainly generated by fees charged on the assets under management. Mutual fund companies make important decisions, establish product policy, assign managers to funds, etc. These decisions can considerably influence fund performance, investor behavior and manager behavior.
Massa (2003) investigates the decisions of mutual fund companies regarding their product policies. He finds that in order to attract investors, mutual fund companies provide investors the option to switch across their funds for free. Khorana and Servaes (2004) examine the competition among mutual fund companies. They find that mutual fund companies gain a higher market share if they charge lower fees than their competitors. Furthermore, marketing and distribution fees have a positive influence on their market share. In addition, fund companies which provide a wide range of products can increase their market share.
Jain and Wu (2000) investigate fund advertising. They find that advertised funds do not have superior performance in the post-advertisement period, which means advertisements are non-informative and cannot help investors to identify funds with superior performance. However, they do find evidence of a positive impact of advertisement on individual fund flows. Advertised funds can attract investors' money more easily than funds without advertisement. Gallaher, Kaniel and Starks (2006) also examine advertisements in the mutual fund industry. However, the focus of their analyses lies on the fund company level. They find a convex relationship between company level flows and company level advertising expenditures. This implies that in order to obtain more flows through
advertising, mutual fund companies should be one of the top advertisers as compared to other mutual fund companies.
Furthermore, mutual fund companies also make strategic decisions in terms of the fund management structure. Bär, Kempf and Ruenzi (2011) investigate the difference between team management and sole management of mutual funds. They find that once a fund management company chooses one type of management structure, this type is often applied to all funds managed by that company. They also investigate differences in terms of management behavior and performance, concluding that team management is characterized by a lower risk level than sole management. Team managed funds also show less style extremity than sole managed funds. Regarding the performance difference, they find weak evidence of a negative impact of team management on fund performance. However, the performance of team managed funds shows higher persistence as compared to sole managed funds. Massa, Reuter and Zitzewitz (2010) investigate named managers and anonymous managers. They argue that fund companies can benefit from the disclosure of manager names, since managers have a higher incentive to perform well when their names are associated with the funds. The name of a successful fund manager can also provide marketing benefits, which in turn can lead to higher inflows. However, these benefits are not free: If the named managers are successful, their bargaining power increases, which can allow them to get more rents from the fund management companies. Named managers are found to have more media coverage and high inflows, and the departure of such a manager can reduce fund inflows significantly.
1.2.3. Mutual Fund Managers
Mutual fund managers are responsible for portfolio management. An important strand of literature focuses on the impact of the fund managers' personal characteristics on fund performance. For example, Baks (2003) finds that the contribution of managers' qualities to the fund performance varies between 10% and 50%. Golec (1996), Chevalier and Ellison (1999a) and Ding and Wermers (2004) find that certain attributes, such as age, education and experience, have a significant impact on fund performance. Golec (1996) and Chevalier and Ellison (1999a) show that the age of fund managers has a negative influence
on fund performance, while experience has a positive impact. Gottesman and Morey (2006) find that an MBA degree from one of the top MBA schools has a positive impact on fund performance.
The career path of fund managers is also investigated in the literature. Khorana (1996) finds that in cases of bad past and present performance, fund managers are more likely to be replaced. Chevalier and Ellison (1999b) show that younger managers are more careful and choose a lower level of unsystematic risk than older managers. They argue that the reason for this is that younger managers face greater employment risk than older managers. Becoming a hedge fund manager is also a potential career path of mutual fund managers. Deuskar, Pollet, Wang and Zheng (2011) show that the best mutual fund managers often stay in the mutual fund industry if the mutual fund companies provide them with the opportunity to manage hedge funds at the same time. However, many mutual fund managers with poor performance and high expense ratios tend to leave the mutual fund industry and join the hedge fund industry.
1.3. Main Research Questions and Main Results
The main research questions of this dissertation are:
1. Does rapid trading exist among German equity mutual fund investors? What are the determinants of rapid trading? Does rapid trading have a negative impact on mutual fund performance? (Chapter 2)
2. Do mutual fund investors, as a whole, have asset allocation abilities regarding their mutual fund investments? Are there differences in asset allocation ability among different mutual fund sales channels, especially between investors buying funds via non-proprietary and non-proprietary brokers? (Chapter 3)
3. Do fund companies allocate their fund managers to market segments in an efficient way, i.e. such that fund managers work in market segments in which their skills are rewarded best? (Chapter 4)
4. What are the characteristics and behavior of would-be entrepreneurs in the mutual fund industry? Do entrepreneurial fund managers change their behavior after they start their own firm? (Chapter 5)
I will use the remainder of this section to briefly summarize these chapters and their main results.
Chapter 2 (joint work with Stefan Ruenzi) is the first study to examine rapid trading among German equity mutual fund investors.2 Rapid trading refers to the short-term trading behavior of mutual fund investors.
For this study we use proprietary data on monthly inflows and monthly outflows from a large German mutual fund company for all of its equity funds. We find a significant positive relationship between inflows and outflows in the same month, which we interpret as evidence of the existence of rapid trading among German equity mutual funds. The analysis of the determinants of rapid trading shows that this short-term trading behavior is particularly pronounced for small funds, risky funds, funds with low nominal prices, and international funds, i.e. funds with the strongest rapid trading show lottery-like characteristics. However, we find no evidence of market timing activities (time-zone arbitrage). Furthermore, contrary to the U.S. study O'Neal (2004), our research indicates that rapid trading is less pronounced for funds with high front-end loads. This indicates that rapid trading among German fund investors cannot be explained by brokers that push fund investors to rearrange their investments constantly in order to benefit from sales commissions. Rather, our results are consistent with the view that some investors use mutual funds for short-term, speculative purposes.
In terms of the impact of rapid trading on fund performance, we only find very weak evidence of a negative impact of rapid trading on fund performance before the mutual fund scandal in the U.S. in 2003. Regarding the period after the scandal there is no evidence of a
2 This chapter was published in Springer/Kluwer Academic Publishers Book/Zeitschrift für Betriebswirtschaftschaft
(Journal of Business Economics), Vol. 80 (9), September 2010, P. 883-920, Rapid Trading bei deutschen Aktienfonds: Evidenz aus einer großen deutschen Fondsgesellschaft, Jieyan Fang and Stefan Ruenzi (http://www.zfb-online.de/index.php?do=show&alloc=185&id=18720). I appreciate for the kind permission of Springer Science and Business Media.
negative impact. This suggests that the conduct guidelines of the BVI (Bundesverband of Investment und Asset Management e.V.) function properly and that at least the investigated fund company has taken appropriate measures in order to avoid the negative effects of rapid trading.
In Chapter 3, I investigate the asset allocation ability3 of mutual fund investors at the aggregate level in the U.S. Specifically, I examine differences regarding the asset allocation ability among investors buying their shares via non-proprietary brokers, proprietary brokers, and direct channels. In order to conduct these analyses, I use data from the ICI (Investment Company Institute) that contain the total net assets and flows in different fund categories and via different mutual fund sales channels.
On aggregate, mutual fund investors do not seem to have superior asset allocation ability. The actual asset allocation performance is worse than a benchmark portfolio with constant asset allocation weights. This finding is stable based on a TNA portfolio as well as a flow portfolio. A possible explanation for this finding is the sentiment-driven behavior of mutual fund investors. On the one hand, Chalmers, Kaul and Phillips (2009) and Baker and Wurgler (2007) find a positive relationship between investor sentiment and equity fund flows. On the other hand, a negative relationship between investor sentiment and subsequent aggregate stock returns over multiyear horizons is shown by Brown and Cliff (2005). They argue that current high sentiment can lead to market overvaluations, which is followed by low cumulative long-term returns as market prices drop back to their fundamental value. Based on these findings we can argue that the observed underperformance of mutual fund investors could be explained by investor sentiment. The asset allocation decisions of mutual fund investors are influenced by investor sentiment. In high sentiment periods they invest in riskier asset classes, such as equity funds. Therefore, they suffer lower subsequent returns. In periods of low sentiment they prefer less risky asset classes, e.g. bond funds, and disinvest in equity funds. Therefore, fund investors miss the subsequent higher equity returns. The wrong shift among asset classes leads to a long-term underperformance as compared to the passive cash flow (CF) benchmark.
3 Asset allocation ability is defined as the ability to allocate assets among major asset classes, i.e. stocks, bonds, money
Furthermore, I investigate the flows from different mutual fund sales channels separately. First, I find very different risk profiles among the various sales channels. In particular, the non-proprietary broker portfolio shows a significantly riskier profile than the proprietary broker portfolio. Second, I find that flows through non-proprietary brokers show significantly higher asset allocation performance than flows through proprietary brokers. This is consistent with the view that non-proprietary brokers are more likely to act on behalf of their customers, as opposed to proprietary brokers who represent their affiliated companies.
In Chapter 4 (joint work with Alexander Kempf and Monika Trapp) we study whether fund families efficiently allocate their fund managers to different market segments. Whether a fund manager can generate alpha depends both on her skill and on the efficiency of the market segment in which she is employed. We expect that in a fully efficient market even managers with extraordinary skills cannot generate systematic alphas. In an inefficient market, however, skilled managers can generate systematic alphas, while unskilled managers cannot. Thus, a fund family should allocate the managers with the highest skills to the least efficient market segments.
The questions above are crucial for fund companies, since the efficient allocation of fund managers directly influences the performance of the funds, flows into the funds and eventually profitability. To investigate manager allocation, we focus on the investment grade and high yield corporate bond fund market. In the first step, these two fund segments are ranked with respect to their efficiency. In the second step, we correlate fund performance to managerial skills. We find that managers with higher skills do indeed generate significantly higher alphas in the inefficient high yield segment. This indicates that managerial skills are more profitable in inefficient markets. In the final step, we investigate whether fund companies allocate their managers accordingly and assign their smartest managers to the inefficient high yield segment. Our results strongly show that fund companies indeed assign their smartest managers to the less efficient market segment. This indicates that fund companies allocate fund managers in an efficient way and exploit the comparative advantages of their managers.
Chapter 5 (joint work with Jerry Parwada and Stefan Ruenzi) is the first study to examine entrepreneurship in the mutual fund industry. The idea that entrepreneurs possess characteristics that differ from paid employees is featured in many theoretical models. In this study we provide evidence of the characteristics and the behavior of entrepreneurs suggested by theory, using the mutual fund industry as our laboratory. The advantage of using the mutual fund industry is that we can directly observe the characteristics and behavior of entrepreneurs in the mutual fund industry, since firm founders in the investment industry usually work as portfolio managers for another fund company first before starting their own firms. This allows us to provide the first comprehensive empirical tests of predictions derived from well-established theoretical models on entrepreneurial qualities. We find that would-be entrepreneurs are proactive, innovative and show signs of overconfidence. They use more active investment strategies and trade more frequently than non-entrepreneurial managers. They also use the permitted investment practices in a higher capacity than non-entrepreneurial managers. Would-be entrepreneurs are typically individuals with higher media coverage. Inconsistent with some models from the entrepreneurship literature, we do not find differences in risk taking between would-be entrepreneurs and non-entrepreneurial managers. Furthermore, would-be entrepreneurs do not perform better than non-entrepreneurial managers before starting their firm. In addition, we investigate how the behavior of fund managers changes after they start their own firms, i.e. once they switch from agent to principal. We observe a significant increase in risk and style extremity. In addition, the fraction of sole-managed funds decreases significantly, while the total number of funds managed increases. We also observe a slight performance decrease for managers after starting their own firms, which could be a consequence of overconfidence or of being distracted by now managing a company along with managing funds or of managing more funds at the same time.
Overall, the main contributions of the thesis are the following:
We examine rapid trading among German equity mutual fund investors. We find strong evidence for rapid trading. It is particularly pronounced for small funds, risky funds, funds with low nominal prices, and international funds. However, we find no evidence of market timing activities. Furthermore, unlike in the US, rapid trading is less pronounced for funds
with high loads. This shows that rapid trading among German fund investors is not explained by churning due to brokers’ advice. Rather, our results are consistent with the view that some investors use mutual funds for short-term, speculative purposes. The funds among which we observe the strongest rapid trading show lottery-like characteristics. Regarding fund performance, we find (at most) only very weak evidence for a negative impact of rapid trading on fund performance before the fund scandal of 2003, and no evidence afterwards.
The investigation of the asset allocation ability4 of mutual fund investors at the aggregate level in the U.S. finds that mutual fund investors show poor asset allocation abilities. Furthermore, I find very strong evidence of better asset allocation abilities of investors buying their shares via non-proprietary brokers as compared to investors buying funds via proprietary brokers.
In our study regarding the fund manager allocation we find that managers with higher skills do in fact generate significantly higher alphas in the inefficient segment, which means managerial skills are more profitable in inefficient markets. Furthermore, we find strong evidence that fund companies indeed assign their smartest managers to the less efficient market segment. This indicates that fund companies do allocate fund managers in an efficient way and exploit the comparative advantages of managers.
We also examine entrepreneurship in the mutual fund industry. We find that would-be entrepreneurs are proactive and show signs of overconfidence. Funds managed by them deviate strongly from their benchmarks and trade more frequently. They have high reputation, as measured by media coverage. In terms of the differences in risk taking and performance between would-be entrepreneurs and non-entrepreneurial managers we do not find any evidence. The investigation regarding the behavior changes of fund managers after they start their own firms shows a slight performance decrease and a significant increase in risk and style extremity. Furthermore, the fraction of sole-managed funds decreases significantly, while the total number of funds managed increases.
4 Asset allocation ability is defined as the ability to allocate assets among major asset classes, i.e. stocks, bonds, money
2. Rapid Trading Among German Equity Funds
Chapter 2
Rapid Trading Among German
Equity Funds
2.1. Introduction
In 2003 the American fund industry was shaken by one of its worst scandals to date. The New York Attorney General, Elliott Spitzer, launched an investigation of several investment companies. The focus of interest was the explicitly illegal "late trading"5 and "rapid trading" practices. Rapid trading is short-term trading in the fund shares by fund investors. In this case, buying and selling are usually only a few days apart. Rapid traders try to profit from short-term market movements. Rapid trading is therefore contrary to the basic idea of the fund concept, according to which funds represent a more long-term investment alternative for asset accumulation. This is the first study of rapid trading among German equity funds.
Rapid trading is critical for the following three reasons: (1) The associated high trading activity leads to high administrative costs and transaction costs for the fund, which must be paid by all investors. (2) The fund must maintain a relatively high cash position to satisfy
5
Late trading refers to a situation in which the investment company allows certain preferred fund investors to trade fund shares at outdated prices. Thus, they can carry out quasi-arbitrage strategies at the expense of long-term fund investors (Zitzewitz 2006). Our study focuses only on rapid trading.
the liquidity needs of rapid traders. (3) The continuous inflows and outflows of funds make it difficult for the fund to implement a long-term investment policy.6 Thus, rapid trading can lead to negative externalities in the form of performance losses for long-term fund investors (see Greene and Hodges (2002)).7
Therefore, shortly after the fund scandal in the United States, the German Federal Financial Supervisory Authority (BaFin) carried out a survey of late trading and rapid trading practices in German investment companies. Many companies have reported uncertainties in dealing with rapid trading practices (see Annual Report of the BaFin for 2003, p. 214). Therefore, the German Investment and Asset Management Organization (BVI) extended the conduct guidelines for its members which 'requires that actions should be taken to protect investors from the disadvantages induced by the short-term buying and selling of shares by other investors' ('The German Investment and Asset Management Organization '(BVI) Yearbook 2004, p. 30). However, there is no systematic study of rapid trading in Germany so far. Our work fills this gap and provides three main contributions: 1) We investigate whether there is evidence of rapid trading among German equity funds. 2) For the first time we consider several possible determinants of rapid trading and analyze several explanations for rapid trading. 3) We examine the consequences of rapid trading on fund performance. In this context, we can also examine whether appropriate measures were taken in Germany to reduce or prevent the potentially negative effects of rapid trading on performance.
To examine whether there is evidence of rapid trading in Germany, we use proprietary monthly data on inflows and outflows of all equity funds from a large German investment company for the period from January 1992 to December 2006. If fund investors do conduct rapid trading, we should observe simultaneously high inflows into and outflows out of the
6 The described negative effects do not occur if fund shares are traded on a stock exchange; however, in our sample
period, stock exchanges are only of minor importance (see footnote 6).
7
Fund companies are well aware of this problem, as reflected in their terms and conditions. In the terms and conditions of Fidelity in Section 10h, for example, "investment products are generally considered as a long-term investment and are also managed accordingly. Short-term investment or excessive trading of the fund shares is not recommended, because it affects the performance of the fund by interrupting portfolio management strategies and by causing higher costs."
affected fund.8 We actually find a very strong positive correlation between inflows and outflows within the period. The volume of trading in funds is much higher than one would expect by just looking at net flow figures (= inflows - outflows). The volume of inflows and the volume of outflows are, in most years of our sample, higher by a multiple than the net flows. We interpret these results as a clear indication of the existence of rapid trading.
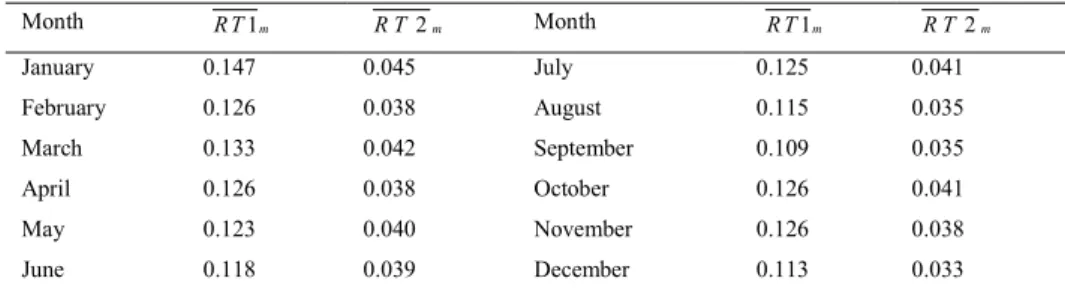
In the second step we develop an empirical proxy for rapid trading and analyze the characteristics of funds that are particularly affected by rapid trading. We find that our proxy for rapid trading is slightly lower in December and slightly higher in January than in other months. However, the differences are relatively small and rapid trading is consistently strong over the entire calendar year. Moreover, we can show that rapid trading is particularly strong for funds with low front-end load fees, small funds, risky funds and funds investing in international stocks, but not particularly pronounced for funds investing in Asia. The latter could be used for so-called time-zone arbitrage.9 From this we can conclude that rapid trading cannot be explained by time-zone arbitrage in our sample.
Overall, our analysis suggests that rapid trading can be explained by the fact that certain funds are considered as speculative, short-term and lottery-like investments by investors. They are bought in the hope of quick profits and quickly sold again. Since in Germany equity funds are held largely by small investors, this result is consistent with recent results of Kumar (2009) and Han and Kumar (2009). These studies show that small investors prefer stocks with lottery-like characteristics.
8
Strictly speaking, the simultaneous occurrence of high inflows and outflows is only a necessary condition for the short-term trading of a fund by the investors. It is also conceivable that certain funds have high inflows and outflows for some other reasons, while the respective investors are basically aligned with the long term investment. Our later results suggest that this interpretation, however, seems more unlikely. Therefore, we follow the procedure established in the literature (see, e.g., O'Neal (2004), Cashman, Deli, Nardari and Villupuram (2006)) and interpret the simultaneous presence of high inflows and outflows as a sign of rapid trading.
9
Time zone arbitrage is possible if the time of price determination for the fund in Germany is after the trading close of a foreign stock exchange where the fund invests. Then the tradable fund price on that day does not reflect all price-sensitive information that has become known after the foreign market closure. Therefore, these prices are outdated (so-called 'stale prices'). The quasi-arbitrage strategy can be operated by trading on these prices. For example, if there is very good news that became known after the closure of trading in Asia, then the time zone arbitrageur in Germany can invest in funds investing in Asia on the same day. The purchase will be billed at prices that do not reflect the new good news. The good information will be priced on the following day and the fund shares may be sold at a higher price. A detailed description of time zone arbitrage (also known as 'market timing') can be found in Frankel and Cunningham (2006). Time zone arbitrage is also examined, e.g., in Chalmers, Edelen and Kadlec (2001) and Greene and Hodges (2002).
In the last step, we investigate whether rapid trading leads to negative externalities in the form of reduced performance for long-term fund investors. Our results show a negative but very weak influence of rapid trading on performance in the period before the fund scandal became public in the U.S. in August 2003. Afterwards no influence is found. These results suggest that the conduct guidelines issued by BVI after the scandal in the U.S. are functioning properly. It seems that (at least in the anonymous fund company analyzed here) appropriate measures have been taken to prevent the potentially negative effects of rapid trading.
Our study contributes to the broad literature on the determinants of inflows to equity funds, which has so far focused mainly on the relationship between past performance and net flows. Studies with a focus on the U.S. market are Ippolito (1992), Chevalier and Ellison (1997) and Sirri and Tufano (1998). The relationship between past performance and net flows or market share in German equity funds is investigated in Krahnen, Schmid and Theissen (2006) and Ber, Kempf and Ruenzi (2007). While there are now some U.S. studies that look at inflows and outflows separately (see, e.g., Bergstresser and Poterba (2002), O'Neal (2004), Christoffersen, Evans and Musto (2005), Cashman, Deli, Nardari and Villupuram (2006)), there is no evidence for the German fund market so far. Rapid trading in the U.S. fund market is explicitly investigated by O'Neal (2004). He finds evidence of rapid trading among the 200 largest U.S. equity funds for the period from 1994 to 1998. However, he does not perform a systematic examination of the determinants of rapid trading, and does not consider the possible consequences of rapid trading on performance. Our study also differs from O'Neal’s (2004) because our sample contains German equity funds and takes in a much longer sample period. Our paper contributes, as well, to the literature on the behavior of retail investors. This literature has so far focused mainly on the behavior of stock investors (see, e.g., Cohn, Lewellen, Lease and Schlarbaum (1975), Odean (1998a), Odean (1999), Barber and Odean (2000), Ivkovic, Sialm and Weisbenner (2007), Han and Kumar (2009), Goetzmann and Kumar (2008), Dorn, Huberman and Sengmueller (2008)). In this context it is particularly important to mention the study of Barber and Odean (2000), which shows that retail investors trade too much in stocks, which can also be interpreted as evidence of rapid trading among stocks.
Our study complements this evidence by showing that the unexpected high trading volumes can also be observed in mutual funds.
This study is structured as follows. In the following section, we present the data used. In Section 2.3 we present our results. Section 2.4 concludes.
2.2. Data and Methodology
We use data of German equity funds from 'The German Investment and Asset Management Organisation' (BVI), from the Hoppenstedt Fondsführer, as well as data obtained from an anonymous large German fund management company. The data from the anonymous fund company includes information on monthly inflows and outflows of all equity funds of the company for the period from January 1992 to December 2006. Therefore, this dataset covers all purchases and redemptions of fund shares through the fund company, which is also the typical trade channel for fund shares in Germany. Unfortunately, due to lack of data availability, we cannot make further distinctions among specific distribution channels (banks/saving banks, direct banks, investment companies, brokers and agents, etc.). We also do not consider the trading of fund shares on stock exchanges.10 The dataset of the anonymous fund company provides additional information on the fund's assets and net returns (i.e., returns net of management fees). The front-end loads are calculated using data from the BVI. The anonymous fund company does not charge back-end load fees for their funds in our sample period. Based on the information in the database of the BVI, we assign each fund to one of four market segments: Domestic Equities, Domestic Equities Special, International Equities and International Equities Special.11 We collect the management fees from the Hoppenstedt Fondfsführer.
10
Based on data on trading volumes of the stock exchange in Hamburg we are able to compare the trading activity on the stock exchange and through the traditional trade channels (subscription and redemption of fund shares through the fund company). For those months in which both trading volumes of the stock exchange and flow data from the fund company exist, we found an average volume via the stock exchange of € 228,090 per month (median: € 55,502), while the sum of absolute inflows and outflows is on average 52,714,400 € (median: € 22,008,030). The magnitudes are in completely different dimensions. The stock exchange is not very important in our sample period. The correlation between trading volume and the sum of inflows and outflows is also very small and insignificant. This suggests that trades on the stock exchange are made by an investor clientele other than traders trading directly with the fund company
11
The addition ,special' is for funds that have a specific focus, e.g., funds focused on specific industries. In U.S. studies funds are often clustered by using the dimensions of Growth/Value and Large-Cap/Small-Cap. This classification has become common in Germany only recently and is not used in our sample period.
Descriptive statistics for the funds of the anonymous fund company are summarized in Panel A of Table 2.1.
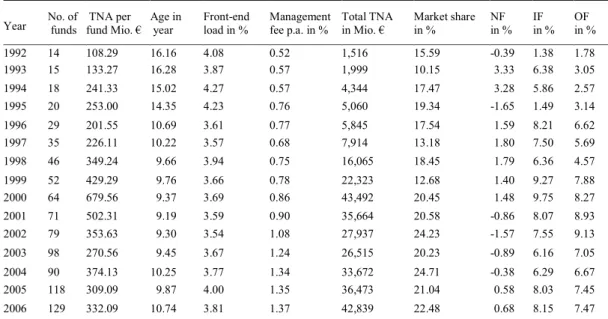
Table 2.1: Descriptive statistics
This table presents summary statistics on equity funds of the anonymous fund company (Panel A), and on equity funds of the six largest German investment companies (Panel B). Data are obtained from the anonymous fund company, BVI, and Hoppenstedt Fondsführer. In Panel A the total number of observations is 8,777. In Panel B the total number of observations is 30,145.
Panel A: Descriptive statistics on equity funds of the anonymous fund company
Year No. of funds TNA per fund Mio. € Age in year Front-end load in % fee p.a. in % Management Total TNA in Mio. € Market share in % NF in % IF in % OF in %
1992 14 108.29 16.16 4.08 0.52 1,516 15.59 -0.39 1.38 1.78 1993 15 133.27 16.28 3.87 0.57 1,999 10.15 -3.33 6.38 3.05 1994 18 241.33 15.02 4.27 0.57 4,344 17.47 -3.28 5.86 2.57 1995 20 253.00 14.35 4.23 0.76 5,060 19.34 -1.65 1.49 3.14 1996 29 201.55 10.69 3.61 0.77 5,845 17.54 -1.59 8.21 6.62 1997 35 226.11 10.22 3.57 0.68 7,914 13.18 -1.80 7.50 5.69 1998 46 349.24 09.66 3.94 0.75 16,065 18.45 -1.79 6.36 4.57 1999 52 429.29 09.76 3.66 0.78 22,323 12.68 -1.40 9.27 7.88 2000 64 679.56 09.37 3.69 0.86 43,492 20.45 -1.48 9.75 8.27 2001 71 502.31 09.19 3.59 0.90 35,664 20.58 -0.86 8.07 8.93 2002 79 353.63 09.30 3.54 1.08 27,937 24.23 -1.57 7.55 9.13 2003 98 270.56 09.45 3.67 1.24 26,515 20.23 -0.89 6.16 7.05 2004 90 374.13 10.25 3.77 1.34 33,672 24.71 -0.38 6.29 6.67 2005 118 309.09 09.87 4.00 1.35 36,473 21.04 -0.58 8.03 7.45 2006 129 332.09 10.74 3.81 1.37 42,839 22.48 -0.68 8.15 7.47
Panel B: Descriptive statistics on equity funds of the six largest German investment companies
Year No. of funds TNA per fund Mio. € Age in year Front-end load in % Management feep.a. in % Total TNA in Mio. € Market share in % NF in % 1992 47 152.36 17.34 4.29 0.62 7,161 73.63 -0.04 1993 48 185.91 17.78 4.24 0.67 8,924 45.32 -2.23 1994 57 260.60 16.38 4.39 0.74 14,854 59.75 -2.64 1995 76 232.23 13.69 4.36 0.79 17,649 67.45 -0.97 1996 99 204.95 11.35 4.04 0.87 20,290 60.88 -0.81 1997 119 241.85 10.80 3.91 0.82 28,780 47.94 -1.88 1998 126 360.25 10.94 3.96 0.88 45,391 52.12 -1.36 1999 174 463.99 19.87 3.67 0.93 80,734 45.88 -1.00 2000 213 669.72 19.43 3.64 0.99 142,650 67.07 -0.92 2001 253 519.46 18.95 3.53 1.06 131,423 75.85 -0.14 2002 297 340.13 18.71 3.51 1.20 101,019 87.60 -0.94 2003 336 258.54 19.06 3.62 1.19 86,870 66.28 -0.29 2004 269 367.94 10.34 3.72 1.26 98,977 72.62 -0.18 2005 289 339.82 10.75 3.81 1.29 98,208 56.65 -0.04 2006 313 360.34 11.57 3.75 --- 112,786 59.19 -0.53
The number of funds increases from 14 in 1992 to 129 in 2006.12 In the same period, the average TNA (total net assets) per fund increases from € 108.29 million to € 332.09 million, while the mean age of the fund decreases from over 16 years to less than 11 years. These figures reflect the rapid growth of the industry and the large number of newly established funds in this period. Front-end load fees are relatively constant in the sample period and are about 4%.13 The management fees rise from 0.52% in 1992 to 1.37% in 2006. The total asset under management in the funds of the company increases from € 1.5 billion in 1992 to over € 40 billion. This represents a market share of up to nearly 25% based on the total market capitalization of all German equity funds. The average monthly growth rate of net flows (NF) varies between -1.65% and 3.33%. Looking at the growth rate of inflows (IF) and the growth rate of outflows (OF) separately, we can conclude that the net flows are neither driven only by purchases nor only by redemptions. For example, in 2006 the average monthly growth rate of net flows is 0.68%, which is calculated as the difference between the growth rate of inflows of 8.15% and the growth rate of outflows of 7.47%. Similar numerical relations are found in other years. The average monthly relative inflows and relative outflows, as well as the relative net flows over time, are shown in Figure 2.1.
It can be clearly seen that investors trade fund shares much more actively than one would expect by just looking at net flows. These figures suggest the existence of rapid trading in Germany. They are qualitatively consistent with the results for the U.S. fund market. However, the magnitude of rapid trading in Germany is greater than in the U.S. For example, Cashman, Deli, Nardari and Villupuram (2006) show that in the U.S. the average monthly relative net flow from 1997 to 2003 is 2%, while the average of relative inflows and outflows are 5.4% and 3.4%, respectively.
12
Starting in 2002 multiple share classes are offered for some funds. These share classes are included as separate funds in our database. The share classes of a fund are based on the same portfolio, but they differ in fee structure. As we explicitly examine the influence of the different types of fees (Section 2.3.3) below, we use each share class as a separate observation, and refrain from aggregating them on the portfolio level.
13
It is important to note that front-end load fees always represent the maximum sales charges payable. It is possible that some investors pay lower fees when they purchase funds through discount brokers or when they invest a very large amount in cases of a staggered front-end load fee structure. Since we only consider funds of one fund company, the front-end load fees could be a reasonable proxy to capture the differences in actual front-end load fees paid by investors. Thus we do not expect our following results to be skewed by possible existing differences between actual and maximum front-end load fees.
Figure 2.1: Average monthly relative net flows, relative inflows and relative outflows
This figure shows the monthly average of relative net flows, relative inflows and relative outflows in the years from 1992 to 2006. The data are obtained from the anonymous German fund company.
To ensure that the data of the anonymous fund company are representative for the German fund market, we collect additional data from five other large fund companies. These data are also available from the BVI. The expanded sample includes data from the six largest German fund companies.14 The market share of equity fund assets managed by these companies covers up to 88% of the total equity fund assets in Germany. The descriptive statistics for this expanded sample are shown in Panel B of Table 2.1.15 The magnitude of the individual variables shows no noticeable difference between the data of the anonymous fund company and the data of the expanded sample.
In addition, we compare the product structure of the anonymous fund company and the six largest fund companies by looking at the number and proportion of the funds in different fund categories. The corresponding results are shown in Table 2.2.
14
They are Activest (since October 2006 Activest Pioneer), Cominvest/Adig, Deka, dit (since December 2006 merged with dbi to become Allianz Global Investors), DWS and Union Investment.
15
Data on management fees in 2006 are not available for the enlarged sample.
-2% 0% 2% 4% 6% 8% 10% 12% 1992 1993 1994 1995 1996 1997 1998 1999 2000 2001 2002 2003 2004 2005 2006