MARLEEN WILLEKENS • HEIDI VANDER BAUWHEDE • PIET SERCU
Post-Enron implicit audit reporting standards:
sifting through the evidence*
Marleen Willekenst
, Heidi Vander Bauwhede+ and Piet Sercu§
First draft: December 2003; this version: March 2004
Preliminary -
comments very welcome
* Authors are listed by reverse alphabetical order. We gratefully acknowledge useful comments from participants at the 2004 American Accounting Association Midyear Auditing Section conference.
t(corresponding author) KU Leuven, Department of Applied Economics, Naamsestraat 69, B- 3000 Leuven; Tel: +32 1632 6932; Fax: +32 16326632; email: [email protected].
+KU Leuven, Department of Applied Economics, Naamsestraat 69, B- 3000 Leuven; Tel: +32 1632 6930; Fax: +32 1632 6632; email: [email protected].
§KU Leuven, Graduate School of Business Studies, Naamsestraat 69, B- 3000 Leuven; Tel: +321632 6756; Fax: +32 1632 6632; email: [email protected].
The accounting scandals and the demise of Andersen have increased auditors' ex ante business risk. As a result, stock markets revised downward the value of the audit firms (Asthana et al. 2003; Chaney and Philipich 2002; Krishnamurthy et al. 2002; Callen and Morel 2002). One commonsensical reaction on behalf of auditors should have been to apply the existing rules more carefully and, thus, issue more non-clean audit opinions. This is exactly what we see. Closer scrutiny reveals that the higher incidence of non-clean audit opinions is not due to the (substantial) changes in the audit client list or their balance sheets. Instead, shifts in the client characteristics seem to have masked the Enron effect, and especially so in the non-Big5 sample. This study mirrors earlier results where auditors relaxed their standards following a drop in business risk (Geiger and Raghunandan, 2001, 2002; Francis and Krishnan, 2002).
JEL classification: .
Key words: Auditor reporting, qualified / modified opinion, Enron, Andersen. Data availability: All data are publicly available.
Post-Enron implicit auditing standards:
sifting through the evidence
Introduction
When, after Enron's collapse (October-December 2001), the less than glamorous role played by Arthur Andersen gradually became evident, analysts and the press suddenly eyed audit reports much more critically. This meant a higher probability that audit failures, if any, might be detected. And when, a few months later, the unthinkable happened and a Big5 auditor sank in a matter of months, in the minds of the profession the expected damage to the auditor if and when a failure is discovered was revised upwards by several notches. Some response to the resulting increase in auditors' business risk was natural, under the circumstances. Sarbanes-Oxley raised the explicit audit standards, by imposing new rules. We argue that auditors simultaneously raised their implicit audit standards-that is, they increased compliance with
the existing explicit audit reporting standards, or lowered the materiality threshold.l The
tell-tale sign of a rise of the implicit standards, everything else being the same, would be a higher incidence of non-clean audit opinions; and such a higher incidence is exactly what we observe, even after sifting out effects from increased risk and changing clienteles in the sample. In fact, the sifted evidence is in many ways stronger than the prima facie one.
In the remainder of this paper we first discuss the auditor's alternatives and the practical difficulties we face when measuring their response. We next describe the sample in greater detail, we estimate to what extent shifts in company risks have affected auditor behavior, and test whether there remains a residual schift that may be attributable to an Enron-Andersen effect.
IThis refers to the level of deviation between accounting numbers and standards that is acceptable to an auditor. For unacceptable deviations, the auditor demands an adjustment, and writes a non-clean audit opinion if the client firms does not make the adjustment. Consistent with prior audit reporting studies, the term non-clean audit opinion comprises all types of audit opinions other than unqualified opinions (or non-clean opinions); thus, it comprises modified opinions, qualified opinions, adverse opinions and disclaimers of opinion, as well as going-concern opinions.
Table 1: The incidence of non-dean opinions among Big5 and non-Big5 auditors, 1999-2002
non-clean opinions in sample, %
#
of audit clients in sampleYear all auditors Big Five other all auditors Big Five other
1999 5.26% 4.12% 19.9% 3,327 3,085 242 2000 5.41% 4.16% 21.5% 3,367 3,125 242 2001 6.84% 6.01% 20.5% 3,087 2,911 176 2002 6.85% 6.09% 19.9% 2,905 2,744 161 total 6.05% 5.05% 20.5% 12,686 11,865 821 change +1.59% +1.97% +0.01% -12.7% -11.0% -33.5%
non-clean Table 1. The sample consists of all non-financials covered by Worldscope for which all required data were available. "Non-clean opinion" covers qualified and modified opinions.
The
prima facie evidence
Toughening the implicit standards would surely have been a sensible response to the auditor's increased business risk. First, a prior non-clean opinion does reduce the chance that the
auditor gets sued if the auditee keels over (Carcello and Palmrose, 1994). Second, the auditors'
alternative ways to handle the increased business risk must have looked far less appealing. For instance, they could have bought outside insurance, or increased fees so as to auto-insure, or stepped up the auditing effort itself. But each of these would have meant higher fees;2 and getting more money would have been a hard sell in the critical climate of the time. Next to increasing the standards, the auditors might also have weeded out the riskier audit clients,3 but we do not explicitly study that possible reaction.
In short, raising implicit auditing reporting standards should have made sense. And sure enough, among the Worlds cope-covered non-financials in our sample, the number of non-clean opinions rose from 5.3 percent in 1999 to 6.9 percent in 2002, the first unambiguously
post-Enron/ Andersen year4 (Table 1). Upon closer inspection of the figures, however, the story no
longer appears as cut and dry, and the main task we set ourself in this paper is to show that
2Prior audit-fee studies indeed suggest that fees do reflect variations in client-specific litigation risk factors (see for example Simunic 1980; Palmrose 1986; Francis and Simon 1987; Simunic and Stein 1996).
3Krishnan and Krishnan (1997), Johnstone (2000) and Francis and Krishnan (2002) report some evidence consistent with auditors screening out high-risk clients.
4 A year refers to the customer's reporting period. The auditor's report is usually released in the subsequent
calendar year. Andersen was barred from auditing SEC-registered companies in June 2002, but by that time most of the "2001" audit reports had been written.
Post-Enron auditing standards 3
the simple univariate analysis, above, does get us the right picture.
Tougher standards or tougher circumstances?
Table 1 shows that, first, the higher incidence of non-clean opinions seems to be confined to big-5 auditees. Among the Worlds cope-covered non-financials with full data and a non-Big5 auditor, the relative number of non-clean opinions did not change all that much over the 1999-2002 period, while for Big5 auditees the number rose by 2 percent (i.e. from 4.1 percent to 6.1 percent). Did the smaller players not feel any pressure? One could indeed argue that the amount of reputational capital at risk for a Big5 firm was higher (DeAngelo, 1981), but that's a far cry from saying that smaller firms stood nothing to lose at all. Or were the smaller ones already so perfectionist-"we try harder"?-that no extra action was called for? Adherents of this view might point out the four times higher incidence of non-clean opinions;5 but critics would reply that the non-Big5 clientele may be different, too.
The Big5/non-Big5 divide is not the only puzzling figure in Table 1. Equally mystifying, from the Enron/ Andersen perspective, for non-Big5 firms the peak year within the 1999-2002 window actually is 2000, which is unambiguously prior to Enron. So there must have been other factors at work. A change in economic circumstances may have mattered, for one. 2000 was the year the leT bubble burst, and one would expect relatively more of these companies to have a non-Big5 auditor. But the economic context could also have been responsible for part of the 2001 rise in Big5 qualifications and modifications: notorious events in 2001 beside Enron include the widening of the stock-market slump, IX-H, and a drastic slowdown in general economic activity. In short, the deterioration of many auditees' financial situations should have made the auditors more careful even without the Enron-Andersen event. Another interfering factor might have been shifts in the sample, generating noise and, possibly, bias. From Table 1 we indeed note that between 1999 and 2002 the number of non-Big5 audit clients in the sample dropped by over one third. True, most of the deleted firms dropped from the sample because of an incomplete Worlds cope record, not because of a take-over or bankruptcy. Still, such a drastic shift in the composition of the sample may have masked a possible toughening of non-Big5 audit reporting standards, especially if incomplete data records would go together with generally more shoddy reporting practices and, therefore, more objections from the auditor. Such a
5In line with this, some prior studies find that the materiality thresholds of non- Big6 auditors are much lower than those of Big6 auditors (Messier 1983), and that non-Big6 auditors are more likely to issue a consistency modification (Chewning et al. 1989).
correlation between data incompleteness and poor reporting practices is not inconceivable: in our Big5-customer sample, which supposedly tends to contain the safer and more careful firms, the shrinkage because of missing data is just 11 percent.
In short, there may be more going on behind the numbers than meets the eye. Given the significant change in the lists of audit client firms and the adverse change in the economic environment for many audit clients, one should figure out to what extent the occurrence of non-clean opinions is due to changes in audit clients' risk profiles rather than a reaction to En-ron/ Andersen. In fact, we do find that the Big5's increased use of modified/ qualified opinions is hardly affected by changes of audit client characteristics, while after filtering out client-quality effects also the non-Big5 auditors appear to have become markedly more critical, not less.
Our study is, to the best of our knowledge, the only one thus far studying the auditors' reaction to Enron/ Andersen, but several other articles indirectly support our logic. Studies of the reaction of the stock market (Asthana et al. 2003; Chaney and Philipich 2002; Krishna-murthy et al. 2002; Callen and Morel 2002) show that stock prices of clients of both Andersen and other Big5/4 auditors dropped significantly, especially after the release of negative infor-mation concerning the role of Andersen in the Enron case. This clearly suggests that auditor brand names and reputations were severely damaged and that serious doubt existed concern-ing audit quality and, consequently, the credibility of audited financial statements. There are also studies showing auditors' reaction to a relaxation of business risk rather than a rise in it. Notably, Geiger and Raghunandan (2001, 2002) and Francis and Krishnan (2002) report that auditors became less likely to issue a going-concern modified opinion after the Private Securities Litigation Reform Act of 1995, which reduced the likelihood of litigation against auditors. Our prima facie findings-a rise of implicit audit standards following an increase in risk-is consistent with this literature.
The sample and the variables
Our sample includes all U.S. listed firms for which data are available on Worldscope for the fiscal years 1999, 2001, 2002 or 2002. This provides about 30,000 records. As in prior audit reporting research (Reynolds and Francis, 2001; DeFond, Raghunandan and Subramanyam, 2002) we exclude financial institutions, i.e. 5,000 records relating to SIC codes 6000-6999, because the measures of financial distress that will be used in our empirical model are not applicable to the financial sector. We also exclude observations with missing values (about 12,500 records). This process results in a sample of 12686 firm-years relating to 3367 different
Post-Enron auditing standards 5
Table 2: Exits and (re)entries, final sample, 1999-2002 year
1999-2000 2000-2001 2001-2002
Number of exits 73 336 332
Number of (re)entries 113 56 150
Net change 40 -280 -182
Key to Table 2. The sample consists of all non-financials covered by Worldscope for which all required data were available. "Non-clean opinion" covers modified, qualified and adverse opinions.
companies.
The impact of missing variables on the sample is substantial, reducing the number of usable observations to about one half of the original. This means that the year-to-year changes in the sample, noted in Table 1, stem not just from exits (because of delistings or missing date), but the net result of (re)entries and exits. Table 2 shows the migrations by direction. Of the 3367 firms in the 2000 sample, for instance, 10.8 percent are no longer present in the 2001 sample,
while 1.2 percent of the 2001 records were not in the 2000 sample. We therefore need to verify
to what extent these large shifts in the sample composition contributed to the changes in the frequency of modified non-clean opinions.
Our measure of implicit auditor reporting standards is the number of non-clean opinions. Note that we could have made separate studies per type of non-clean opinion. However, there is little a priori reason why some types of statements would be immune to the change in the auditing climate. There also is a statistical argument: fragmenting the event into sub-events, one gets smaller probabilities of occurrence and, therefore, less power.
Our prime task is to filter out, from the incidences of non-clean opinions, those that can be ascribed to year-by-year shifts in audit related risks. These risks can be divided in three major types: task-specific, client-specific and auditor-specific. To that end, we let the probability of non-clean opinion vary, logit-style, in light of risk variables that are standard in prior audit reporting studies. The first two control variables are task-specific and include the proportions of
inventory and receivables to total assets (AR/TA and Inven/TA, respectively), two accounting
items that are typically more prone to errors and irregularities (Dopuch et al. 1987, Bell and
Tabor 1991), and that typically are positively correlated to the incidence of a non-clean audit
opinion. The next three audit-risk regressors are client specific. PBankr is a proxy for the
probability of bankruptcy, computed using Zmijewski's (1984) model. Higher values indicate
opinion for going concern or other reasons (Francis and Krishnan 2002; DeFond et al. 2002). The next measure of financial distress we include is lloss ' an indicator taking a unit value if current-year earnings are negative and zero otherwise (Francis and Krishnan 1999). Our
third client-related variable is client size, measured as In( TA), the natural logarithm of total
assets. As an audit-risk proxy, this one is ambiguous. On the one hand, larger firms tend to have more complex structures, which increases the chance that something gets overlooked, while also the potential damage from any audit failure increases in client size. On the other hand, auditors may also be more confident that large clients may survive financial difficulties, because they are often better diversified, or have greater negotiating power with creditors and
more resources (Reynolds and Francis 2001, 392). It has to be noted, however, that there may
also be a link from customer size to audit behavior that has nothing to do with audit risk: a larger client brings in bigger audit fees, which could lead to less conservative reporting. Our
last variable related to audit risk is auditor specific: an indicator I Big' which is set equal to
unity if the company's auditor is a Big-5 or Big-4 auditor, and zero otherwise. Large auditors have more reputational capital to lose if something goes wrong; but they may also attract a more blue-chip, lower-risk clientele. Previous research shows that auditor reporting behavior is linked to auditor size (Mutchler et al. 1997), with Big-5 auditors issuing more non-clean opinions, ceteris paribus.
The main test variable is the post-Enron indicator, I Enr. There is some a priori ambiguity
whether the full reaction to Enron/ Andersen should already be expected in the audits of the
2001 statements. To steer clear of that, we treat 1999-2000 as pre-Enron (that is, lEnT = 0),
skip 2001 in the tests, and treat 2002 as the post-Enron sample (IEnT = 1). In light of the
evidence from Table 1, we let the intercept and the coefficient for I Enr differ across the Big5
and non-Big5 samples. This approach assumes that the coefficients for the control variables are the same for the two sets of auditors. We test this assumption by running separate regressions for the Big5 and non-Big5 observations, respectively. Thus, the basic logit models are
Part pooled: Logit
(IMod)
Big5: Logit
(IMod)
Non-Big5: Logit
(IMod)
where
rx
[000
+
f30l Enrl(l - lbig )+
[001+
f31l EnrJIbig+
rx
(0.1)001
+
f31l Enr+
r
X (0.2)000
+
f30l Enr+
r
X (0.3)AR
lnvenPost-Enron auditing standards 7
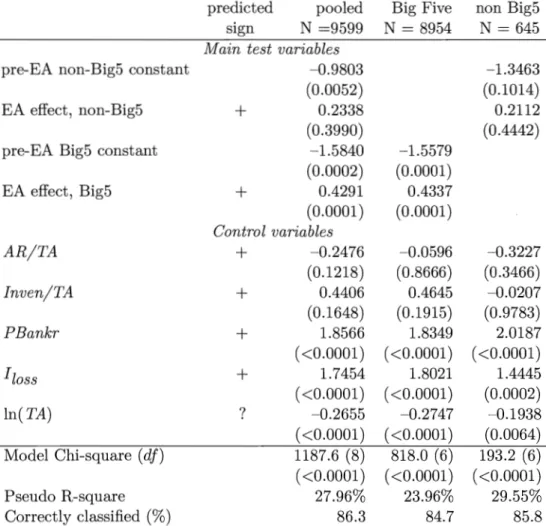
Table 3: Logit analysis of non-clean opinions among Big5 and non-Big5 auditors,
1999-2002
predicted pooled Big Five non Big5 sign N =9599 N = 8954 N = 645
Main test variables
pre-EA non-Big5 constant ~0.9803 ~1.3463 (0.0052) (0.1014) EA effect, non-Big5
+
0.2338 0.2112 (0.3990) (0.4442) pre-EA Big5 constant ~ 1.5840 ~1.5579(0.0002) (0.0001) EA effect, Big5
+
0.4291 0.4337 (0.0001) (0.0001) Control variables AR/TA+
~0.2476 ~0.0596 ~0.3227 (0.1218) (0.8666) (0.3466) fnven/TA+
0.4406 0.4645 ~0.0207 (0.1648) (0.1915) (0.9783) PBankr+
1.8566 1.8349 2.0187 ( <0.0001) «0.0001) «0.0001) floss+
1.7454 1.8021 1.4445 ( <0.0001) «0.0001) (0.0002) In(TA) ? ~0.2655 ~0.2747 ~0.1938 ( <0.0001) «0.0001) (0.0064) Model Chi-square(df)
1187.6 (8) 818.0 (6) 193.2 (6) ( <0.0001) «0.0001) «0.0001) Pseudo R-square 27.96% 23.96% 29.55% Correctly classified (%) 86.3 84.7 85.8Key to Table 3. The sample consists of all non-financials covered by Worlds cope for which all required data were available. "Non-clean opinion" covers modified, qualified and adverse opinions. The" pooled" regression has common coefficients for the control variables, but separate constants and Enron- Andersen ("EA") effects for the Big5 and non-Big5 observations. The other regressions work with separate samples for the Big5 and non-Big5 observations.
Table 4: Probabilities of non-clean opinions, holding constant the sample
year:
fitted value given X2000
uncorrected actual frequencies
Big5 auditors 2000 2002 change 4.35% 6.10% +1.75% 4.16% 6.09% +1.93% non-Big5 auditors 2000 2002 change 22.07% 24.57% +2.50% 21.50% 19.90% -1.60%
Key to Table 4. The sample consists of all non-financials covered by Worlds cope for which all required data were available. "Non-clean opinion" covers qualified and modified opinions. The table uses the analysis of Table 3 to show fitted probabilities for the 2000 sample, and, under the header "2002", the fitted value for the same sample but with the time post-Enron effect added. The latter numbers estimate the chances of non-clean opinions if there had been no change in the list of clients and in their balance sheets.
Results and discussion
The logit models agree with the univariate analysis discussed in the introduction: there is a clear Enron-Andersen effect for Big5 auditors, while for the smaller auditing firms the effect is statistically unclear. The Big5 intercept is convincingly different from the non-Big5 one; that is, the latter's higher use of non-clean opinions cannot be solely explained by the audit client characteristics included in the regression. All these findings are quite robust, as can be judged from the following checks (full results are available on request). The Big5 rise remains significant when we exclude Andersen clients, or when we run the regressions for each Big-5 auditor separately. Following many studies of going-concern opinions, we also single out the financially distressed firms (Mutchler, Hopwood and McKeown 1997; Reynolds and Francis 2001; DeFond, Raghunandan and Subnlmanyam 2002)-firms that report either negative earnings or operating cash flows during the current fiscal year. This sample, about one-fourth of the total, has far more non-clean opinions (12.45 percent), but otherwise the results are qualitative similar to our main ones. Lastly, when we take the post-EA year to be 2001 rather than 2002, or when we include both as post-event data (each with its own time effect), the conclusions remain likewise unaffected.
The statistical insignificance of the post-Enron shift for non-Big5 firms warrants some comments. This insignificance is the result of a largeish standard error (caused, in turn, by the smaller sample and more coming-and-goings in the audit client list), not of a small estimated effect. In fact, also the hypothesis that there is no difference between the post-Enron shifts in non-Big5 and Big5 behavior is statistically acceptable. In unclear cases like this, one's priors should playa major role, and there are no good reasons why smaller auditors would not have reacted at all. Note that, algebraically speaking, the estimated effect is positive.
Post-Enron auditing standards 9
That is, the impression of no effect we get from the univariate data in Table 1 appears to be caused by shifts in the sample; taking into account these aspects, one actually observes a rise in the incidence of non-clean opinions. True, Table 3 gives the impression that the effect is still smaller than for Big5 firms, but that is an illusion too. The coefficients in the table measure the sensitivity of the log odds ratio, which is non-linear (S-shaped) in the arguments. In fact, in view of the higher probabilities, the typical non-Big5 auditee is higher up the S-curve, where the sensitivities to the regressors are higher too. To estimate the change in probabilities holding constant the sample, we compute the 2000 and 2001 fitted odds for each firm, freezing the sample composition and company characteristics at their 2000 level. Table 4 shows the resulting marginal probability. For Big5 auditees, the ceteris-paribus effect is estimated at +1.75 percent, quite close to the observed rise of 1.93 percent. For non-Big5 auditees, however, the diagnosis is that, holding constant the sample, we would have seen a rise of 2.5 percent rather than a drop by 1.6 percent. Thus, the apparent lack of reaction on behalf of non-Big5 auditors seems to be because many of their clients in the sample became less risky. This fits in with the fact that their peak year, 2000, is the year of the bursting of the ICT bubble.
We conclude with a brief discussion of the results for the control variables. The financial distress variables all come in with the expected sign, and quite significantly so: a higher bankruptcy risk and a negative profit or cash flow have a massive impact on the chances of getting a non-clean opinion, while customer size (log assets) lowers the chances. The variables that, in some studies, proxy for complexity, do not pick up anything in our sample: neither
AIR
nor Inventory are associated with the probability of a non-clean opinion.Conclusion
The accounting scandals and the demise of Andersen have increased auditors' ex ante business risk. As a result, stock markets revised downward the value of the audit firms (Asthana et al. 2003; Chaney and Philipich 2002; Krishnamurthy et al. 2002; Callen and Morel 2002). One commonsensical reaction on behalf of auditors should have been to apply the existing rules more carefully and, thus, issue more non-clean audit opinions. This is exactly what we see. Closer scrutiny reveals that the higher incidence of non-clean opinions is not due to the (substantial) changes in the audit client list or their balance sheets. Instead, shifts in the client characteristics seem to have masked the Enron effect, and especially so in the non-Big5 sample. This study mirrors earlier results where auditors relaxed their standards following a drop in
business risk (Geiger and Raghunandan, 2001, 2002; Francis and Krishnan, 2002).
References
Asthana, S.C., S. Balsam, and J. Krishnan. 2003. Audit Firm Reputation and Client Stock Price Reactions: Evidence from the Enron Experience. Working paper.
Barton, J. 2003. Who cares about auditor reputation? Working paper, Emory University.
Bell, T., and R Tabor. 1991. Empirical Analysis of audit uncertainty qualifications. Journal of
Accounting Research 29 (Autumn): 350-370.
Callen, J. L., and M. Morel. 2002. The Enron-Andersen debacle: Do equity markets react to auditor reputation? Working paper.
Carcello, J.V., and Z.-V. Palmrose. 1994. Auditor Litigation and Modified Reporting on Bankrupt Clients. Journal of Accounting Research 32 (Supplement): 1-30.
Chaney, P., and K. Philipich. 2002. Shredded reputation: the cost of audit failure. Journal of
Accounting Research 40 (September): 1221-1245.
Chang, C., W. Chi, and C. Liu. 2003. Client Characteristics and Auditor Switch in an Audit Failure. Working paper.
Chen, K.C.W., and B. K. Church. 1992. Default on Debt Obligations and the Issuance of Going-Concern Opinions. A UDITING: A Journal of Practice and Theory 11 (Fall): 30-49.
Chewning, G., K. Pany, and S. Wheeler. 1989. Auditor Reporting Decisions Involving Accounting Principles Changes: Some Evidence on Materiality Thresholds. Journal of Accounting Research 27 (Spring): 78-96.
DeAngelo, L.E. 1981. Auditor Size and Audit Quality. Journal of Accounting and Economics 3 (December): 183-199.
DeFond, M. L., K. Raghunandan, and K.R Subramanyam. 2002. Do Non-Audit Service Fees Impair Auditor Independence? Evidence from Going Concern Audit Opinions. Journal of Accounting
Research 40 (September): 1247-1273.
Dopuch, N, R Holthausen, and R Leftwich. 1987. Predicting Audit Qualifications with Financial and Market Variables. The Accounting Review 62 (July): 431-454.
Francis, J. R, and J. Krishnan.1999. Accounting Accruals and Auditor Reporting Conservatism.
Contemporary Accounting Research 16 (Spring): 135-165.
Francis, J.R, and J. Krishnan. 2002. Evidence on Auditor Risk Management Strategies Before and After the Private Securities Litigation Reform Act of 1995. Asia Pacific Journal of Accounting
and Economics 9 (December): 135-157.
Francis, J.R, and D. Simon. 1987. A test of audit pricing in the small-client segment of the U.S. audit market. The Accounting Review 62 (January): 145-157.
Geiger, M., and K. Raghunandan. 2001. Bankruptcies, audit reports and the reform act. AUDITING:
A Journal of Practice and Theory 20 (March): 187-195.
Geiger, M., and K. Raghunandan. 2002. Going-concern opinions in the "New" legal environment.
Post-Enron auditing standards 11
Johnstone, K.M. 2000. Client-acceptance decisions: simultaneous effects of client business risk, audit risk, auditor business risk, and risk adaptation. A UDITING: A Journal of Practice and Theory 19 (Spring): 1-25.
Knechel, W. R 1998. Auditing: Text and Cases. Cincinnati, Ohio: South Western Publ..
Knechel, W. R, and J. L. Payne. 2001. Additional Evidence on Audit Report Lag. AUDITING: A
Journal of Practice and Theory 20 (March): 137-146.
Krishnamurty, S., J. Zhou ,and N. Zhou. 2002. Auditor Reputation, Auditor Independence and the Stock Market Reaction to Andersen's Clients. Working paper.
Krishnan, J., and J. Krishnan. 1997. Litigation risk and auditor resignations. The Accounting Review 72 (October): 539-560.
Messier, W. 1983. The Effect of Experience and Firm Type on Materiality/ Disclosure Judgements.
Journal of Accounting Research 21 (Autumn): 611-618.
Mutchler, J., W. Hopwood, and J. McKeown. 1997. The Influence of Contrary Information and Mitigating Factors in Audit Opinion Decisions on Bankrupt Companies. Journal of Accounting
Research 35 (Autumn): 295-310.
Palmrose, Z.-V. 1986. Audit fees and auditor size: Further evidence. Journal of Accounting Research 24 (Spring): 97-110.
Reynolds, J. Kenneth, and Jere R Francis. 2001. Does size matter? The influence of clients on office-level auditor-reporting decisions. Journal of Accounting and Economics 30 (December): 375-400.
Simunic, D.A. 1980. The pricing of audit services: Theory and Evidence. Journal of Accounting
Research 18 (Spring): 161-190.
Simunic, D.A., and M.T. Stein. 1996. The impact of litigation risk on audit pricing: a review of the economics and the evidence. AUDITING: A Journal of Practice and Theory 15 (Supplement): 119-134.
Zmijewski, M.E .1984. Methodological Issues Related to the Estimation of Financial Distress Predic-tion Models. Journal of Accounting Research 22 (Supplement): 59-82.
I I I I I I I I I I I I I I I I I I I I I I I I I I I I I I I I I I I I I I I I I I I I I I I I I I I I I I I I I I I I I I I I I I I I I I I I I I I I I I I I I I I I I I I I I I I I I I I I I I I I I I I
I I I I I I I I I I I I I I I I I I I I I I I I I I I I I I I I I I I I I I I I I I I I I I I I I I I I I I I I I I I I I I I I I I I I I I I I I I I I I I I I I I I I I I I I I I I I I I I I I I I I I I I I I I I