Final report - Oslo Operational Pilot
Subtitle: Vulkan Car Parking, Oslo, Norway
Authors: Prepared by Xuewu Dai, Richard Kotter, Ghanim Putrus, Yue Wang, Ridoy Das, Edward Bentley, Mousa Marzband (Northumbria University) and Jorden van der Hoogt (Stichting Cenex Nederland)
Date: 29/07/2020 Participants:
• Agency for Urban Environment, Oslo City Council: Sture Portvik • Hogeschool van Amsterdam): Bronia Jablonska and Jos Warmerdam • Katholieke Universiteit Leuven: Bert Herteleer
• Stichting Cenex Nederland: Esther van Bergen
With acknowledgements for information also to Goran Vollan, Snorre Sletfold Oskar Ekman (Fortum Charge & Drive), Björn Jernström (Ferroamp), and Isak Oksvold and Kjersti Volvik (Aspelin Ramm).
Document control
Version Date Authors Approved Comment
V1.0 28/07/2020 XD, RK, GP, YW, RD, EB, MM, JvdH
GP Internal release SEEV4-City V1.1 11/09/2020 RK, GP, SP, EvB, BH,
JvdH, BJ, JW
GP Final version for public release. Updated with feedback from partners and finalized layout
Executive Summary
This report provides a final report of the SEEV4-City Operational Pilot at the Vulkan parking garage in Oslo, Norway. It is part of a collection of reports published by the project covering a variation of specific and cross-cutting analysis and evaluation perspectives and spans across 6 operational pilots. This report is dedicated to the analysis of the pilot itself. Below is an indication of the set of reports provided, including an indication where this OP report fits in.
The Vulkan real estate site in Oslo is owned by Aspelin Ramm, and includes one of the largest parking garages used for EV charging in Europe. EV charging (both AC and DC) is managed for now predominately for costs reasons but also with relevance at further EV penetration level in this car parking location (mixed EV and ICE vehicles). This neighbourhood scale SEEV4-City operational pilot (OP) has 50 22 kW flexible AC chargers with two sockets each and two DC chargers of 50 kW with both ChaDeMo and CCS outlets. All EV chargers now have a smart control (SC) and Vehicle-to-Grid (V2G) functionality (though the latter may not be in place fully for DC chargers, as they may not be fully connected to the remote back-office system of the EV charging systems operator). A Lithium-ion Battery Energy Stationary Storage System (BESS) with a capacity of 50 kWh is pre-programmed to reduce the energy power peaks of the electric vehicle (EV) charging infrastructure and charges at other times from the central grid (which has a generation mix of 98% from hydro-electric power, and in the region covering Oslo also 1% from wind). The inverter used in the BESS is rated at 50 kW, and is also controlled to perform phase balancing of the 3-phase supply system.
The complete energy system was installed custom-built, and it is managed and monitored by Fortum (Charge & Drive). Fortum is the innovation partner of both Aspelin Ramm and Oslo City Council, and also other technology sub-contractors (such as Ferroamp for a stationary battery) have been involved in this OP. EV charging is currently free at night-time for residential parking (since Oslo City Council pays Aspelin Ramm for this, at least until mid-2022, in order to relieve the pressure on on-street public EV charging stations). Several car-sharing companies and an EV-to-go provision – as well as some (van-based) logistics service companies and electric taxis – are also making use of the parking garage during the day. These are alongside other users across the city paying for the parking and EV charging separately, and also residents of the neighbourhood at off peak and overnight times.
The Vulkan car parking garage has the largest AC charging provision in such a setting (in line with Oslo City Council’s overall strategy) in Oslo as well as in Norway, and in the North Sea Region (NSR) of Europe. Since this innovative technology system is from 2017, some limitations exist in the dynamic control of individual chargers, and the back-office connection of the two DC chargers. Different pricing structures for different AC charging speeds during the day have been experimented with, and have now been altered to a simplified charging tariff (which nonetheless varies how users connect to it by different technologies). Also, due to the success of attracting EV users to the car parking garage for charging their EVs, the capacity/sizing of the stationary battery (supporting the EV chargers collectively) is now rather marginal, and thus peak shaving of EV charging power demand is now proportionally more limited. Consequently, the electricity bill savings for the EV charging operator are also now proportionally reduced. However, electricity billing in the Norwegian regulatory context changed in the course of 2019, further towards a capacity-based rather than a purely volumetric calculation basis. This means that peak-shaving has become relatively more important in the Oslo and Norwegian context. Furthermore, whilst all of the AC chargers are now ‘V2G-ready’, this option for Electric Vehicle for Energy Services (EV4ES) has yet to be developed in the Norwegian policy and regulatory context.
The results are summarised in the table below, showing that the Operational Pilot exceeded the target for CO2 emissions reduction by a comfortable margin (912 tons compared to 120 tons). The 4,210,405 zero km/year achieved represents a very significant increase factor, well above the original target of 1.5x which would correspond to 1,062,000 zero km/year. The initial indicated figure of 8% Energy Autonomy was not applicable as part of the baseline, as it was decided by the local OP partners that the PV installation was no longer part of the design set-up to be installed. No additional renewable energy generation was installed either, which means there was no increase in energy autonomy achieved for the Oslo Vulkan OP.
At the commencement of the project, peak demand value for EV charging was 64.9 kW. As a reflection of the success of the Vulkan car parking garage (contributing in a major way to clean transport in Oslo), at the end of the pilot (prior to COVID-19 restrictions affecting the use of the car parking garage), the peak demand for EV charging had risen to 378 kW. Whilst no actual grid investment deferral occurred during the OP itself, the OP demonstrated how the 50 kW BESS could be effective in reducing peak demand and deferring grid investment. Data available covers the period from when the BESS was first put in operation in February 2017 until March 2020. The BESS was configured such that if the total EV charging demand exceeds a pre-set threshold, the BESS would discharge to support the EV charging infrastructure, and if the EV charging demand drops below a pre-defined threshold the BESS would charge from the grid. The BESS was also set to do phase-balancing in addition to provide power to reduce peak demand.
Data collected showed that the peak demand at the commencement of the pilot occurred on 24th March 2017 and was 64.9 kW. Measured data showed that negligible BESS discharge actually occurred during the peak hour, which could be due to the way the system was set up (providing two functionalities, phase balancing and peak demand support). Examination of the data showed periods when the BESS was discharging 25 kW or even higher to support the grid, but the timing of this did not seem to be synchronized to the peak hours. Had the BESS system produced 25 kW at the appropriate time, peak demand would have been reduced by 38% (based on 64.9 kW peak demand). Obviously, the BESS is capable of supplying up to 50 kW, but we deduce that the maximum power is not usually used in order to protect the state of health of the battery (i.e. to prolong battery life).
Data collected showed that the highest peak charging demand of 378 kW was recorded on 23rd January 2020 (towards the end of the pilot). However, the contribution from the BESS was also negligible during the peak hour. 50 kW output power from the BESS sustained for the peak demand would have reduced this peak demand figure by about 13%. This reduction in peak demand reflects the deferral in grid reinforcement, as the required grid capacity is proportional to the peak demand.
According to the data examined, the BESS system did appear to act to reduce the grid demand within a given month, but was not necessarily reducing the highest peak demand (which is the basis for calculating the charge to be paid for maximum demand according to the electricity tariff used). If the peak demand in a given month could have been reduced by the BESS maximum output of 50 kW, then under the current (revised during 2019) Norwegian grid regulator system, there would have been ‘Effektledd’ savings of NOK 7500 for that month. This indirectly reflects a proportional deferral in grid reinforcement.
Oslo Vulkan Operational Pilot – KPIs
KPI TARGET RESULTS
A CO2 Reduction 90 – 120 tonnes annually 912 tons/year
Sub-KPI: ZE km increase factor 1.5 x ( i.e. 1,062,000 km/year) 5.95 (i.e. 4,210,405 km/year)
B Energy Autonomy increase from 8% to 10% N/A
C Grid Investment deferral (by peak demand reduction)
Table of Contents
EXECUTIVE SUMMARY ... 2
GLOSSARY ... 6
1. ABOUT THE PILOT ... 7
Background ... 7
1.1.1. Local context and energy profile ... 8
1.1.2. Local partners ... 10
1.1.3. Objectives and SEEV4-City KPI targets ... 11
1.1.4. System design ... 12
2. DATA COLLECTION AND PROCESSING ... 19
Assumptions and research questions ... 19
Data processing... 19
2.2.1. Dataset 1 – EV chargers’ dataset... 19
2.2.2. Dataset 2 – load profile ... 25
2.2.3. Dataset 3 – Ferroamp database... 26
2.2.4. Data availability evaluation ... 29
3. SEEV4-CITY RESULTS – KEY PERFORMANCE INDICATORS (KPIS) ... 30
Methodology ... 30
Baseline and Final measurements ... 31
3.2.1. Component data requirements ... 32
3.2.2. Baseline and Final measurements ... 32
KPI results conclusions ... 33
3.3.1. Increasing EV users in Oslo and Norway ... 33
3.3.2. CO2 Reduction or Savings ... 35
3.3.3. Energy Autonomy increase ... 38
3.3.4. Grid investment deferral ... 38
4. COST-BENEFIT ANALYSIS ... 44
Generic Business Model ... 44
Local/Regional and national subsidies and incentives ... 45
Base case for EV charging ... 47
Cost-benefit analysis ... 49
4.4.1. Tariff Analysis ... 50
4.4.2. Example of Cost/Revenue analysis based on 2017 data ... 59
5. LESSONS LEARNT FROM THE DIFFERENT PILOT PHASES ... 62
Preparation and initiation ... 62
Procurement ... 63
Operation ... 64
Overall for the Vulkan OP ... 65
6. CONCLUSIONS AND RECOMMENDATIONS ... 67
Issues for further consideration ... 67
OP site-specific recommendations for the future ... 67
Relevant dimensions for Upscaling and Transnational potential ... 68
6.3.1. Oslo ... 68
6.3.2. Norway nationally ... 69
6.3.3. Transnationally ... 71
REFERENCES ... 72
Glossary
Abbreviations Terms
AI Artificial Intelligence
API Application Programme Interface BEV Battery Electric Vehicle
BESS Battery Energy Storage System CCGT Combined Cycle Gas Turbine
CCS Combined Charging System
C-rate Battery charging/discharging rate relative to its maximum capacity (1 C refers to charging of a battery from flat to full capacity in 1 hour) ES / ESS Energy Service / Energy Storage System
EV Electric Vehicle
DuOS Distribution Use-of-System FFR Firm Frequency Regulation
FIT Feed-in Tariff
ICE Internal Combustion Engine
ICT Information and Communication Technology ITS Intelligent Traffic System
KPI Key Performance Indicator LCOE Levelised Cost of Energy LV / MV Low Voltage / Medium Voltage MEF Marginal Emission Factors
NPV Net Present Value
OCGT Open Cycle Gas Turbine OCPP Open Charge Point Protocol OEM Original Equipment Manufacturer
OP Operational Pilot
OSCP Open Smart Charging Protocol PHEV Plug-in Hybrid Electric Vehicle
PV Photovoltaic
RDE Real Drive Emission
RES Renewable Energy Generation Source
SC Smart Charging
SoC State of Charge
TCO Total Cost of Ownership
TCU Total Cost of Use
USD US dollar
V2B Vehicle to Business
V2G / V2N Vehicle to Grid / Vehicle to Neighbourhood (E)V4ES (Electric) Vehicle for Energy Service (eV4ES)
1. About the pilot
Background
The Oslo OP, which includes the EV charging and the associated support infrastructure at the Vulkan estate car parking garage, is near to the centre of Oslo on the Vulkan estate in the Grunerlokka area 1. It is one of the largest and most advanced EV charging garages in Norway and Europe (though it also still caters for conventionally fuelled automotive vehicles). The total capacity is currently 450 parking spaces, with 102 car parking spaces with chargers reserved for EVs.
The overall Vulkan estate is a mixed-use area of a large market hall (Mathallen), shops, restaurants and cafes, two hotels, a conferencing facility (Dansens Hus), premises for concerts, dance and sport, offices and private residences, 1 km from the very city centre and on a river walk. The Vulkan estate also has a bicycle garage, with 650 spaces for bikes across the Vulkan estate, and two dedicated zones within the Vulkan car parking garage (P1 and P2) 2.
The general site (not the OP boundary) characteristics of the pilot location are as follows: • Mixed use;
• Total buildings size: approx. 29,000 m2; • Occupancy number: 300;
• Vehicle numbers: approx. 300-400;
• Journey characteristics: Typically, mixed town/city duty cycles with short duration & distances.
Figure 1: Google Earth image of Vulkan estate within Oslo
The building which contains the OP facility houses a small grocery store, a pub and restaurant, as well as a three-storey parking garage (the actual boundary of the OP). With 102 EV chargers, including 2 rapid chargers 3 and an additional battery energy storage system (BESS) for smart charging and peak demand shaving, this pilot (as part of the SEEV4-City project) offers a unique neighbourhood scale (vehicle to neighbourhood or V2N) case which is serving both residents, public users and commercial companies. It is an embodiment of the expected fusion between the building, energy and transport sectors (yet limited, as no overall building energy
1 Vulkan estate is the name given to the former industrial area on the western bank of Akerselva river, north of Møllerveien road,
which has been revitalised and regenerated since 2004. https://aspelinramm.headingnorth.at/vulkanoslo.no/wp-content/uploads/20151118-Vulkanfolder-eng-02.pdf
2 http://remakingthecity.urbact.eu/vulkan-mixed-use-development-oslo-norway--103.case
demand functions are supported) 4. There are also several racks for bicycles and some repair equipment. Infrastructure for electric scooters and other micro-mobility devices, such as pedelecs (electric pedal assisted bicycles or even electric skateboards and Segway’s has been discussed but are not yet installed (and are external to the SEEV4-City operational pilot).
With over 100 EV chargers, the Vulkan estate car park is one of the largest, in terms of EV charging capacity (EV chargers and EV parking spaces), in Oslo – with a higher capacity than the (EV only ‘Akerhus’ or ‘Fortress’ under-ground EV car parking garage (with 86 Type 2 chargers) 5.
During the day, Vulkan operates as a ‘centre of excellence’ for professional users of EVs such as electric taxis, electric freight vehicles and EVs for professional services, as well as car sharing and Car2Go services. At night, Vulkan currently offers free over-night EV charging for people living in the Vulkan (adjacent) neighbourhood (though this is meant to come in line with the on-street EV charging provision across Oslo 6). The actual use of the parking garage purely for parking access is separately charged (by One Park, on behalf of the building owners, the real estate company Aspelin Ramm), and for residents built into contractual agreements they have for their apartments. Besides the different day and night users, the Vulkan car parking garage is also a hub for EVs that use overnight charging at home, in combination with (semi-)quick charging during the day. This creates a flexible and cost-efficient site for the promotion of EVs. Tesla EVs can also be charged at some of the EV chargers at the Vulkan car parking garage (i.e. the two DC ones, which have both a CCS and a CHAdeMO connection point each).
Between 300 to 400 (and occasionally even more than 400) EVs are served on a daily basis according to Oslo City Council (before COVID-19 restrictions), and the turnover in terms of kWh per week has tripled since the opening of the EV charging facilities at Vulkan car parking garage in February 2017.
Figure 2: One of the entrances to the Vulkan car parking garage
1.1.1. Local context and energy profile
The SEEV4-City operational pilot consists of 104 EV charging plugs (owned and operated by Fortum 7), i.e. 100 AC standard charging connectors and 4 DC rapid-charging connectors, as well as a 50 kWh stationary battery storage (also owned and operated by Fortum, and commissioned by Ferroamp) rated at 50 kW, which supply power during periods of peak demand. This may be looked at as a low-voltage nano-grid (grid-connected). The building which the Vulkan car parking garage is based in, has a maximum grid supply (service capacity) of 800 kW and, as a safety margin, this is usually kept below 700 kW. With the schematics and information provided by the pilot operator, the power distribution for the garage is analysed. The EV-charging infrastructure 4 https://www.seev4-city.eu/projects/oslo/
5 https://elbil.no/this-is-the-world-s-biggest-charging-garage/
6 https://www.electrive.com/2019/03/03/oslo-charging-electric-cars-no-longer-free-of-charge/
7 Fortum (Charge & Drive) is an innovation partner of both Aspelin Ramm (the real estate company owning & developing the overall
and the BESS are supposed to be connected to a common grid supply point via a single feeder which also supplies electricity to other loads of the car park (i.e. lighting and air conditioning).
Fortum Charge & Drive procures electricity from the central grid from an energy retailer in Oslo (through their Fortum Markets AS company), and is billed for this (under the service industry category). The Norwegian energy tariff and bill composition has changed during 2019, with now apparently lower energy (electricity) per unit costs but higher grid costs (especially peak power). In Norway (and Oslo), electricity prices now fundamentally consist of three parts: the basic power cost in Øre/kWh; a contribution towards the maintenance and development of the transmission and distribution systems known as the grid rent; and an element of taxation in Øre/kWh: VAT (‘MVA’) which is charged in addition on the sum of the above.
Currently, 98% of electricity in Eastern/South-Eastern Norway, including Oslo, is generated by hydro-power, with 1% generated by wind (and the remaining 1% could be anything imported) 8. Efficiency is 94% in the Mørkfoss-Solbergfoss hydropower station that powers much of Oslo when it opened in 1924, and the efficiency of Norwegian hydropower is now up to about 96%. The Oslo city region does not currently have a shortage of power. However, Oslo Energi and the City of Oslo have pioneered the use of an innovative revolving fund to promote energy efficiency since 1982 for the finance of energy efficiency, namely the Ekon Fund established by the City of Oslo in 1982 as a mechanism for providing and facilitating a pool of capital for retrofits. The Ekon Fund was developed by applying a small surcharge on each kilowatt-hour sold in Oslo 9. Solar energy is slowly on the rise in Norway, including in the Oslo region 10. There is a national solar energy cluster in Norway. There is also an Oslo Renewable Energy and Environment Cluster (for the Oslo and Akerhus regions) 11. Oslo City Council is offering individual householders a subsidy of 30% of the investment for solar panel installations. There is a national Norwegian Regulation on the requirements for Electric Vehicle Supply Equipment (EVSE) in new buildings and parking lots (Norwegian Ministry of Transport, 2016) 12. For parking lots and parking areas of new buildings, a minimum amount of 6% has to be allocated to electric cars. The Vulkan car parking garage in Oslo very comfortably exceeds this minimum.
The overall Vulkan estate is a full-scale example of sustainable urban development. Built upon the idea of sharing localities, equipment and resources, the area is virtually self-sufficient in energy for heating and cooling. Since 2004, the area has been transformed and revitalized by Aspelin Ramm and Anthon B Nilsen property developers, based on an overall plan by LPO architects. During the development of the new Vulkan estate, the developers and architects looked at how buildings, equipment, energy and urban spaces can be shared, and thus utilized more efficiently. The Vulkan estate has its own energy plant, distributing heat and regulating temperatures amongst the buildings. Excess heat generated from refrigeration and other facilities is used to heat rooms or hot water. This redistribution of energy gives significant environmental benefits. Vulkan’s energy plant is connected to Oslo’s district heating system, which is used as a reserve. When extra energy is needed, it can be drawn from a series of geothermal wells reaching 300 meters below the surface.
The Vulkan estate is home to Norway’s first hotel to be graded energy class A, Scandic Vulkan, as well as the first energy class A office building, Bellonahuset. The project has placed great emphasis on using eco-labelled materials with a small carbon footprint. Bellonahuset is an integrated part of Vulkan’s energy supply. The building’s facade collects solar energy which, via the local energy plant, is distributed to the entire area in the form of heat and hot water 13.
Whilst there was a plan in the inception stage of the SEEV4-City Vulkan car parking garage to add additional roof-top PV on the building which houses the car parking garage, either or both of the Board of Aspelin Ramm and/or residents influenced this in a different direction, perhaps due to fire safety concerns, towards roof-top beekeeping and urban farming for local honey and to support aphid biodiversity. According to the company that owns the Vulkan estate:
Two of the world’s finest beehives are placed on the rooftop between Mathallen and Dansens Hus. The Vulkan’s beehive has brought more bees to town, contributing to the effort to save these important insects. Billions of bees have disappeared in recent years. This is a big problem as bees are vital to food production through their role as pollinators. The areas around Akerselva, Telthusbakken and Gamle Aker Kirke provide abundant sources of pollen, nectar and water, used by the bees to make Vulkan honey during the summer season 14. 8 https://www.electricitymap.org/zone/NO-NO1 9 http://www.iiec.org/news/298-results-center/profiles/307-oslo-norway-comprehensive-municipal-energy-efficiency-profile-79 10 https://www.theguardian.com/sustainable-business/2017/mar/28/oil-and-gas-norways-fossil-free-energy-renewables-oslo 11 https://www.clustercollaboration.eu/cluster-organisations/oslo-renewable-energy-and-environment-cluster 12 https://www.eafo.eu/countries/norway/1747/incentives 13 https://vulkanoslo.no/en/about-vulkan/ 14 https://vulkanoslo.no/en/about-vulkan/
During the day, the Vulkan car parking garage operates as a ‘Centre of Excellence’ for professional users of EVs such as e-taxis, electric freight vehicles (vans) and EVs for business & services, including two car rental and an urban shared vehicles company (car-to-go from the Norwegian railways). It allows for pre-booking of (parking and) charging time, flexible charging, battery storage, and quick charging. At night, the Vulkan parking garage currently offers free residential EV charging for people living in the neighbourhood (though this is meant to change later during 2020 to fall in line with municipal policy on on-street EV charging 15. Besides the different day and night users, Vulkan is also a hub for EVs that use overnight charging at home, in combination with standard and rapid charging during the day. This creates a flexible and cost-efficient site for the promotion of EVs.
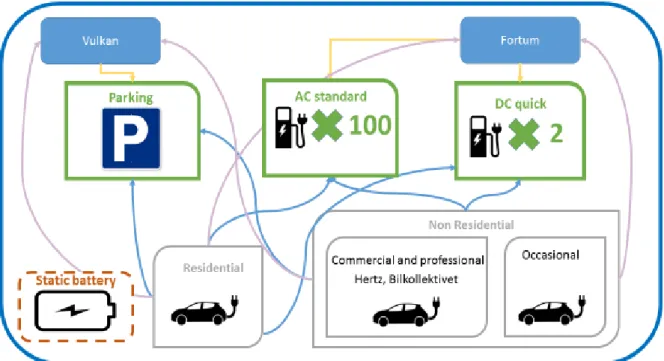
This is also diagrammatically displayed in Figure 3, where the yellow lines represent the management responsibility, blue line represents usage of parking and charging facilities, purple line business relations (for example payments made by the EV charging infrastructure users to Fortum Charge & Drive for charging) and brown dashed line for component with an unknown relationship, though both Fortum Charge & Drive and Ferroamp (in March 2020) stated that the BESS connects with the load represented by all the EV chargers together (with currently no differentiation in the system between AC and the DC chargers in the system currently) and which does not connect (to their knowledge or responsibility, at least) with any other major load demands in the car parking garage building.
Figure 3: Overview of the Oslo operational pilot
1.1.2. Local partners
Aspelin Ramm is the real estate company that developed and owns the overall Vulkan estate (an area outside the direct city centre which was converted from an outdated industrial area into a new and modern district, which today consists of businesses within culture, education, housing, hotels, commerce and dining, as well as Oslo's first and largest food hall/court) 16.
The SEEV4-City operational pilot at the Vulkan is focussed on aspects of one residential/commercial building complex, with the car parking garage, the 104 EV charging connectors and the BESS. Fortum uses the car park as an innovation testbed for smart management of EV charging and battery storage system (developed in turn by Ferroamp) 17.
Oslo City Council (at least until June 2022) rents car parking spaces overnight for local residents, in order to avoid the investment of on-street EV charging installations, as Oslo City Council has a target since 2019 to triple its EV charging station deployment even though Oslo has deployed more EV chargers per capita than most 15 https://www.electrive.com/2019/03/03/oslo-charging-electric-cars-no-longer-free-of-charge/
16 https://nordicpropertynews.com/article/2796/anthon-b-nilsen-sells-to-aspelin-ramm
other cities in the world. Over 60% of Oslo’s citizens are living in apartments or townhouses in Oslo, not in detached houses and villas with private charging opportunities. This means that not everybody can charge an EV at home, a common but serious challenge to a further electrification of transport in many urban areas and cities. The challenge is enhanced by the fact that all passenger cars sold will be zero emission by 2025 18. One Park is the appointed car parking garage manager (by the building owner Aspelin Ramm).
These are the main local partners in the Oslo OP. Those companies in turn sub-contracted other companies for specific technology (e.g. BESS, algorithm, ICT, app).
Table 1: Oslo Vulkan Car Parking Garage Pilot Partners List of partners Ownership/control of assets
Oslo City Council Local planning authority, and OP lead partner (and thus direct beneficiary of the match-funding from the Norwegian government under the SEEV4-City project, and investor of the other 50% of capital investment in the Operational Pilot. Also, at least until June 2022, a business partner of Aspelin Ramm in that Oslo City Council rents 100 car parking EV charging provisions overnight from them.
Aspelin Ramm Owner of real estate, including Vulkan car parking garage (car parking management is contracted out to One Park company)
Fortum Charge & Drive
EV charging systems innovation company, EV chargers’ owner as well as owner of the Ferroamp BESS, and electricity purchaser for the EV charging infrastructure. The development of the BESS was sub-contracted out by them to Ferroamp, and the development of the algorithm controlling the charging (from the grid) and discharging (to the EV chargers collectively) to another sub-contracted company.
1.1.3. Objectives and SEEV4-City KPI targets
The operational pilot aims to demonstrate the benefit of smart control of EVs and the associated ESS, as well as vehicle to neighbourhood (V2N), to reduce carbon footprint, alleviate local (low and medium voltage) power system stress, and achieve an economically feasible solution to the synergy between the building (though this is currently limited), energy and transport sectors.
The main objectives of the Oslo operational pilot are to achieve EV charging infrastructure-related load balancing for the local power network and to save on the electricity bill of the EV services provider in that way also, and at the same time to maximise the use by EVs of the car parking garage so as to promote the EV utilization more widely and to recover the cost of investment on the EV chargers and the BESS via different components of the OP business model. A return of investment for the SEEV4-City Oslo OP pilot is aimed at over a period of approximately 10 years, which is hoped to be reduced to about 8 years with the match-funding investment through the SEEV4-City project.
V2G implementation (beyond making the AC EV chargers ‘V2G-ready’) did not occur within SEEV4-City project duration, not least to the current Norwegian policy framework as yet on V2G [1]. The current two 50 kW DC rapid chargers (which Fortum obtained through Nissan) are apparently not yet ‘V2G-ready’, as they do not link to “the rest of the communications system”, that is Fortum’s (now Nordic-wide) Open Charge Point Protocol (OCPP) back-office (which is now upgraded to the 2.0 version).
The above-mentioned terms of smart charging (SC), V2B and V2G are collectively referred to here (and the SEEV4-City project overall) as EV for energy service (EV4ES). A successful business model is essential for the wide implementation of this EV4ES concept in real-life applications, and would therefore help to promote the EV utilization and achieve the ambition of City of Oslo to have more than 200,000 electric vehicles on its streets by 2020 19.
Different from most other SEEV4-City pilots, the Vulkan car parking pilot has no integration of locally generated renewable energy in the form of PV (see above). Norwegian power demand is supplied 98% from clean energy – i.e. hydropower [2]. The Energy Autonomy KPI therefore cannot be evaluated for this pilot. The SEEV4-City project uses other two key performance indicators (KPIs), namely CO2 emission savings and grid investment deferral, to measure the environmental and economic benefits achieved by providing EV4ES. The electric vehicles analysed in this pilot, either battery electric vehicle (BEV) or plug-in hybrid electric vehicle (PHEV), are referred to as ‘EV(s)’ in the rest of this report. It is also worth noting that the Vulkan parking garage does not only provide parking facility to BEVs and PHEVs, but also to (and currently at least in the provision of spaces,
18 https://carbonneutralcities.org/building-a-ubiquitous-electric-vehicle-charging-infrastucture/ 19 https://www.seev4-city.eu/projects/oslo/
and perhaps also utilization) internal combustion engine (ICE)-based vehicles (which are not within the scope of the SEEV4-City project or this pilot).
Table 2: Oslo Vulkan car parking garage pilot’s SEEV4-City KPIs targets Oslo Vulkan OP – KPIs
KPI Target
A CO2 emission savings 90-120 tonnes annually Sub-KPI: ZE km increase factor Increase factor 1.5 B Energy autonomy increase Not applicable C Grid investment savings/deferral (by peak demand
reduction)
20% peak reduction
1.1.4. System design
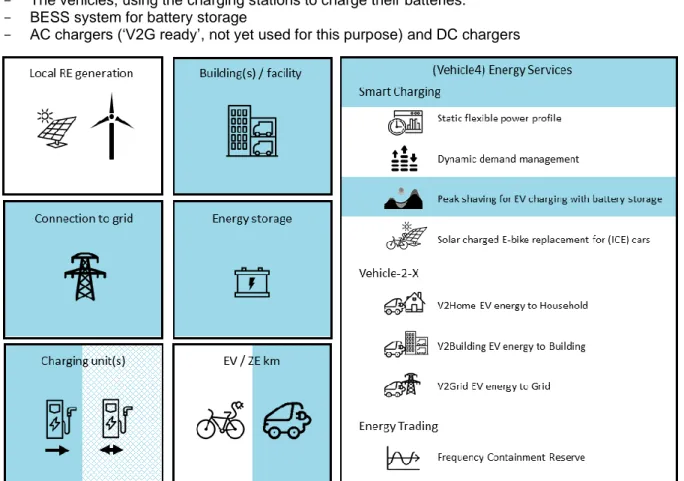
The Oslo operational pilot represents a unique setting of integration of EV charging infrastructure energy, stationary grid connected electricity, electric transport and EV parking. The system used to develop the (Vehicle4) Energy Service (V4ES), is composed of several building blocks as visualised in Figure 4:
- The local voltage network, distributing the energy to the charging stations. - The vehicles, using the charging stations to charge their batteries.
- BESS system for battery storage
- AC chargers (‘V2G ready’, not yet used for this purpose) and DC chargers
Figure 4: Pilot V4ES solution(s) building blocks
Following on from the business structure as depicted in section 2.1.2, the Oslo operational pilot setting as well as the timelines of the events will be explicitly presented.
The Vulkan parking garage serves both residential and commercial EVs, which can choose to charge from the 100 AC standard charging connectors and the 4 DC rapid charging connectors (for those only one EV can charge at any one time, as the internal architecture does not allow for simultaneous CHAdeMO and CCS charging).
Apparently, there is currently no dynamic smart charging of EVs in place at the Vulkan car parking garage. Since there are currently also no dynamic electricity tariffs/prices in place in Norway or Oslo, this is not
surprising. However, there is some intervention during peak power demand times from the installed stationary battery (BESS). The BESS is recharged from the grid at demand trough. As such, smart charging is implemented by Fortum Charge & Drive. On the other hand, smart parking management is handled by One Park to maximise the utilization of the car park (but with no information on this supplied to the SEEV4-City project or for analysis in this report).
Table 3: Oslo Vulkan Car Parking Garage Pilot Overall Specifications
Component Description
PV system Pilot setup changed at the implementation phase, therefore no local PV
EVs Owned by residents, professional service companies, car rental companies (both BEV and PHEVs) and NSB car-to-go (Renault Zoe)
EV Chargers 50 AC chargers/units with two connection points each– flexible since December 2017
2 DC fast chargers
Stationary Battery Storage system with inverter for phase-balancing
50.4 kW Ferroamp Li-ion battery, and 50 kW inverter
The Vulkan estate car parking garage of the Oslo OP has 50 AC chargers (with two connectors each) and also two 50 kW DC chargers. The 100 AC charging connectors can be used in a charging speed range from 3.7 to 22 kW/h, depending on the EV on-board controller. The V2X units require a software modification, which has been done as part of the project for the AC chargers (which are now ‘V2G ready’) in order to interact with V2X-enabled EVs 20. Users are able to choose what speed to charge with via a mobile application. The AC charger users can now charge at 3.7 kW, 7.2 kW, 11 kW and 22 kW, and the installed software allocates the highest charging speed that an EV can handle in this regard if there are no peak power issues. According to Fortum Charge & Drive, it turned out to be too complex for the users to deal with a price model of differentiated fees for the different AC charging speeds.
Fortum Charge & Drive tested differential charging fees per AC charging speed, which were discarded after not picking up any (favourable) customer response to this, and they simplified this into one single fee for AC charging. This pricing model, according to Fortum Charge & Drive, seems to be working better for the EV drivers. The flexible choice is still in operation and seems to be working for Aspelin Ramm, Fortum Charge & Drive and the users. The volume of EV charging has been increasing significantly (prior to COVID-19), so the Return-on-Investment (ROI) for Fortum Charge & Drive and Aspelin Ramm is improving.
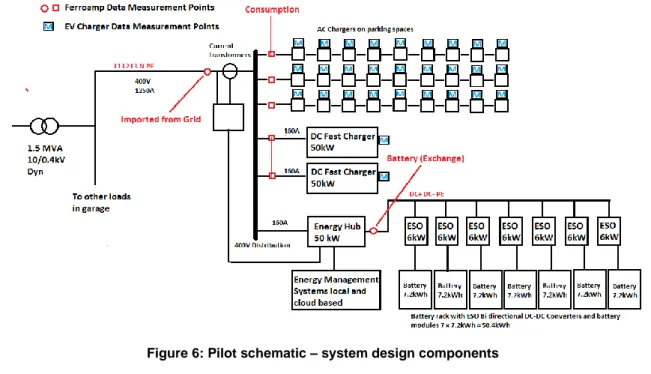
A block diagram of the electrical power supply to the EV chargers and the car garage is shown in Figure 5. This diagram is derived from a set of original schematics to illustrate the whole system which was intended to be built. One of the original schematics is enclosed in the appendix. As shown in the block diagram in Figure 5, the nexus of the distribution network is a main substation for the EV charging facility (labelled 435.02.01 in the original schematics) that is supplied from the grid. The 2 DC fast chargers and the 50 AC chargers that are installed throughout the three-storey car parking garage and the BESS are all fed from this nexus. There are 16 AC chargers on the first floor and 15 AC chargers on the second floor. On the third floor, there are 19 AC chargers and 2 DC fast chargers. It is worth noting that there are also loads which are unknown from the original schematics that are fed from the nexus as well. The so-called “to other loads in garage” are supposed to be the lighting and/or air conditioning and perhaps also heating, according the information provided by the pilot. The schematic of the Oslo Pilot is shown in Figure 6, where a 1.5 MA transformer is used to feed the whole EV charging and BESS from the medium voltage grid. Based on the information provided by the OP, there are no additional ‘significant’ loads except the EV charging stations that are connected to the local grid fed by the 1.5 MVA transformer. The local grid is a 400 V distribution network with a 1,250 A feeder to the car parking garage. Currently, according to the Ferroamp portal and an interview with Ferroamp engineer, less than 70% of this 1,250 A feeder capacity is currently used. The 7 battery modules (of which two are currently faulty since the 20 A report by Cenex UK [3] maintains that ‘AC V2G is generally seen as a theoretical concept as it requires additional hardware to be
installed in the vehicle which many car manufacturers believe will lead to lower efficiencies and higher costs. However, while there are no commercial AC V2G warrantied vehicles currently in the UK market, Renault (with the Zoe) and BYD (with the e6) have been trialling AC V2G since 2015 and Hyundai Mobis announced in 2017 that it had developed a two-way on-board charger (OBC) for future electric and plug-in hybrid vehicles’, see: ( https://www.cenex.co.uk/app/uploads/2019/10/V2G-Market-Study-FINAL-LCV-Edition-with-QR-Code.pdf). There is also, for instance, an AC-based V2G trial in Utrecht with modified Renault Zoe EVs, see: https://easyelectriclife.groupe.renault.com/en/outlook/energy/renault-tests-its-bi-directional-charging-system-in-utrecht/
The Cenex UK study refers to Norway’s market readiness interms of Demand Side Response (DSR) as ‘partially opening’. The recent journal article by Kester et al. (2018) [1] comes to a similar conclusion (http://sro.sussex.ac.uk/id/eprint/73770/3/1-s2.0-S0301421518300995-main.pdf ).
end of 2019) of the Ferroamp stationary battery (50.4 kWh) are connected through a DC-bus to a 760 V DC nanogrid. The EnergyHub in the diagram is the (single) bi-directional inverter, which can both supply power to the EV chargers and take it from the grid as well. The EnergyHub also performs the important phase balancing – which is uneven loading of the three phases – at the Vulkan car parking EV charging installation.
Two data acquisition and recording systems, namely the EV charger information systems (first locally by Fortum Charge & Drive, and then migrated to Fortum Charge & Drive’s Nordic back-office and periodically provided to UNN by Excel files) and the Ferroamp live online monitoring system (with UNN access under a Non-Disclosure Agreement with Fortum Charge & Drive), are adopted to record the measurements of the electricity distribution networks.
Figure 5: Block diagram of the power supply system to the EV chargers, SESS and the garage.
The measurement points of the data acquisition system for the pilot are shown in Figure 6, where the blue M with white background indicates the assumed measurement points of energy consumed for EV charging at every individual charging station. This is an event-trigger recording system and records the connection starting time, connection end time, and as well as the electricity consumed by each EV charging activity. It is worth noting that the schematic diagram of the pilot operator shown in Figure 6 has been revised according to the in-depth analysis of the detailed schematics provided by the pilot operator. For the original schematics, please see the Appendix where a PV system is shown but this has never been deployed with regard to the system actually installed in this operational pilot.
Figure 6: Pilot schematic – system design components
The energy management (Ferroamp) system shown in Figure 6 is a cloud based and time-triggered data-recording system that measures the power and energy “imported from grid”, “battery (exchange)” and “consumption (of all EV chargers)”. The measurement points of the Ferroamp system are inferred from the information provided by Fortum Charge & Drive, as well as from Ferroamp as their supplier, and are labelled in Figure 6 with a red circle or rectangle.
It is stated by the pilot field operator that the “consumption” data of the Ferroamp system only measures the consumption of the EV chargers. However, the UNN data analysis shows that the value of energy consumption derived from the EV charger system (at least going by those Excel files that were provided) and the value of the “consumption” data in the Ferroamp system are mismatched, although other Excel files forwarded with energy/ power “consumption” (unspecified) match the “consumption” in the Ferroamp system neatly with only a marginal difference.
It is still unknown if the very significant mis-match between the EV chargers Excel sheet-based information (much lower, by a factor of nearly 3) and both the other Excel datasets on “consumption” and the live Ferroamp systems’ “consumption” is caused either by the incomplete data records of the EV charger system, or perhaps by both the “consumption” data of the second Excel files simply labelled “consumption” and likewise the “consumption” category in the Ferroamp system including both the consumption of EV chargers and other loads (e.g. car parking garage lighting and other features to explain the large difference).
There are three (types of) main devices operated in the distribution network, namely, the EV Chargers consisting of both AC and DC faster chargers, the BESS, and an Energy Management System. It is worth noting that no PV system is installed/deployed with regard to this operational pilot.
1. EV Charging Stations
There are both AC charging stations/units and DC charging stations/units, which are supplied from the main 1,250 A feeder. The 50 kW DC fast chargers are connected to the 3-phase 400 V distribution network. The AC charging stations at the car parking garage are organized in three lines associated with the power supply of three phases. The charging power at the AC outlets may vary from 3.2 kW to 22 kW, depending on the connected EV, and the total load on the AC and DC chargers collectively. The distribution of energy between the chargers are calculated by an algorithm.
Without more details of the algorithm (which neither Fortum Charge & Drive nor Ferroamp have in any detail or resolution), it is unknown how the charging speed is decided to distribute charging power among the EV charging stations – other than that there is phase balancing implemented (as quite a few of the charging EVs are single-phase, and this can cause significant power imbalances between the three phases overall, depending where they are connected).
Other than the BESS, apparently there is no other system’s function that is controlling the chargers apart from the charger controller to ensure each EV is getting the power it requests. The BESS is used to reduce the power demand in addition to provide phase balancing.
2. Energy management system
This is a cloud-based energy management system, called Ferroamp, but with no active or dynamic involvement of EV users/owners or the building owners in the operation of the BESS. Currently, the technical set-up is that an EV, through the EV charger, will obtain the highest charging speed the EV charge controller requests. The Ferroamp system records the energy exchange between the BESS, the grid and the EV chargers. This is denoted as EnergyHub in the Ferroamp schematic. The bi-directional inverter, can take energy from the AC side to charge the stationary battery and can also take energy from the stationary battery to support the AC chargers side. The BESS also performs the function of phase balancing.
The energy management system was launched in February 2017, which records energy imported from (main) grid, consumption (by the car park) and the energy exchange with the BESS.
Peak shaving and phase balancing of the EV charging infrastructure are the main functions of the BESS. The peak shaving is based on real time measurements of EV charging infrastructure power consumption. If total import power from the grid exceeds a pre-set threshold, the stationary battery will start to discharge to try to keep imported power from the grid below the threshold. If import power from the grid is below the threshold, the stationary battery will charge from the grid.
In addition to the peak shaving, the inverter is also controlled to provide a phase balancing function. This function is executed by measuring the total grid 3-phase currents and transferring energy between the phases to balance and thus minimize the individual grid currents. The maximum current balancing of the present inverter is about 40 A. The phase balancing function does not need to cycle the stationary battery to operate, and is essentially independent from the battery; however, some of the inverter capacity is used when the battery is discharged and battery operation is then prioritized in terms of the inverter function.
3. Battery energy storage system (BESS)
The BESS is a 50.4 kWh stationary battery, consisting of 7 battery modules of 7.2 kWh each operating as a 760 V DC nanogrid. The BESS has a 50 kW inverter. The DC nanogrid exchange energies with the 400 V AC distribution network via an inverter, referred to as EnergyHub in Figure 6.
The energy storage solution will shave the peak before this, but the amount of energy stored is limited (50 kWh); the BESS has two pre-set thresholds: when the garage EV charging demand is over a pre-set threshold, the stationary battery discharges to shave the peak demand. If the EV charging demand is less than a pre-set threshold, the stationary battery starts charging from the grid.
At the beginning, this was set to as follows: if the total consumption of both AC and DC charging together exceed 200 kW, then the BESS discharges to support the EV charging infrastructure, and if the EV charging infrastructure consumption drops below 150 kW the BESS would charge from the grid.
Since early March 2020, the BESS has been operated in the following thresholds:
• Discharging threshold 270 kW: discharging when the car park power consumption is over 270 kW; • Charging threshold 250 kW: charging when the car park power consumption is lower than 250 kW. There are different layers of defence against the power peaks associated with EC charging:
• Typically, the way Ferroamp sees their system is that “there is a first layer of defence which is the phase balancing. A lot of the EVs in Oslo are still single-phase chargers, and they end up on different phase connectors, depending on which parking spot they occupy. At the Vulkan car parking garage one does therefore see a very large phase unbalance. And this means that one can have perhaps 500 A in one phase connection and 300 A in another. This is also limiting the capacity that one can take from the grid. We have a first layer of defence to balance the phase consumption. This is something that the inverter does, and there is no need for the stationary battery for that. So, it is sort of absorbing: as an example, if one 300 A on two phase connectors and 500 A on the third one, the inverter takes energy from the two phase-connectors with 300 A and injects it in to the one with 500 A. Therefore, this is dynamically balancing and results in some more headroom for additional EV chargers;
• The second line of defence is the battery. Even with the dynamic phase balancing system there is a current limit. Then the battery is activated to provide energy to the chargers;
• And then, as a third line of defence the EV’s charging capacity is reduced. A third line of defence, such as an energy management system, needs to tell an EV charger/ EV that it cannot charge at 10 kW etc. and that this speed has to be to reduced. Currently this is not technically provided, and not performed at the Vulkan car parking, as the EV charging installation is not yet at its full cable capacity in this building. There is no need to do this, at least from that perspective.” (source: interview on 26th of March 2020 with Björn Jernström, Ferroamp engineer).
This car parking garage contains 104 charging connectors in total, i.e. 50 AC standard chargers (Type 2) and 2 DC fast chargers, each one with two charging connectors. The technical parameters and configuration of the charging stations are listed in Table 4. For the EV charging stations, an application programme interfaces (API) is provided for the EV chargers to decide when and how much energy will be charged, in conjunction with the on-board vehicle electronics.
Table 4: Technical parameter setting for the EV charging infrastructures
Variable Value Unit
AC charger speeds (from Dec 2017) 3.7, 7.4, 11, or 22 kW DC charger charging rate 50 (fixed) kW
Since December 2017, the 50 AC chargers have been enabled for smart charging with flexible charging rates at namely 3.7 kW, 7.4 kW, 11 kW, or 22 kW. The two DC fast chargers can both provide 50 kW and have two plugs each, one CHAdeMO and one CCS (400 V/ 125 A). This is in line with other fast chargers in and around Oslo (except for a few 44 kW chargers).
As mentioned in the background of the Oslo pilot, free parking is available (for local residents) from 5 p.m. to 9 a.m. the next morning. The price for using this car parking garage for the rest of the day is 15 NOK per commenced 30 minutes with a max of 270 NOK per single parking event within 24 hours 21.
The cost for DC fast charging has been fixed at 2.5 NOK/min from the beginning of the car park operation. EV charging via AC chargers was free since the beginning of the pilot between 5 p.m. – 9 a.m. weekdays and 5 p.m. – 11 a.m. on the weekend. An AC charging price during the day, which is charging rate dependent, was introduced on 23rd October 2017 – as detailed in Table 5. This was replaced (in December 2018) by a uniform daytime price for AC charging of 2 NOK/min, regardless of the charging speeds.
Table 5: Economic parameter setting for the OP
Variable Value Unit
AC charger rates (from Dec 2017) 3.7 kW, 7.4 kW, 11 kW, or 22 kW kW
DC charger rates 50 kW kW
AC charging cost • Free between 5 p.m. - 9 a.m. on weekdays and 5 p.m. - 11 a.m. on weekends
• Daytime charge from 23rd Oct 2017: o 22 kW @2.75 NOK/kWh o 11 kW @2.5 NOK/kWh o 7.4 kW @2.25 NOK/kWh o 3.6 kW @2.0 NOK/kWh
• Daytime charge since Dec. 2018, and currently still in place:
o 3.7, 7.4, 11, and 22 kW @2 NOK/kWh
NOK/kWh
DC charging cost 2.5 (3.1 from early 2020) NOK/min
Parking cost • Free for 5 p.m. - 9 a.m.
• Otherwise 15 NOK per commenced 30 minutes up to 270 NOK per coherent parking period within 24 hours
Stationary battery size 50.4 kWh
Stationary battery charging rate Up to 50 kW
Electricity tariff price 0.8 NOK/kWh
Building load limit 800 kW
AC standard charger cost 65,000 NOK
DC fast charger cost 1,500,000 NOK
The timelines of the pilot evolution are summarised in Table 6. This is based on the information provided by the pilot and those collected from the related websites. It could be seen from this table that the smart charging functionality for AC chargers is enabled from December 2017. This is to achieve part of the load balancing 21 As found on: https://onepark.no/parkering/oslo/vulkan-p-hus/ (Norwegian translated to English)
target, i.e. to control the building demand within the safety margin of 700 kW out of the 800 kW electrical limit for the Vulkan car parking garage. The associated protocol has also been upgraded around May/June 2018 from OCPP 1.6 to OCPP 2.0.
Table 6: Timeline of events for Oslo Vulkan can parking garage pilot
Jan 2017 Start of data collection
Feb 2017 Activation of Ferroamp database
Oct-Nov 2017 Introduction of payment for AC day-time charging Nov 2017 End of first data set
Dec 2017 • In Dec 2017, the standard chargers were replaced with flexible-speed ones;
• all AC and DC chargers are (collectively) involved with load balancing through the BESS; • all AC chargers are enabled for Smart Charging.
May 2018 • Fortum migrated to Nordic operations to a brand-new back office system, with new native apps to end users; suspension of charging fees during this migration;
• At the end of May 2018, Fortum Charge & Drive rolled out a new AC day-time charging (by different speeds) pricing structure.
End of June / October 2018
• Monitoring during new AC differentiated pricing structure;
• At the end of the trial period (June/October 2018), Fortum decides to remove the speed-differentiated AC charging pricing structure, and puts in place one single fee for AC day-time charging;
• Now users cannot select the charging speed & the highest charging speed is used regardless how a user chooses to start charging (RFID, SMS or App).
Potential events and updates
• According to Fortum Charge & Drive, exact future new pricing – if revised – is likely to be combination of user, load and time specific pricing;
• All AC outlets are ‘V2G ready’ (from December 2018 onwards); but the DC chargers are not since they cannot currently communicate with the Fortum Charge & Drive Nordic back-office; • More V2G capable vehicles are needed in Oslo – EV -based software to enable V2G
charging is needed;
• Perhaps super quick chargers to be introduced (100 kW or above) by either Fortum Charge & Drive or Aspelin Ramm in the future, but Oslo City Council left that investment decision in the end only to them and not to be co-financed by the SEEV4-City project or OCC.
2. Data collection and processing
Assumptions and research questions
The following key assumptions are made in conducting the evaluation of Oslo pilot, in line with the SEEV4-City project methodology. These assumptions are held throughout the pilot analysis and are arranged in the order when they first get mentioned in this report:
• The methodology for energy autonomy is defined in this report as part of the KPIs, but the associated evaluation is not implemented here due to the absence of the PV installation.
• Battery degradation is not considered in the Oslo OP implementation for the stationary battery. The EV battery degradation is not within the boundary of the SEEV4-City project.
• The stakeholders considered within the boundaries of the Oslo pilot include Aspelin Ramm (the real estate company that developed and owns the overall Vulkan estate), Fortum Charge & Drive (which equipped the Vulkan car parking garage with 52 chargers or 104 EV charging outlets and used the car park as an innovation test bed for smart management of EV charging), and One Park (the car park manager).
• The overall aim of the pilot is to achieve load balancing for the local power network and thereby also save on electricity costs for the EV charging service company, and at the same time maximise the utilization of the car park, so as to promote the EV utilization and to recover the cost of investment on EV chargers and the BESS.
• The BESS supplies both the AC and the DC quick chargers and during periods of peak power demand by them.
• Charging duration and connection/parking duration: the data “duration” in Dataset 1 is the parking time (also referred to as connection time), represent the duration how long an EV is connected to a charging station. This is the minimum time an EV parks at the parking space provided with an EV charger. During this period, the EV may not always be charging, for example, when the battery has been fully charged. Then the actual charging time is equal or less than the connection/parking duration.
• The consumption data in Dataset 3 (i.e. the Ferroamp database) is now assumed to cover the EV charging profile and stationary battery charging only.
Data processing
As detailed in Table 7, three type of datasets were made available regarding the power/energy flow for each of the energy components in the Oslo pilot, directly or indirectly from the associated OP stakeholders.
Table 7: Data procurement information for the OP
Datasets Providers Time reached UNN Data period
Dataset 1: EV chargers in Excel file
Fortum Charge & Drive [indirectly, through the then SEEV4-City project coordinator] November 2017 Jan 2020 01/01/2017 – 16/11/2017 June/2018 – Jan/2020 * Dataset 2: Load profile in
Excel file [without any specification or clarification as to what constitutes this load]
Isak Oksvold from Aspelin Ramm Eiendom AS
November 2018 12/03/2017 - 21/06/2018
Dataset 3: Ferroamp (online database)
Snorre Sletvold from Fortum Charge & Drive
November 2018 20/02/2017 – present **
Note: * Data from June 2018 to Dec 2018 is invalid due to very low number of charging sessions. ** Data from 13/04/2018 to 07/06/2018 is missing.
2.2.1. Dataset 1 – EV chargers’ dataset
The EV chargers’ dataset recorded the start charging time, energy charged and duration of each charging session, for both the AC and DC chargers. Two data sheets, titled ‘DC’ and ‘AC’, are available in the excel data file provided by Fortum Charge & Drive. The charging duration in the ‘AC’ sheet showed the same value for all the charging sessions per charging device, which is probably due to erroneous readings. An example is shown
in Figure 7. This was later confirmed in a telco with the Fortum Charge & Drive IT back-office (Oscar Ekman) as unlikely to be correct. The data in the ‘AC’ sheet was therefore excluded from the analysis. Charging records for both the AC and DC chargers with correct charging duration were found in the ‘DC’ sheet, where the AC charging events can be matched up with those from the ‘AC’ sheet. The two charging outlets for each of these AC 50 chargers can be identified by the property of ‘Resource’ in the ‘AC’ sheet, and these constitute the 100 AC chargers as per the pilot setting. The following analyses were therefore carried out based on the currently available data from the ‘DC’ sheet, covering 01/01/2017 - 16/11/2017.
Figure 7: An example of data recording error in Dataset 1
(some outlier data is also presented in the data set, see the highlighted numbers in the red colour)
Number of charging sessions per charging station
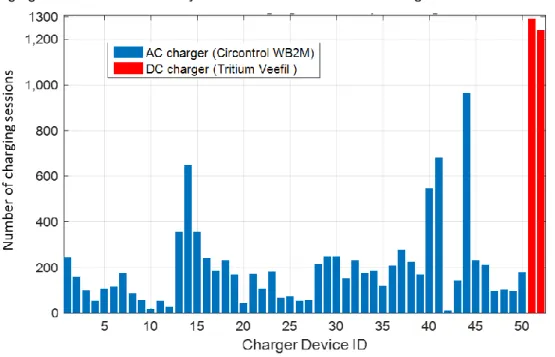
First, the number of charging sessions for each chargers, AC and DC, are shown in Figure 8 where the utilization of the two DC chargers outnumbered that for the AC chargers. Another observation from Figure 8 is that the number of charging sessions are not evenly distributed between the AC chargers.
Figure 8: Number of charging session per charger
Table 8: Statistics on EV connection duration 100 standard AC Type 2 chargers 2 quick DC chargers Total
Charging sessions – Total 7,085 3,007 10,092
Charging sessions – Average per day 9.426 22.210 31.636
kWh charged – Total 93,450.89 27,188.28 120,639.2
kWh charged – Average per session 13.19 9.04 11.95
kWh charged – Average per day 292.95 85.23 378.18
Minutes spent charging – Total 1,289,470 64,520 1,353,990
Minutes spent charging – Average per session 20 21.46 20.73
Minutes spent charging – Average per day 4,042 202 4244
EV connection and charging durations
As discussed in the assumption section, the data “duration” in Dataset 1 represents how long an EV is connected to an EV charging station. That may or may not be equal to how long the EV parks at the parking space, but obviously the parking time would be at least the length of the connection time. However, depending on the battery status (or the charging policy), the connection time is not always the same as the charging time. During the period of parking time, the EV may not always be in charging operation, for example when the battery has been fully charged. Then the actual charging time is equal or less than the connection duration. However, the connection time is a good index for the charging time, in particular, when the connection duration is relatively short and the EV leaves without being fully charged.
The histogram of the EV connection time, for both AC and DC chargers, is illustrated in Figure 9, As can be seen, the frequency of connection duration decreased exponentially over time and short length charging (within half an hour) was the shown as the prevailing charging behaviour. Comparing the connection duration of year 2017 (Figure 9, on the left) and that of year 2019 (Figure 9, on the right), it can be found that the pattern are similar, but the number of sessions in the year 2019 is much higher than that in the year 2017.
An in-depth analysis suggests that the highest frequency of charging sessions is in the range about 20 minutes. Figure 9 only depicts the charging session shorter than 1441 minutes (24 hours), and the full data sets also shows that some charging session are longer than 24 hours. A few ones are longer than 4 days. These extremely long charging sessions only make up a small portion and represent rare scenarios; this is therefore regarded as outlier data. This outlier data is not further considered in this analysis report.
Figure 9: Histogram of connection time duration (both AC and DC) during the period of 01 January 2017 to 06 November 2017 (on the left hand side) and the period of 01 February 2019 to 31 January 2019 (on the right)
EV charging energy and connection time
EV charging events for a period of one year (01/02/2019 to 31/01/2020) are presented in Figure 10, which shows how much electricity was consumed for each charging event against the connection time. As can be seen, the charging events are scattered, with a dense area in the period of relatively short connection times. The dense area means there are more charging sessions falling in this (energy-time) region; for example, the area with charging duration less than the 200 minutes. The red colour represents the DC charging sessions and it can be seen that DC charging duration is much shorter and consumes more electricity than AC charging (blue colour). This reflects the definitional feature of a DC fast charger.
It is also interesting to observe that there is an area from about 800 minutes (about 13 hours) to 1,000 minutes (about 16 hours) and energy from 5 kWh to 20 kWh, where the charging session is dense. This may represent the residential users returning home after work in the evening (e.g. 6 p.m.) and departing for work in the following morning (e.g. at 7 a.m.).
It is worth noting that the parking time may differ from the charging time. As discussed earlier, the actual charging time is equal or less than the connection time. This explains the dense area of 800 minutes to 1,000 minutes, and 5 kWh to 20 kWh.
Figure 10: Overview of the charging demand vs. connection time duration over a period of one year
Charging events with a connection time up to 1000 minutes in the period 01/01/2017 to 06/11/2017 (310 days) are presented in Figure 11.
In Figure 12 (for the AC chargers) and Figure 13 (for the DC chargers), the relatively short-length charging part (up to 100 minute of charging) is enlarged/zoomed in. Clear linear patterns radiated out are shown in Figure 12, and each clustered lines represent the charging rates options, i.e. 3.7 kW, 7.4 kW, 11 kW, and 22 kW. The patterns were not as clear for the DC chargers, see Figure 13. It can be seen from Figure 13 that the highest charging power is about 40 kW (corresponding to the energy charged in 60 minutes), which is less than the nominal 50 kW DC charging power.
Figure 12: Zoomed in from Figure 11 for AC chargers Figure 13: Zoomed in from Figure 11 for DC chargers
Uneven utilization of charging stations
Recalling Figure 8 showing the number of charging sessions for each charger, AC and DC, the utilization of the two DC chargers outnumbered that for the AC chargers. A more in-depth analysis of the number of charging sessions shows that the number of charging sessions are not evenly distributed between the AC chargers. In addition, the histogram of the charging duration, for both AC and DC chargers, is illustrated in Figure 9, where the frequency of charging duration decreased exponentially over time and short time charging (within half an hour) was the shown as the prevailing charging behaviour.
Furthermore, each charging event was scattered in Figure 11 between its charging electricity demand and charging duration, the relatively short-duration charging part (up to 100 minutes of charging) which is enlarged and presented in Figure 12 (for the AC chargers) and Figure 13 (for the DC chargers). Clear linear patterns radiated out are shown in Figure 12, and each clustered lines represent the charging speed options, i.e. 3.7 kW, 7.4 kW, 11 kW, and 22 kW. The patterns were not as clear for the DC chargers. It can be seen from Figure 13 that the highest charging speed is about 40 kW, which is less than the nominal 50 kW DC charging rate. In addition, the utilization rate for each of the 52 EV charging stations are illustrated in Figure 14 in ascending order for the four respective seasons, where the utilization rate is calculated as the percentage of time that each EV charger is occupied for charging over the 6 weeks observation period for the individual seasons. It can be observed from this figure that certain charging stations have distinct usage patterns at certain time of day. For instance, P1012 – P1022 are mainly used in the midday and P1034 – P1043 are more occupied during the evenings. This may be due to reservation or the location of convenience for these chargers.
In addition, a clear increase in EV chargers’ utilization rate can also been observed in Figure 14 from winter in 2017 to autumn in 2018, which is summarised in Table 9 in terms of the seasonal averaged and maximum utilization rate. It can be seen that the peak of utilization at each season occurred at early evening when the EVs returned from work, though the averaged utilization showed a very low number. This provides an opportunity to promote EV usage by increasing charger utilization. However, it is worth noting that the charging time would likely to be shorter than the actual connection time, during which EVs might still be connected to the EV chargers without exchanging energy.
a) Winter b) Spring
c) Summer d) Autumn
Figure 14: Seasonal EV charger utilization rate illustration
Table 9: Seasonal EV charger utilization rate summary
Winter Spring Summer Autumn
Average utilization rate 5.68 % 6.92 % 8.42 % 14.14 %
Max utilization rate 54.76 % @ P1013, 17:00 76.19 % @P1040, 17:00 57.14 % @P1043, 16:30 80.95 % @P1014, 18:00 Another observation worth noting is that the EV users appear to be insensitive to charging cost, which is demonstrated by the insignificant change in the chargers’ utilization rate before and after the introduction of the AC daytime charging fee. In fact, the average utilization rate has increased from 14.75% to 18.35%, by observing roughly two weeks on each side of the timeline of fee introduction.
2.2.2. Dataset 2 – load profile
Dataset 2 recorded hourly consumption profiles, though it is not clear what this is actually comprised of (not labelled on the Excel file received, and no clarification was ever possible to be obtained from the operational pilot partners on the ground). Without further information, the aggregated monthly energy consumption and the average daily load profile per month are calculated and presented in Figure 15 and Figure 16 respectively. Figure 15 depicts a significant year-on-year growth in energy consumption in addition to the seasonal pattern, where winter (in particular December and January) has the highest consumption. This is also confirmed by comparing the average daily load profile for each month in Figure 16. Furthermore, the average monthly energy consumption is calculated for each year and can be found in Table 10.
Table 10: Averaged Monthly Electricity Consumption
Year Averaged Monthly Energy Consumption (kWh)
2017 16178
2018 34591
2019 59469
One interesting observation from Figure 16 is that the lowest power consumption at a day is between 5 a.m. – 7 a.m., rather than the between midnight to 4 a.m. This is possible due to the (residents’) EVs charging overnight, or because of an off-peak electricity tariff.
Figure 15: Aggregated monthly energy consumption of EV charging
Figure 16: average daily load profile per month
2.2.3. Dataset 3 – Ferroamp database
The Ferroamp database is a comprehensive online data acquisition system that recorded the power flow related to the BESS, namely power imported from the grid, to the load and that exchanged with the BESS. A simple schematic of the Ferroamp system is illustrated in Figure 17, where the boundary that the consumption profile covers is again not clear. Without further available information, a few observations of the database as it is are presented as follows.
A gap of data record in the Ferroamp system can be observed in Figure 18 and Figure 19 between 13/04/2018 and 07/06/2018, for the profile of both grid import and load consumption, which might be due to a system update. A closer look at the different variables in the database is shown in Figure 20, using the week commencing 02/12/2017 as an example, where the BESS was scheduled to support the peak demand and the recharging took place when the load level is relatively low. The energy exchange of the battery storage in this chosen week of analysis however summed to -89.6 kWh, rather than being roughly energy neutral.
Considering that the convention adopted here for BESS scheduling is positive for discharging and negative for charging, this net charging consumption might be due to the poor efficiency of the storage system in the cycling process. Note that the Ferroamp installation recorded BESS power transfer on a 1 minute resolution.
The Ferroamp database showed that energy consumption for EV charging only represents a small portion of the total load, which – we have been informed (in March 2020) by both Fortum Charge & Drive and Ferroamp – is connected to the EV charging infrastructure and not to other major parts of the electricity consumption of the building. Therefore, the conclusion one could draw in the end, if the very belated information from Fortum Charge & Drive and Ferroamp is indeed correct, is that Dataset 1 is in fact only partial and flawed. It is unclear