Chinese Cross-listing
A thesis submitted in fulfilment of the requirements for the degree
of Doctor of Philosophy (Economics and Finance)
Lixian LIU
School of Economics, Finance and Marketing
College of Business
RMIT University
February 2011
Declaration
I certify that except where due acknowledgement has been made, the work is that of the author alone; the work has not been submitted previously, in whole or in part, to qualify for any other academic award; the content of the thesis is the result of work which has been carried out since the official commencement date of the approved research program; any editorial work, paid or unpaid, carried out by a third party is acknowledged; and, ethics procedures and guidelines have been followed.
_______________________________________ LIU, Li Xian
Acknowledgements
The journey of this PhD thesis was fascinating, and the completed thesis would not have been possible without significant advice, stimulation and efforts from the people around me.
Foremost, I am indebted to my senior supervisor Professor Tony Naughton for his stimulation of the research ideas, for his kind forgiveness of my mistakes, for his patience in reading the drafts, and for his support to the research conferences. Discussion with other members of my supervisory panel has enriched this work. My special thanks go to Dr. Vikash Ramiah, for his generous advice, insightful comments, and guidance to the completion of this thesis. My deep appreciation also goes to Dr. Sivagowry (Gowrie) Sriananthakumar for serving on my supervisory panel, especially for her invaluable assistance and generous supports in solving technical issues during the data analysis stage. Discussion with other academics from RMIT University has enriched this work as well. My special thanks go to Professor Tim Fry, Professor Heather Mitchell, Dr. Alberto Posso, Dr. Silvia Zia Islam, for their time and constructive advice on model refinement, statistical matters on the data analyses for the research.
Financially, this research has been made possible with the Australia Postgraduate Award scholarship provided by the RMIT University. I also desire to express my heartfelt obligation to my husband, Professor, Dr. JIANG Fuming, for his continuous support to explore my potential by going on a journey of PhD study. He has also been my mentor in both my study and my life. Our seven-year-old lovely son, Jiang Huiyuan, also well known as Xinxin, has witnessed this journey. Xinxin has been one of the most inspirational members around me for accomplishing this journey.
Lastly, I would like to thank Dr. Lisa Lines for providing me with her professional editing services, to ensure the completeness and consistency of the thesis.
Abstract
Since the re-establishment of the stock market in China in 1990, cross-listing1 by Chinese companies has been growing constantly, and has become a complementary source of foreign capital inflows into the Chinese economy via international stock markets in addition to the inward foreign direct investment started in 1980. By the end of 2008, there were over 800 Chinese securities listed and traded in several major stock exchanges around the world, which have raised total capital amounting to over US$112 billion according to the China Securities Regulatory Commission (CSRC) Report (2008). The experience of Chinese companies’ cross-listing in the international stock exchanges has, to some extent, provided an example of company-initiated bonding practices among the various bonding mechanisms such as diversifying shareholder base, opting into higher financial disclosure, and improving corporate governance.
With the increasing presence of Chinese companies listed and traded in the international stock markets, research on Chinese cross-listing is emerging as a new focus for academic research in the field. A number of studies have investigated the price disparity and price discovery between dual-listed Chinese securities (focus on Hong Kong and New York dual-listings); yet little is known about how bonding effects Chinese firms cross-listed in international stock markets, the price and market linkage among those dual- and triple-listed shares, and whether investment strategies could be developed from the price disparity phenomenon between dual-listed shares.
Building upon the existing literature on cross-listing, and using the data of listed Chinese companies during the period of 1993–2008, this study examines the relevance of the theories of the bonding hypothesis, cointegration and the law of one price in the context of Chinese firms’ cross-listing in the international capital markets. The results suggest that Chinese cross-listings exhibit a bonding premium only in the United States (US) markets, while the non-cross-listed Chinese firms demonstrate better firm performance than those listed in London, Singapore and Hong Kong. Further, the results reveal that for all the listed Chinese firms, profitability rate and the leverage ratio play a
1 In this study, the terms cross-listing, overseas-listing, international-listing, dual-listing, and triple-listing are used interchangeably to eliminate any possible conflict of semantics. All these terms have the same meaning when a security is registered for trading on more than one exchange. Dual-listing or triple-listing means a Chinese security is listed and traded on two or more exchanges.
positive role in improving the firms’ performance. The adoptions of international accounting standards as a must-to-do corporate governance mechanism regulated by the host stock exchanges has less effects on Chinese firms’ performance, but the adoption of Big Four auditing firms does. And the interaction between cross-listing with different corporate governance mechanisms have different effects on firms’ valuation. The study suggests that merely borrowing a corporate governance mechanism does not guarantee the improvement of the firm performance.
Instead of using market indices, this study examines the short and long-term price linkages among the dual- and triple-listed Chinese securities in different stock markets over the period of 1993–2008. The empirical results reveal that most of the dual-listings traded in China A- and B-share markets, and the Hong Kong and New York stock markets exhibit a stationary long-run relationship. Some of the dual-listed China A- and H-share also exhibit cointegrated relationship. The results also suggest that Hong Kong and New York markets have a very strong interactive relationship in terms of the dual-listed stocks. The stock’s total return index series for those cross-dual-listed Chinese stocks are cointegrated and pricing errors are corrected almost immediately. Lastly, arbitrage opportunities for the 14 pairs of Chinese American Depository Receipts (ADRs) and their underlying shares traded in New York and Hong Kong markets were examined. It was revealed that a portfolio of 14 dual listed stocks earns an average daily return of 1.28 per cent over the period studied when transaction costs were considered and market risk was controlled.
This study contributes to the literature on the bonding hypothesis and firm valuation on cross-listing by constructing an integrated conceptual framework that explains why the bonding effect might not have explanatory power for all the cross-listed Chinese firms. As an exploratory study of corporate governance of Chinese cross-listings and investment strategy, this study also provides researchers with theoretical and methodological implications for future studies in this line of research. Further, it also proves that arbitrage opportunities existed for some of the dual-listed shares but risks are also associated with it.
Abbreviations
-2LL -2 times log-likelihood
ADF Augmented Dickey-Fuller
ADR American Depository Receipts
ANOVA Analysis of Variance
ASEAN Association of South East Asian Nations AIM Alternative Investment Market
CAPM Capital Asset Pricing Model
CAR Cumulative Abnormal Return
CEO Chief Executive Officer
CPA Certified Public Accountant
CSRC China Securities Regulatory Commission
G5 Group of Five. The G5 members are: France, Germany, Japan, the United Kingdom and the United States
GAAP Generally Accepted Accounting Principles
GDP Gross Domestic Production
GDR Global Depository Receipt
GEM Growth Enterprise Market
IAS International Accounting Standard IFRS International Financial Report Standard
IPO Initial Public Offerings
KOSDAQ Korea Securities Dealers Automated Quotation System
LOP The Law of One Price
NAFTA North American Free Trade Agreement
NASDAQ National Association of Securities Dealers Automated Quotations
OTC Over the Counter
QDII Qualified Domestic Institutional Investors QFII Qualified Foreign Institutional Investors
RI Return Index
RMB Chinese currency, Renminbi, with a notation of ¥
ROA Return on Asset
ROE Return on Equity
SFC Securities and Futures Commission SFRS Singapore Financial Reporting Standards
SL Security Line
SML Security Market Line
SOE State-Owned Enterprise
ST Special Treatment
UK United Kingdom
US United States
Contents
Declaration ... ii Acknowledgements ... iii Abstract ... iv Abbreviations ... vi Contents ... viiiList of Tables... xii
List of Figures ... xiv
Chapter 1: Introduction ... 1
1.1 Research Background ... 1
1.2 Research Objectives ... 3
1.3 Thesis Structure ... 5
1.4 Methodology ... 6
1.5 Contributions of the Research in the Thesis ... 6
Chapter 2: Chinese Cross-Listing ... 9
2.1 China Stock Market History ... 9
2.2 China Cross-Listing ... 10
2.2.1 China Cross-listing Background ... 10
2.2.2 History of China Cross-listing ... 11
2.2.3 Location of Chinese Cross-listing ... 14
2.2.4 Modes of Chinese Cross-listing ... 17
2.2.5 Chinese Share Classes ... 19
2.2.6 Chinese ADRs ... 22
2.2.7 China Cross-listing and Market Cooperation ... 23
2.3 Conclusion... 25
Chapter 3: Review of Cross-listing ... 26
3.1 Introduction ... 26
3.2 Corporate Governance and Legal Bonding ... 27
3.2.1 Hypothesis Development ... 32
3.3 Multiple Listing and Informed Trading ... 34
3.3.1 Dual-listing and Market Co-movement ... 34
3.3.2 Dual-listing and Market Cointegration ... 35
3.3.3 Information Transmission ... 38
3.3.4 Price Discovery ... 39
3.3.5 Hypothesis Development ... 43
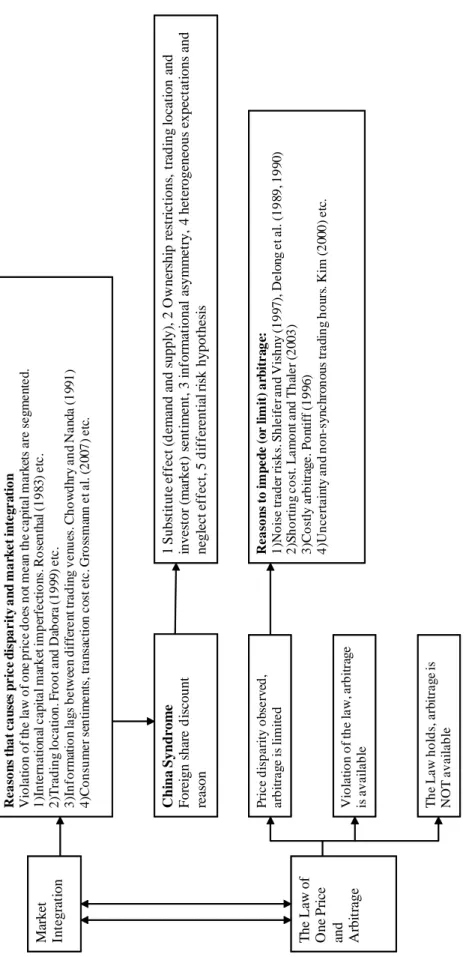
3.4 Price Disparity and Arbitrage ... 45
3.4.1 Theoretic Foundation ... 45
3.4.2 Empirical Studies on Arbitrage ... 46
3.4.3 Reasons Deterring or Limiting Arbitrage ... 51
3.4.4 Cause of Price Disparity ... 54
3.4.5 China Syndrome ... 55
3.4.6 Hypothesis Development ... 61
Chapter 4: Cross-listing, Firm Valuation and Corporate Governance ... 63
4.1 Introduction ... 63
4.2 Measurement of Firm Value or Firm Performance ... 64
4.2.1 Firm Value or Firm Performance ... 64
4.2.2 Corporate Governance Mechanisms ... 65
4.3 Data and Methods ... 74
4.3.1 Data Description and Data Structure ... 74
4.3.2 Methodology and Model Specification ... 75
4.4 Empirical Results ... 78
4.4.1 Summary Descriptive Statistics ... 78
4.4.2 Correlation Coefficient of Variables ... 82
4.4.3 Cross-listing Premium Empirical Results ... 82
4.4.4 Corporate Governance and Firm Valuation Regression Results ... 84
4.4.5 Interaction of Cross-listing, Corporate Governance and Firm Valuation Regression Results ... 88
4.4.6 Robustness Test ... 91
4.5 Conclusion... 91
Chapter 5: Market and Price Linkage for Dual-listing... 95
5.1 Introduction ... 95
5.2 Data Collection ... 96
5.2.1 Chinese Dual and Triple Listing Introduction ... 96
5.2.2 Data Collection ... 97
5.3 Methodology ... 98
5.3.1 Preliminary Return Analysis ... 98
5.3.2 Market Co-movement ... 100
5.3.3 Dual and Triple-listing and Cointegration ... 103
5.3.3.1 Unit Root Test ... 104
5.3.3.2 Cointegration Analysis ... 105
5.3.4 Granger Causality Test ... 108
5.3.5 Error Correction Model ... 109
5.4 Empirical Results ... 113
5.4.1 Preliminary Return Analysis Results ... 113
5.4.1.1 Descriptive Statistics ... 113
5.4.1.2 Testing Equality of Mean Returns and Variances... 115
5.4.1.3 Post hoc Tukey’s Test ... 117
5.4.2 Market Co-movement ... 119
5.4.3 Cointegration ... 120
5.4.3.1 Unit Root Results ... 120
5.4.3.2 Engle-Granger Cointegration Test Results ... 121
5.4.3.3 Johansen Cointegration Test Results ... 124
5.4.4 Granger Causality Test ... 125
5.4.5 Error Correction Model ... 126
5.5 Conclusion... 133
Chapter 6: Cross-listing and Arbitrage ... 134
6.1 Introduction ... 134
6.2 Chinese ADRs ... 135
6.2.1 Time Difference among Different Markets ... 135
6.2.2 ADR Settlement ... 136
6.2.3 Chinese ADRs and Arbitrage ... 139
6.3.1 Data and Methods ... 140
6.3.2 Methodology Used to Back Test for the Price Disparity Trading Strategy . 142 6.4 Empirical Results ... 146
6.5 Conclusion... 150
Chapter 7: Micro-analysis of the Bank of China ... 151
7.1 Overview ... 151
7.2 Analysis ... 151
7.2.1 Bank of China Background ... 151
7.2.2 Corporate Governance of Bank of China ... 152
7.2.3 Company Valuation ... 152
7.2.4 Return Analysis of the Bank of China ... 153
7.2.5 Price Difference of the Bank of China ... 155
7.2.6 Market Co-movement and Cointegration Analysis ... 156
7.3 Conclusion... 156
Chapter 8: Conclusion, Limitations and Future Research ... 158
8.1 Conclusion... 158
8.1.1 Conclusion of the First Empirical Study ... 158
8.1.2 Conclusion of the Second Empirical Study ... 160
8.1.3 Conclusion of the Third Empirical Study ... 161
8.2 Contributions of This Research ... 162
8.3 Limitations of This Research ... 163
8.4 Future Research ... 163
References ... 165
List of Related Publications ... 193
Appendix 1: Chinese Cross-listing Information ... 194
Appendix 1.1: Chinese Firms Listed on New York Stock Exchange ... 194
Appendix 1.2: Chinese Firms Listed on NASDAQ ... 195
Appendix 1.3: Chinese Firms Listed on Over-the-Counter Market ... 196
Appendix 1.4: Chinese Firms Listed on American Stock Exchange and Other ... 197
Appendix 1.5: Chinese Firms Listed on Hong Kong Mainboard ... 198
Appendix 1.5: Chinese Firms Listed on Hong Kong Mainboard ... 199
Appendix 1.6: Chinese Firms Listed on Hong Kong GEM ... 200
Appendix 1.7: Chinese Firms Listed on Stock Exchange of Singapore ... 201
Appendix 1.8: Chinese Firms Listed on London Stock Exchange (AIM) ... 203
Appendix 2: Chinese Dual and Triple Cross-listing Information ... 204
Appendix 2.1: Chinese Firms Dual-Listed on China A and B Market ... 204
Appendix 2.2: Chinese Firms Dual-Listed on China A and Hong Kong Market ... 205
Appendix 2.3: Chinese Firms Triple-Listed on China A, Hong Kong, and USA Market ... 206
Appendix 3: Distribution of Realised Return ... 207
Appendix 3.1: Descriptive Statistics on Returns of Dual-Listing Chinese Firms Traded on China A and B Markets for the Period 01/01/1993 to 31/12/2008 ... 208
Appendix 3.2: Descriptive Statistics on Returns of Dual-Listing Chinese Firms Traded on China A, Hong Kong and New York Markets for the Period 01/01/1993 to 31/12/2008... 211
Appendix 3.3: Descriptive Statistics on Returns of Dual-Listing Chinese Firms Traded on China A and Hong Kong Markets for the Period 01/01/1993 to 31/12/2008 ... 212 Appendix 4: Mean and Variance of Return Distribution ... 213 Appendix 4.1: Paired T-Test, Variance Results for Chinese Dual-Listed Firms on China A and Hong Kong Markets ... 213 Appendix 4.2: Paired T-Test, Variance Results for Chinese Dual-Listed Firms on China A and China B Markets ... 214 Appendix 4.3: Paired T-Test, Variance Results for Chinese Triple-Listed Firms on China A, Hong Kong and New York Markets ... 216 Appendix 5: Market Co-movement Test Results ... 217 Appendix 5.1: Regression output for Chinese shares dual-Listed on China A and China B (Shenzhen) markets ... 217 Appendix 5.2: Regression output for Chinese shares dual-Listed on China A and China B (Shanghai) Markets ... 218 Appendix 5.3: Regression output for Chinese shares dual-Listed on China A and Hong Kong markets ... 219 Appendix 5.4: Regression output for Chinese shares dual or triple-listed on China A, Hong Kong and New York markets ... 220 Appendix 6: Unit Root Test Results ... 221 Appendix 6.1: Unit Root Test Results for Chinese Firms Dual-Listed on China A- and B-Share Markets during the Period 1st January 1993 to 31st December 2008 ... 221 Appendix 6.2: Unit Root Test Results for Chinese Firms Dual-Listed on China A Share Market and Hong Kong Market during the Period 1st January 1993 to 31st December 2008 ... 224 Appendix 6.3: Unit Root Test Results for Chinese Firms Dual or Triple-Listed on China A, Hong Kong, and New York Markets during the Period 1st January 1993 to 31st December 2008 ... 226 Appendix 7: Granger-causality Test Results... 227 Appendix 7.1: Granger causality test Results for Chinese Firms Dual-Listed on China A- and B-Share Markets ... 228 Appendix 7.2: Granger causality test Results for Chinese Firms Dual-Listed on China A-Share and Hong Kong Markets ... 229 Appendix 7.3: Granger causality test Results for Chinese Firms Dual-Listed on China A- Share, Hong Kong and New York Markets ... 230 Appendix 8: Price Premium for Dual-listings ... 231
List of Tables
Table 2.1: Chinese Overseas Listings Cross Markets by Year 1992-2008 ... 16
Table 2.2: Listed Chinese Companies Share Types ... 19
Table 3.1: Arbitrage Unavailable Among Cross-listing or ADRs ... 50
Table 3.2: Arbitrage is Limited Among Cross-listing or ADRs ... 51
Table 3.3: Arbitrage Available among Cross-listing or ADRs ... 52
Table 3.4: China Syndrome: Price Disparity ... 60
Table 4.1: Summary Descriptive Statistics for Variables ... 79
Table 4.2: Correlation Coefficient of Variables ... 81
Table 4.3: Comparison of Valuations of Chinese Firms That Do Not Cross-list and Cross-list by Markets from 2003 to 2008 ... 83
Table 4.4: Fixed Effect Panel Data Analysis Results ... 86
Table 4.5: Interaction Results for Cross-listing, Corporate Governance and Firm Valuation ... 90
Table 4.6: Robustness Test ... 92
Table 5.1: Summary Descriptive Statistics for Chinese Dual-listings in Different Markets and Market Indices ... 114
Table 5.2: Comparison of Daily Stock Returns for Chinese Stocks Dual and Triple-listed in China A, B-share Market, HK and New York Market ... 116
Table 5.3: Tukey’s Test Results for Triple-Listed Chinese Shares ... 118
Table 5.4: Market Co-movement Regression Results ... 120
Table 5.5: Engle-Granger Cointegration Test Results for Chinese Firms Dual-Listed on China A-Share and B-Share Markets from 1993 to 2008 ... 121
Table 5.6: Engle-Granger Cointegration Test Results for Chinese Firms Dual-Listed on China A-Share and Hong Kong Markets from 1993 to 2008 ... 122
Table 5.7: Engle-Granger Cointegration Test Results for Chinese Firms Dual-listed on China A-Share, Hong Kong and New York Markets From 1993 to 2008 ... 123
Table 5.8: Johansen Cointegration Test Results for Chinese Firms Cross-listed on China A, Hong Kong, and New York Markets ... 124
Table 5.9: Price Linkage between Dual-Listed Chinese Stocks Traded on China A- and B-share Markets (with Error Correction Model Equation 5.32 when China B returns as Dependent Variable) ... 127
(continued) ... 128
Table 5.10: Price Linkage between Dual-Listed Chinese Stocks Traded on China A- and B-share Markets (with Error Correction Model Equation 5.33 when China A Returns as Dependent Variable) ... 129
Table 5.11: Price Linkage between Dual-Listed Chinese Stocks Traded on China A and Hong Kong Markets (with Error Correction Model Equation 5.34 when Hong Kong
Returns as Dependent Variable)... 131
Table 5.12: Price Linkage between Dual-Listed Chinese Stocks Traded on China A and Hong Kong Markets (with Error Correction Model Equation 5.35 when China A Returns as Dependent Variable)... 131
Table 5.13: Price Linkage between Dual-Listed Chinese Stocks Traded on Hong Kong and New York Markets (with Error Correction Model Equation 5.36 when New York Returns as Dependent Variable)... 132
Table 5.14: Price Linkage between Dual-Listed Chinese Stocks Traded on Hong Kong and New York Markets (with Error Correction Model Equation 5.37 when Hong Kong Returns as Dependent Variable)... 132
Table 6.1: Descriptive Statistics of Daily Price Disparity Returns for 14 Dual-listings in Hong Kong and New York ... 141
Table 6.2: Computation of Transaction Costs ... 144
Table 6.3: The Actual Price Disparity Returns ... 147
Table 6.4: The Price Disparity Returns when Transaction Costs Considered ... 147
Table 6.5: The Price Disparity Returns when Profit is Greater than Transaction Cost 148 Table 6.6: Robustness Test for the Price Disparity Strategy ... 149
Table 7.1: Tobin’s q Comparison... 153
Table 7.2: Descriptive Statistics on Returns of the Bank of China A and Hong Kong Markets for the Period 01/06/2006 to 31/12/2008 ... 154
Table 7.3: Paired Comparison of Daily Stock Returns for the Bank of China Dual-listed in China A and Hong Kong Markets ... 155
Table 7.4: Descriptive Statistics of Daily Price Disparity Returns for the Bank of China during the Period 01/06/2006 to 31/12/2008 ... 156
List of Figures
Figure 3.1: Theoretical Foundation ... 47
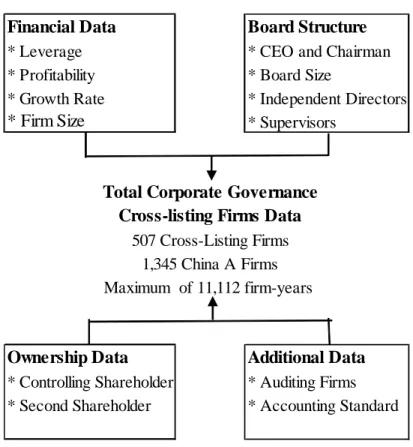
Figure 4.1: Data Structure ... 75
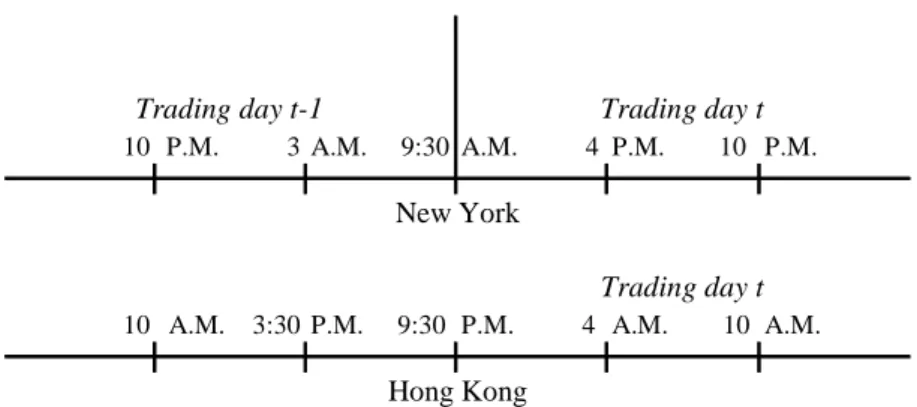
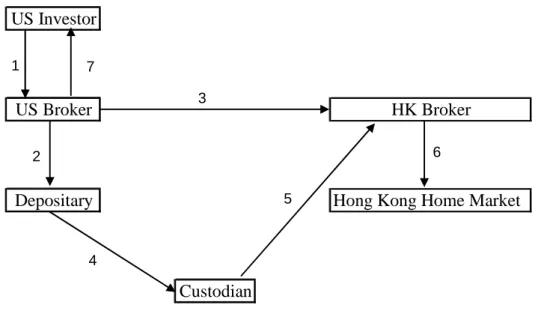
Figure 6.1: Relative Timing of Trading Days on China (HK included) Stock Exchanges and New York Stock Exchange ... 135
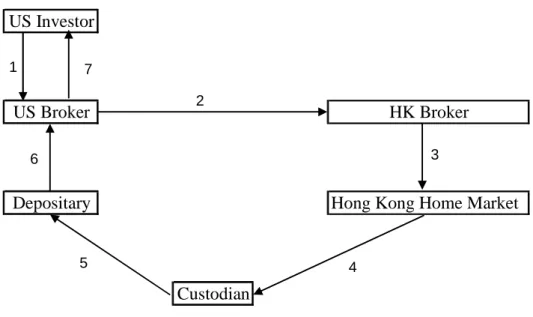
Figure 6.2: A US Investor Creates an ADR Process ... 137
Figure 6.3: A US Investor Cancels an ADR Process ... 138
Chapter 1: Introduction
1.1 Research Background
China, the most populous country and one of the four oldest civilisations in the world with a written history of more than 4,000 years, finally opened its doors to the outside world in 1979. The country has since undergone tremendous changes. In addition to the profound political and social transformations, the economic regime in China has been gradually converting from a centrally planned to a market-based economic system. One of the important and significant aspects of these economic transformations and reforms is the re-establishment of the stock markets in Shenzhen and Shanghai of China in the early 1990s. This has been followed by an established and gradually improved legal framework for governing the activities of the stock markets and financial markets. Lucrative opportunities unleashed by these developments together with the continuous rapid growth of the Chinese economy have attracted considerable attention from academic researchers, industry practitioners and policy makers to China’s stock markets.1
Among all the transition economies around the world, China has followed a rather unique method to transform its Soviet-style centrally planned economy to a more market-oriented economy but still within the almost unchanged political system. This system has been termed ‘Socialism with Chinese Characteristics’ and can be viewed as one type of mixed economic system. Therefore, economic transformation has been taking place without political democratisation and without large-scale privatisation. Liberalisation has proceeded incrementally and privatisation was delayed until two decades after the initiation of the reforms, and yet to date, the country has achieved a high and stable economic growth rate. Over the past decades, China’s economy has enjoyed average annual growth rates in excess of 9 per cent. The economy was recorded at an annual growth rate of 7.5 per cent during the period of the 11th Five-Year Plan (2006–2010). The ‘once-in-a-century’ global financial meltdown that occurred in the latter half of 2008 seemly hit China’s economy hard, especially in the export sector,
1 A reference to China refers to Mainland China in this study, which does not cover the securities markets in Hong Kong Special Administrative Region (SAR), Macau SAR and Taiwan Province of China.
which was badly affected with a significant slide in economic growth and a fall in earnings of listed companies. However, given the small size of overseas investments by China’s enterprises and securities institutions, this global financial meltdown had a rather limited direct impact on China’s securities markets (CSRC 2008).
Since its formation in 1990, the Chinese stock market has enjoyed rapid growth with the incremental development of China’s market economy. By the end of 2008, China’s stock market was the second largest in Asia after Japan,2 with a total of 1,625 publicly listed companies and a market capitalisation of 12.13 trillion Renminbi (RMB),3 which accounted for about 40 per cent of China’s Gross Domestic Production (GDP) (CSRC 2008). The Shanghai Stock Exchange was ranked the sixth biggest stock exchange in the world by market capitalisation in 2008 (World Exchanges 2008), and all of this remarkable performance has been achieved under relatively poor legal and financial systems. China’s stock market has been performing better than the markets of most other transitional economies as measured by the number of listed firms, market capitalisation, liquidity and fundraising capacity (Pistor & Xu 2005).
Besides the constant economic growth in China and the continuous reforms of the Chinese stock market, the more integrated international financial markets make it possible and easier for Chinese companies to list internationally. As the Chinese A-share market swings between an ultra-wide band, Chinese companies suddenly find themselves swamped with many choices as the overseas exchanges ease their rules to cosy up to the new Chinese listing candidates. Both state-owned enterprises (SOEs) and private Chinese companies actively seek to list internationally. The Hong Kong Stock Exchange and the New York Stock Exchange are not the only contenders for Chinese listings as they were at the early stage of the development of the Chinese stock market. Singapore, National Association of Securities Dealers Automated Quotations (NASDAQ) and the London Alternative Investment Market (AIM) have become the most popular destinations for Mainland Chinese companies. However, when it comes to
2 On 16 July 2009, China overtook Japan as the world’s second-largest stock market by value after the Chinese government stimulus spending and record bank lending boosted share prices in 2009, sending the value of China’s domestic stock market to $3.2 trillion, compared with Japan’s $3.20 trillion. The last surpassed Japan in stock market capitalisation was from 7 January to 24 January 2008 (Bloomberg News 2009).
3 At the end of 2008, total free-float capitalisation of these 1625 companies listed on the two stock exchanges in Shanghai and Shenzhen was RMB 4.52 trillion, representing a decrease of 51 per cent from the end of 2007. The total market capitalisations in 2008 represent a 63 per cent decrease from the end of 2007.
attracting large SOEs to launch offshore initial public offerings (IPOs), the Hong Kong stock market becomes the best performer. In 2006, the Hong Kong market saw giant IPOs launched by Bank of China and the Industrial and Commercial Bank of China, while Singapore exchange is traditionally stronger in attracting manufacturers. By the end of 2008, over 800 overseas incorporated companies from Mainland China were listed on the different exchanges in either IPO or American Depository Receipt (ADR) forms. These include 456 on the Hong Kong Stock Exchange (H-shares and red-chips), 44 on the New York Stock Exchange, 76 on NASDAQ, 64 on the London Stock Exchange, and 150 on the Singapore Exchange, raising a total of US$112.157 billion. Meanwhile, 57 H-share companies had issued A-shares in the Chinese Mainland stock market (CSRC 2008).
1.2 Research Objectives
Given the fast development of Chinese cross-listing in the international stock markets as summarised in the previous section, Chinese cross-listing has been of particular interest to researchers. In spite of rich literature on cross-listing, conventional theories presented in previous studies may not adequately explain the phenomenon and behaviour of Chinese companies’ cross-listing in the international stock markets that is being examined in this study.
First, most previous research on international cross-listing has focused on well-developed financial markets such as that of Canada, Japan, the United Kingdom (UK) and the United States (US). Most notably, the focus of the studies was on either US stocks cross-listed on an overseas exchange or foreign firms trading on US exchanges as ADRs (Karolyi 2006). As an emerging market, the study of Chinese cross-listing could enrich the literature of the global cross-listing phenomenon with a more complete dataset.
Secondly, the policies adopted in the well-developed stock markets and Chinese stock markets differ significantly. For example, the policies adopted in the stock markets of Hong Kong, the US and Singapore are free market-oriented. Hong Kong residents can hold Chinese B-shares and other foreign equities, but Chinese residents in Mainland China are not allowed to trade Hong Kong shares and other foreign shares, although hundreds of Chinese companies are listed in Hong Kong markets and other overseas
markets (Su 1999). This suggests that overseas listing is likely to have little impact on the domestic Chinese market because of such strict policy on capital flow (Forbes 2005). Meanwhile, short selling is not allowed in the Mainland Chinese market, while in the Hong Kong, Singapore, London and US markets, investors who are trading Chinese cross-listed securities should have the potential of being integrated in terms of the open and free trading environment with virtually complete access for foreign investors, and no regulatory constraints prevent cross-border arbitrage in cross-listed securities, and the markets are in fact actively arbitraged by institutional investors.
Regarding corporate governance issues, despite the challenges of an under-developed legal system, corporate governance standards for Chinese firms are often seen as either lacking or deficient in their operation (Liebman & Milhaupt 2008). Moreover, the overseas-listed Chinese firms are operating under Mainland China laws but with shares listed on the other stock exchange for example, London Stock Exchange, they must operate within and according to the rules of two significantly different systems. All these issues suggest that these cross-listed Chinese firms in international stock markets inevitably reflect the political, economic and social preoccupations of Mainland China, yet must simultaneously recognise and comply with the demands made by the host countries’ legal system and securities markets.
Lastly, this research is the first study that explicitly examines Chinese cross-listings traded in several major stock exchanges. The examination of relationship between corporate governance and firm performance of Chinese listed firms through the angle of cross-listing has not been reported in the literature, and neither has the arbitrage strategy between the dual-listed Chinese firms. These represent important theoretical gaps that this thesis aims to fill.
Therefore, the research in this thesis has three objectives, as stated below:
1) To investigate the relationship of bonding hypothesis, corporate governance and firm performance of Chinese cross-listings. One of the issues of bonding hypothesis is that foreign firms incorporated in a jurisdiction with weak investor protection rights cross-list on US stock exchanges to legally bond themselves to higher disclosure standards and stricter enforcement, hence enhance the equity valuation (Coffee 1999, 2002). Liu and Kang (2007) surveyed 84 cross-listed Chinese firms, and they suggested that raising capital is the first important factor
for Chinese firms selecting the exchange, good governance ranked the fourth important factor to select an exchange. Protecting minority shareholder’s interest as a bonding effect shows less importance. Therefore, in this study, the relationship between Chinese cross-listings and corporate governance under the bonding hypothesis will be examined.
2) To examine the interdependence relationship among different classes of shares of China that traded in different markets mainly in Hong Kong, the US, and the local A- and B-share markets in China. Prior studies that examined the interactions between China-related stocks mostly conducted on stock indices of each class of shares in Shanghai, Shenzhen and Hong Kong. However, the study of the relationship between China-related stocks by investigating the behaviour of individual stock prices and returns of classes of shares issued by the same company is meaningful and interesting.
3) To explore the cross-border arbitrage opportunities. Although short selling is restricted in Chinese markets, considering the market conditions of Hong Kong and the US, arbitrage opportunities could be found for the Chinese firms that are dual-listed on these two markets.
1.3 Thesis Structure
This thesis is organised into eight chapters. Chapter 1 describes the research background, the objective of the research, the thesis structure, and the contributions of the research. Chapter 2 introduces and examines the overall Chinese cross-listing phenomenon. Chapter 3 reviews the existing literature on cross-listing. The associated effects associated with cross-listing are reviewed with details.
The Chapters 4 to 6 report empirical test and findings. More specifically, Chapter 4 examines the relationship among the corporate governance, bonding hypothesis and firm performance; Chapter 5 examines the price relationship between the Chinese dual and triple cross-listings, cross-listings return behaviour, and market co-movement; and Chapter 6 explores the arbitrage opportunities for the Chinese dual-listed securities. For each of the issues under investigation, a conceptual framework is developed depicturing the hypothesised relationships between dependent and independent variables, which are then tested against empirical data investigate using various statistical techniques and procedures. Chapter 7 presents a small case study of one of Chinese cross-listing
companies from a multi-dimensional perspective. Chapter 8 concludes the study, lists the limitations of this research and suggests some of the future potential research.
1.4 Methodology
This study adopts different methodologies to examine the Chinese cross-listing issue, which includes three major quantitative empirical studies. Therefore a mixed method is suitable for this study because the study is of an exploratory nature in terms of the investigation of Chinese cross-listing phenomenon from different aspects. By adopting panel data analysis, the study provides an empirical test to the framework and hypotheses derived from bonding theory. The time series quantitative data collection and data analysis process for Chinese dual and triple-listings provides a detailed study of return and market linkage for Chinese cross-listing, which includes unit root test, cointegration analysis, Granger causality test and error correction models. Multivariate regression is also adopted to examine the market co-movement for Chinese dual-listed securities. Lastly, a simple daily arbitrage strategy is used to examine the statistic arbitrage opportunities for the dual-listed Chinese shares that traded both in the Hong Kong and New York markets. The results of these analyses are reported in the following chapters.
1.5 Contributions of the Research in the Thesis
This research builds on the existing literature on global cross-listing and makes the following original contributions to the body of knowledge in the area of cross-listing.
First, a great majority of the Chinese listed securities in two domestic stock markets and Hong Kong stock markets are converted from large SOEs. The government had a majority control of these listed firms, and the majority shares of these listed firms were not open for trade until 2006. Prior studies on the corporate governance and other related issues of Chinese listed firms were largely limited to this category (SOEs). The present study examines international cross-listed Chinese firms and extends the research from SOEs to the private Chinese firms and other small-medium-sized Chinese firms, which allows an understanding of whether encouraging Chinese firms to list overseas would help the Chinese government develop a robust, well-regulated securities market in China. The empirical study of the corporate governance and Chinese cross-listing
provides an implacable example for policy makers, market participants and corporate executives.
Secondly, previous theories, including agency theory (Jensen & Meckling 1976), property rights theory (Alchian & Demsetz 1972), the theory of incomplete contracts (Williamson 1975, 1985), and transaction costs (Williamson 1975, 1985) make different contributions on the corporate governance and the firm value within the country level. In the case of China, previous empirical work regarding the corporate governance issue has been focused on the effects of ownership structure on firm performance although with mixed results. This study applies bonding theory as the framework, examining the corporate governance issue through a different angle, which is beyond the border and in an international perspective.
Thirdly, most prior studies on Chinese overseas listing have focused on the A-share and H-share (Chinese securities listed on Hong Kong markets) markets. This study examines the Chinese securities cross-listed in multiple international locations. Besides Hong Kong and the US, Singapore and London are also included. Notably, there has been limited research reported on triple cross-listings between developed and emerging markets, and most of the prior studies have been conducted based on the pair-wise analysis for cross-listings and the adoption of indices to represent the individual share behaviour. It is expected that this research will bridge the gap by providing insights into the relationship among Chinese cross-listings under different market environment conditions and extend the existing literature on international financial markets and cross-listing. It is also necessary to further investigate the arbitrage strategy for Chinese ADRs and underlying securities in multiple markets. Moreover, this study provides a database and the framework that will permit further research and analysis into more specific issues on Chinese cross-listings.
Lastly, the findings in this study reveal some important practical implications for directors and managers of Chinese enterprises who have their securities listed overseas or who are interested in cross-listing in the future, and for policy makers considering further reform and the development of the Chinese stock markets. Copying the corporate governance mechanisms from developed countries or passively adopting the requirements of the host market is not an ideal approach. For example, this study shows that the independent director practice does not work effectively for firms listed in China. The expanded board size of Chinese firms listed in Hong Kong stock markets appears to
create an overlapped effect. The management of firms should be aware of the inefficiency caused by passively adopting the corporate governance practice required by the host stock exchange. Another important implication is the portfolio of international diversification of securities when acquiring the securities from the emerging market like China; if the securities traded on these markets are not cointegrated, international diversification among these assets is effective. Lastly, the Chinese policy-makers are currently discussing the application of a so-called ‘arbitrage mechanism’ to eliminate the price spread for the dual-listed Chinese securities (Chang & Ren 2009). However, no such mechanism can effectively ‘arbitrage away’ the price difference between the dual- and triple-listed securities. This study will help Chinese market participants to better understand market segmentation, and the limits and risks of arbitrage strategy.
Chapter 2: Chinese Cross-Listing
2.1 China Stock Market History
For more than 30 years, since the foundation of the People’s Republic of China in 1949, China had gone through the centrally planned economy, in which all enterprises were state owned or collectively owned and all investments were centrally planned and funded by government, as well as by loans from the state-owned mono-bank system (Wong, 2006). In December 1978, under the leadership of Deng Xiao Ping, the Chinese government launched the Open Door Policy calling for economic reform1. China has since begun the process of transforming its economic system from centrally planned to a more marked oriented economic system, while retaining the overall control of the Chinese Communist Party in the country. The economic reform and open-door policy gradually lead to the re-establishment of the stock markets in China in 1990 (Field, 1984).
The stock market history in China can be traced back to nineteenth century when the first and original securities market was established in Shanghai. Following the First Opium War, the Treaty of Nanking in 1842 established an area in Shanghai known as the International Settlement. This development prompted the emergence of foreign markets in the area, and culminated in the introduction of securities trading in the late 1860s. In June 1866, the first share list began to appear, prompting a number of banks to form a legal framework for joint-stock companies. This was coupled by an interest in diversification for investors and trading houses (although the trading houses themselves remained partnerships). 1880s saw the Chinese mining industry booming. In 1891, the Shanghai Sharebrokers’ Association was established, creating China’s first stock exchange. Most of the shares were supplied by local companies, and banks took the opportunity to dominate the majority of the private shares. By the turn of the century, Hong Kong and Shanghai banks had consolidated the majority of the trading shares from foreign bases. In 1904, the Association moved to establish another exchange in Hong Kong, expanding the grip of the Chinese market in the world economy. In 1920, in response to the development of a modern financial market in Shanghai, the Shanghai
1
The economic reform was announced at the Third Plenum of the Eleventh Central Committee in December 1978.
Stock and Commodities Exchange was formally established (Ji, 2002). This was followed the next year by the Shanghai Chinese Merchant Exchange. In 1929 the markets combined and officially formed the Shanghai Stock Market. Rubber became one of the prime stocks at the same time as a number of foreign companies, such as those from Japan, began to consolidate their economic control of the Chinese Stock Market. In 1941, the Japanese military took control of Shanghai and the stock market ceased operation (Ji, 2002). After the Chinese Communists Party took over the power in China in 1949, all of the markets, including native banks and private model banks, were officially closed, as the Communist Party saw this as one of the symbols of capitalism, which did not fit for China’s new economic development path (centrally planned economy) (Ji, 2002).
Following the introduction of economic reforms in December 1978, some local Chinese government started experimenting with selling shares of SOEs directly to domestic individuals in order to raise equity capital as part of enterprise reforms in the late 1980s (Wong, 2006). Curbed trading and a black market were formed followed by the establishment of Over the Counter (OTC) trading systems in a way of more organized but less formal exchanges. In 1990, the Shanghai and Shenzhen exchanges were opened with formal approvals of the central Chinese government. Since then, the Chinese government has introduced a series of policies in an attempt to develop its underdeveloped stock markets (Swanson and Lin, 2008).
2.2 China Cross-Listing
2.2.1 China Cross-listing Background
The creation of China stock markets follows a political rather than an economic logic. The decision makers shape the stock markets in a politically-motivated way rather than a market-oriented way (Cooper, 2002). Under this situation, the excessive government control could be seen everywhere, especially in these China stock markets. For example, to prevent cash-starved and poor quality SOEs flooding into the stock market, the Chinese government adopt the IPOs quota system under the supervision of the State Planning Committee, the Central Bank, and CSRC, who would determine the quantity of equity to be issued each year; the quota was then distributed among the various provinces and eligible central government departments (e.g. Ministries) (Chen et al., 2001).
However, this quota system prevents many large companies and the companies with high growth potential from getting listed. After the open-door policy in 1979 of China2, more and more small and medium sized Chinese private enterprises emerged. But, comparing with the SOEs, those small and medium sized Chinese private enterprises lacked needed funding, which to some extent prevents them from achieving fast growth. China’s commercial banking system has not evolved sufficiently to serve these groups of companies’ need for funding. Historically, the big four state-owned commercial banks favour lending to SOEs rather than private enterprises. Therefore, these private Chinese firms have to finance their own growth with their own reserved funds. The re-establishment of the stock market in China has seemingly provided an alternative source of finance to this group of firms, yet they have to queue for many years in order to get listed on one of China’s two domestic stock exchanges. To a large extent, the Chinese stock exchanges are almost out of reach to small and medium sized private firms, although they are liquid and large in size. This is even so for some of the already restructured Chinese SOEs. By March 1998, there was only one non-state owned company - Sichuan New Hope Agriculture Stock Co., Ltd. gained the permission to list from the Chinese government and became the first listed private enterprise. Under this circumstance, the CSRC found that overseas-listing could be another channel to solve the problem. Therefore, in March 2000, the CSRC gave up the IPOs quota allocation system (Wong, 2006)
2.2.2 History of China Cross-listing
2.2.2.1 Back-Door Listing
The first wave of Mainland Chinese firms listed abroad occurred in Hong Kong in the 1980s. During that time, the central Chinese government ministries and provincial/municipal governments were eager to establish a financial base in Hong Kong before the Chinese stock markets officially re-established (De Jonge, 2008). As we have noted, and the Open Door Policy has brought about China’s integration into the global economy, especially a higher level of integration between the Mainland China and Hong Kong economies3. In 1980s, the provincial and municipal governments were
2 The economic reform was announced in December 1978, but the indication of the open-door policy was in 1979 after the first joint venture law introduced in April 1979.
3 Six years after Deng Xiao Ping led Chinese government announced the open door policy in 1978, Margaret Thatcher signed the bilateral treaty by which Britain agreed to return the Hong Kong territory to Chinese control. Ever since then, Hong Kong has developed an ever-closer partnership with Mainland China. And the handover on 1 July 1997 makes the linkages between these two economies become indissoluble.
the main players in relation to listing in the Hong Kong Stock Exchange. Before the Chinese firms could be officially allowed to list directly on the Hong Kong Stock Exchange, they must have been already having significant back-door listing cases. This back-door listing involves a Hong Kong company being taken over by a Mainland China holding company that is controlled by a central government ministry or provincial/municipal government. Generally, this takeover target is a Hong Kong shelf company or a company that is in financial distress. After the takeover, the Mainland China company injects capital into this Hong Kong ‘shell’ company, and the Hong Kong ‘shell’ company is then used as a listing vehicle by the Mainland China parent (Su, 2003). These Mainland–controlled and Hong Kong-incorporated companies are now known as ‘red-chips’. For example, China Travel was founded in 1927 and now operates under the State Council. The company listed its own subsidiary in Hong Kong in 1992 under the name China Travel International Investment Hong Kong Ltd. This Hong Kong subsidiary, China Travel Service (Holdings) HK Ltd was founded in 1985.
The Tiananmen Square incident in June 1989 cooled down the international enthusiasm for red-chips. But Deng Xiao Ping’s Southern Tour in 1992 led to a China-related stocks revival. Between 1992 and 1993, the Chinese central government dominated the back-door listings with more than 15 red-chip investment vehicles created. Also, historically, in 1992 the central government’s exertion of power and influence under Deng Xiao Ping’s leadership was at a high point. Therefore, the year of 1992 becomes a year which the Mainland authorities took measures to assert control over the red-chip listings by establishing a centralized approval mechanism for all Hong Kong listings by Chinese subsidiaries. The year of 1992 also witnessed official communications being established between the Hong Kong Stock Exchange and the Mainland Regulatory authorities to discuss the direct listing of China-based companies, instead of via Hong Kong-incorporated listing vehicles (Niu, 1997).
The takeover of a shelf company to achieve a back-door listing in Hong Kong was accompanied by the outflow of assets from the mainland China. The Chinese central government quickly became concerned about this outflow of the country’s assets and took a further step by allowing direct listings on overseas exchanges as an alternative venue for raising foreign capital for Mainland-incorporated SOEs. Hong Kong then became the first and most popular foreign exchange accessed by mainland Chinese companies.
2.2.2.2 Early Stage Listing in Hong Kong and the USA
In September 1992, the State Council of China published its list of nine SOEs selected to be the first ever to issue H-share equities. The first H-shares, issued by Tsingtao Brewery Company, were opened for offer in the Hong Kong market on 29th June, 1993, and began trading on the Hong Kong Stock Exchange on 15th July, 1993. But the Chinese government initially refused to allow primary listings to proceed in New York, London or any other place outside of China apart from Hong Kong. The government believed that the Hong Kong market for China-based issues should be developed before proceeding further. Therefore, the primary listing became one single offering, which took place in three parts: a share sale in Hong Kong, a public sale of ADRs in the United States, and a sale of Global Depository Receipts (GDRs) outside the United States (De Jonge, 2008).
At the early stage of cross-listing, the Chinese government was aware that due to the poor infrastructure of the local capital market, it was better to list those SOEs that are large in capital scale and perform reasonably well on Hong Kong and New York Stock Exchanges rather than listing domestically. Generally, these SOEs listed in Hong Kong and New York in 1990s were the ones that have been strong performing and have previously preferred the prestige and fund-raising potential of listing-abroad. These companies are regarded as being the “best of the best” (Huang and Song, 2005). Effective from 2005, any Chinese company wishing to list overseas is also required to list locally. For example, China Mobile, and Aluminum Corporation of China were listed back on the Shanghai Stock Exchange in 2007.
2.2.2.3 Recent Trend
Over the last few years we have seen significant changes in the stock exchange landscape globally. Several major key players of the stock exchanges are trying to focus on new sources of profits and winning business outside the home market. They are tripping over each other in China to tout the advantages of listing abroad to Chinese companies and regulators. (Kang, 2008). In China’s case, few of the private Chinese companies can resort to raising new money from local equity markets because of a long queue to list on the two main Chinese bourses. Meanwhile, the Chinese government recognizes the needs of Chinese companies to raise share capital and generally does not stand in the way of private firms that seek to tap into the world’s capital markets.
Therefore, under this circumstance, these small to medium-sized Chinese companies finally have their time to be listed on stock exchanges, but only with the permission from the Chinese government.
In recent years, Chinese firms have been dominating the worldwide IPOs, notably for the world’s biggest IPO by the Industrial and Commercial Bank of China Ltd. in October 2006, who raised a total amount of US$21.9 billion. However, Hong Kong dominates both in terms of Chinese listing numbers and issuing size. Most of these Chinese shares traded in USA are registered with the U.S. Securities and Exchange Commission and traded as ADRs. The early ADRs traded in the New York Stock Exchange also have underlying shares listed and traded in the Hong Kong Stock Exchange. For the characteristics of the Chinese companies related to the host stock exchange, Hong Kong and New York Stock Exchanges attract the Chinese monopolized companies in the field of natural resources, banks, and telecoms. NASDAQ gathered Chinese IT, dot com companies and pharmaceutical companies. Singapore appears to be more attractive to industrial, food and retailing Chinese companies.
2.2.3 Location of Chinese Cross-listing
The last decade witnessed a more diversified listing location for Chinese firms. Besides the Hong Kong Stock Exchange and the New York Stock Exchange as popular locations for Chinese cross-listing, London AIM, NASDAQ and Singapore have attract more and more Chinese firms to list, especially the small to medium sized private Chinese firms. For example, among the nearly 100 overseas Chinese listings in 2006, these Chinese private firms accounted for 87 per cent to list in Singapore and Hong Kong4. Those smaller Chinese firms have traditionally looked to the Hong Kong and Singapore markets, but there are too many Chinese firms looking to list for those bourses to satisfy demand. And a greater number of them do not fulfil the profitability/track record requirements of the existing market and are therefore unable to obtain a listing. Therefore, Hong Kong Growth and Enterprise Market (GEM) and London AIM, which removed the entry barrier, enabling growth enterprises to capitalize on the growth opportunity of the region by raising expansion capital under a well-established market and regulatory infrastructure, become the hot destinations for these Chinese firms. AIM has been incredibly successful in attracting the listings of, and
raising money for, international small-cap growth companies in recent years and it is natural that Chinese companies now seek funding on AIM. But GEM never took off because it failed to attract sufficient quality companies or institutional investors. Meanwhile, listing in AIM, HK GEM and Singapore avoids the costs of complying with the U.S. Securities and Exchange Commission (SEC) and Sarbanes-Oxley requirements, which some companies find increasingly burdensome. But generally speaking, AIM, Hong Kong GEM and Singapore failed to attract quality Chinese companies.
Besides the stock exchanges mentioned above, several other stock exchanges have also become the listing destinations for Chinese firms. For example, Shangdong Gongyou Machines Limited becomes the first Mainland Chinese enterprise listed in the Frankfurt Stock Exchange. So far, there are total of 14 Chinese firms listed on the stock exchange of Frankfurt by the end of 2008. Meanwhile, on the 26th April 2007 Asian Media becomes the first Chinese firm listed in the Tokyo Stock Exchange. The Korean Stock Exchange also approved the listing request for China Huafeng Textile Group on the 1st June 2007. Besides the more diversified listing destinations, the Chinese cross-listing phenomenon also becomes a mutual interaction between the Chinese companies and overseas stock exchanges. On the 3rd December 2007, NASDAQ set up their China headquarters office in Beijing. Later, on the 11th December 2007, the New York Stock Exchange also opened their office in Beijing. It is reported that the London Stock Exchange and the Korean Stock Exchange are going to have their office in China soon. So far, there are a total of nine foreign exchanges that have representative offices in China5 (Xinhua News Agency).
Since the first cross-listing of Chinese companies in Hong Kong was announced on October 24 1992, and as of December 2008, there are 513 Chinese cross-listings including the dual or triple cross-listings on the major stock exchanges internationally. Table 2.1 is a summary of the distributions of these Chinese cross-listings in various stock exchanges. It demonstrates that the location choice of Chinese cross-listings have experienced two different trends in two different phases. The first phase occurred during the period of 1990-2000 where most of the cross-listings were located in the Hong Kong Mainboard market and only a limited number of Chinese companies were listed in New York and Singapore. Notably, even those Chinese listings in New York are also
5 The foreign exchanges with representative offices in China are: Hong Kong Stock Exchange, New York Stock Exchange, NASDAQ, Tokyo Stock Exchange, Korea Exchange, Singapore Exchange, London Stock Exchange, and Deutsche BÖrse Group.
T ab le 2.1: C h in es e O ve rs eas L is ti n gs C ros s M a rk et s b y Y ear 1992 -200 8 T hi s t abl e pr ovi de s s um m ar y s ta ti st ic s of C hi ne se f ir m s l is te d i n di ff er ent s toc k e xc ha ng es by ye ar s. G er m a n y S in gap or e T ot a l A B H K M ai n b o ar d H K G E M S u b-tot al L o n do n S E L o n d o n A IM S u b-tot al A M E X N Y S E N A S D A Q 144 A O T C S u b-tot al F ra n kf ur t S in ga po re C ros s-li st in gs 1990 8 1991 5 1992 40 18 0 1993 124 23 6 6 1 1 1 3 9 1994 110 17 8 8 1 5 2 8 1 17 1995 24 12 1 1 1 3 4 1 6 1996 203 15 6 6 1 1 4 6 1 13 1997 206 16 15 15 3 1 4 1 3 1 5 1 25 1998 106 5 2 2 0 1 1 2 2 6 1999 98 2 3 3 1 1 5 9 2000 136 6 3 3 6 2 2 1 3 1 5 1 14 2001 79 3 4 7 2 1 1 4 4 15 2002 71 4 11 15 1 1 1 5 6 22 2003 67 10 8 18 2 1 1 2 6 13 37 2004 100 8 8 16 1 4 5 2 8 1 4 15 30 66 2005 15 9 3 12 7 7 2 8 2 12 23 54 2006 66 17 3 20 24 24 4 2 4 10 24 78 2007 126 9 9 15 15 2 1 9 10 1 1 33 7 27 91 2008 77 6 1 7 4 4 3 1 1 24 29 7 4 51 T o tal 1661 114 110 41 15 1 6 56 62 6 4 4 33 12 54 149 14 137 513 Sour ce s: I nf or m at ion of C h ine se c om pani es l is te d in C hi n a A and B m ar ke ts ar e obt ai ne d f rom C SM A R d at aba se . Inf or m at ion of C hi ne se c om pan ie s li st ed i n U SA , L on don A IM , Si ngapor e, and F rank fur t ar e ob tai ne d fr om t he s toc k ex cha nge w ebs it e re spe ct iv el y. L oc al M ar k et s O ve rs eas M ar k et s M ai n la n d C h in a H on g K on g U n it ed K in d om U S A
dual-listed in the Hong Kong Stock Exchanges. Starting from 2001, the cross-listing phenomenon for Chinese firms has been accelerated with more location choices, which could be labelled as the second phase. London AIM, Hong Kong GEM, and NASDAQ have become attractive listing locations for Chinese firms. Meanwhile, the listing numbers in Singapore have been greatly increasing, starting from the second phase of the cross-listing. And, since then, there has been no more Chinese companies issued B-shares in the China B market. More specific data on the Chinese cross-listing companies are presented in Appendix 1.
2.2.4 Modes of Chinese Cross-listing
With more and more Chinese private firms going public in international markets, how to list internationally becomes another characteristic for the listing modes of Chinese private firms, especially for those who don’t have the resources or profits for a splashy initial public offering. There are three major overseas listing modes that a Chinese firm can choose from. The first mode is primary listing. The primary listing involves restructuring the current company, setting up a holding company in Mainland China, getting the approval from the local government and the overseas stock exchange, finding the lawyers, registered accountants and banks, auditing, and lodging the files to apply for listing on the stock exchange. And compared to most of the Chinese private firms, this whole public process is complicated with high costs, regulatory barriers and extensive time commitments. However, most of the SOEs would not worry about the listing expenses related to the primary listing. These Chinese companies have explicit goals to choose direct IPOs process when looking to get a Hong Kong or U.S. stock listing.
The second mode is termed reverse merger. The reverse merger mode makes the overseas-listing process faster and less onerous than the primary listing model or IPO. This listing mode has been adopted greatly by Chinese private firms. With this mode of listing, a Chinese firm is acquired by a U.S. or an international shell company, and this company could be worth nothing, which is publicly traded. The buying company pays for the acquisition target with the shares. When the transaction is closed, the target company receives enough stocks to have the controlling ownership of the company that “acquired” it. Then, the board of this shell company resigns and the Chinese board takes over, changes the name of the company, and issues new security to hedge funds or other
new investors, raising millions of dollars. And this process only takes a few months. One of the successful Chinese companies that adopted this mode and got to list in the USA successfully is Sinovac Biotech Ltd, a China Beijing-based vaccines maker that has raised $12 million capital in 2003. According to the Reverse Merger Report that with more than 20 per cent involved foreign companies seeking US listings, Chinese companies accounted for 60 per cent of the foreign deals in 2006 (Dolbeck, 2006).
The third overseas listing mode is merger & acquisition. This mode involves setting up an investing company offshore. The offshore company registration locations for most of the Chinese private firms are the Cayman Island, Bermuda, Bahamas, the British Virgin Island, and the Bahamas, where tax exemption benefits are accessible. This offshore investing company should have some degree of ownership control of the Chinese domestic company. Then a target company is chosen to issue the new shares and merge with the capital of the China domestic company. Therefore, the China domestic company doesn’t need to pay the cash to acquire its shares, and the prior controlling shareholder is kept.
But no matter which overseas-listing mode the Chinese firm chooses, these Chinese firms have substantial operation activities in China, and are also incorporated in the Cayman Islands or other tax-exempt locations, and problems occur sometimes. Unlike in the United States, where many relevant jurisdictions are effective in place, the Cayman Islands and other tax-exemption countries’ laws do not specifically provide for shareholder appraisal rights on a merger or consolidation of a company. This may make it even more difficult to assess the value of any consideration shareholders may receive in a merger or consolidation if the shareholders believe the consideration offered is insufficient. For example, most of the company directors and officers reside outside the country of the host stock exchange and consequently so do the assets of those company personnel. As a result, it may be difficult or impossible for the shareholders to bring an action against the listed company or these individuals in China or in the country where the company is incorporated in the event that the shareholders believe that their rights have been infringed under the applicable securities laws or otherwise. Even if the shareholders are successful in bringing an action of this kind, the laws of the Cayman Islands or other tax-exemption country and of China may render them unable to enforce a judgment against the assets or the assets of the directors and officers. Further, shareholders of the Cayman Islands exempted companies have no general rights under