Journal of Undergraduate Research
at Minnesota State University,
Mankato
Volume 6 Article 16
2006
Poverty in the Twin Cities using GIS Studying
Je Moua
Minnesota State University, Mankato
Follow this and additional works at:http://cornerstone.lib.mnsu.edu/jur
Part of theGeographic Information Sciences Commons, and theHuman Geography Commons
This Article is brought to you for free and open access by the Undergraduate Research Center at Cornerstone: A Collection of Scholarly and Creative Works for Minnesota State University, Mankato. It has been accepted for inclusion in Journal of Undergraduate Research at Minnesota State University, Mankato by an authorized administrator of Cornerstone: A Collection of Scholarly and Creative Works for Minnesota State University, Mankato.
Recommended Citation
Moua, Je (2006) "Poverty in the Twin Cities using GIS Studying,"Journal of Undergraduate Research at Minnesota State University, Mankato: Vol. 6, Article 16.
Student Agreement:
I am submitting my research article to be published in the JUR (The Journal of Undergraduate Research at Minnesota State University, Mankato), an electronic journal of the Minnesota State University Undergraduate Research Center.
I/We certify have followed the accepted standards of scientific, creative, and academic honesty and ethics.
I understand that my article submission will be blind-reviewed by faculty reviewers who will recommend acceptance for publication; acceptance with revisions; or reject for publication.
I understand that as author, I retain the right to present any part of the research in any form in other publications.
The JUR has the right to reproduce and reprint published submissions for instructional or promotional purposes.
For complete details, seeJournal of Undergraduate Research at Minnesota State University, Mankato policies page.
Mentor Agreement:
I have reviewed the submission, and I support its inclusion in the JUR (The Journal of Undergraduate Research at Minnesota State University, Mankato). I understand that I will be acknowledged as the faculty mentor for the student author(s). To the best of my knowledge, the student has followed the accepted standards of scientific, creative, and academic honesty and ethics.
STUDY OF POVERTY DISTRIBUTION IN THE TWIN CITIES METRO AREA USING GIS
Je Moua (Geography)
Changjoo Kim, Faculty Mentor (Geography)
Geographic Information Systems (GIS) allow easy comparison of spatial phenomenon with other variables and output the results onto maps which non-specialist audience can easily interpret and analyze. This study made an effort to understand the spatial
distribution of poverty within the Twin Cities Metro Area. Poverty distribution is
compared with but not limited to the selected variables such as education level, education funding, family size, family composition, infrastructure distribution, and illicit drugs. The Census 2000 family income variables have been analyzed and mapped using GIS. According to federal guidelines in 2000, the poverty threshold for a family of three was $14,150. The poverty threshold for a family of four was $17, 050. Results showed the concentration of families living below federal poverty level is not evenly distributed. The correlation of this spatial distribution to that of the aforementioned variables can further be analyzed. Maps of these analyses can assist urban policy makers on development decisions and processes.
STUDY OF POVERTY DISTRIBUTION
IN THE TWIN CITIES METRO AREA USING GIS
Je Moua
Changjoo Kim, Faculty Mentor (Geography) Minnesota State University, Mankato
May 8, 2006
***ABSTRACT***
Geographic Information Systems (GIS) allow easy comparison of spatial phenomenon with other variables and output the results onto maps which non- specialist audiences can easily interpret and analyze. This study made an effort to understand the spatial distribution of poverty within the Twin Cities Metro Area. Poverty distribution is compared with selected variables such as education level, family size, family compositions, race, and immigration. The Census 2000 family income variables have been analyzed and mapped using GIS. According to federal guidelines in 2000, the poverty threshold for a family of three was $14,150. The poverty threshold for a family of four was $17,050. Results showed the concentration of families living below federal poverty level is not evenly distributed. The correlation of this spatial distribution to that of the aforementioned variables can further be analyzed. Maps of these analyses can assist urban policy makers on development decisions and processes.
INTRODUCTION
Ranked as the best state to live in (Morgan Quitno, 2003), Minnesota is not one of the states that comes to mind when one thinks of poverty in the United States. In fact, it has one of the lowest poverty levels among the fifty states (Census Bureau, 2005); but poverty, the inability for a family to provide the minimal standard of living for its members, does exist. Small children are often the victims as they are fully dependent on the adult to provide food, shelter, and guidance. Children living in poverty savor their free lunches at school knowing that it’s the last big meal of each weekday. The problem of poverty is often not at the forefront of attention for most Americans. In this research, we attempt to bring the issue to the front with this spatial study of poverty in the Twin Cities metro area using geographic information systems (GIS).
There are families living in destitution within the Twin Cities. Most people go about their everyday life unaware of the problem. For a family living in poverty, every day is a fight against hunger; a fight to be sheltered; a fight for a new direction. This study asked two questions: What is the spatial distribution of poverty in the Twin Cities? What are some of the significant correlations of poverty?
The goals here are to understand the spatial distributions of poverty and its hypothetical variables within the Twin Cities. Comparing the distribution maps of poverty to those hypothetical variables, we see if there are any correlations.
Then we determine if our results are significant enough to support a claim that there are strong correlations between poverty and these variables. The hypothetical variables in this study include single-mom families, post-secondary degree attainment for population 25 years and above, family size, race, foreign- born, and affordability of housing.
The Twin Cities metro area is home to approximately 2.77 million people. Within Minneapolis and Saint Paul alone the population is estimated to be at 669,810 (Metropolitan Council, 2005). According to studies done by the Brookings Institution, the Twin Cities metro area is among the lowest in the nation in terms of poverty, but highest in term of disparities (Brookings Institution, 2005). This means that we have very low number of people living in poverty, but they are all forced somehow to live in a concentrated area. There are over-representations of ethnic groups throughout the state, contributing to the high statistic of disparities.
LITERATURE REVIEW
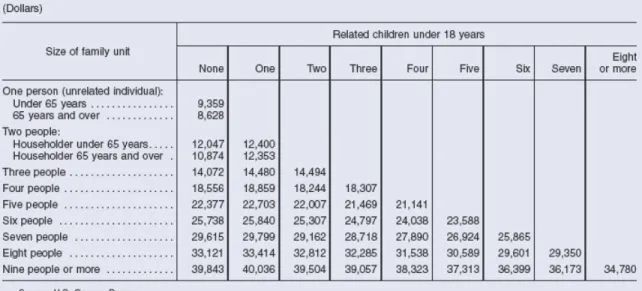
The poverty thresholds are created by the United States Census Bureau under the directive of the Office of Management and Budget. The thresholds vary by family size and composition to determine which family is in poverty. The thresholds do not vary geographically, but are updated annually according to inflation. The income amounts for the thresholds are before taxes and do not include capital gains and non-cash benefits such as public housing, Medicaid, and food stamps (Census Bureau, 2002).
Figure 1: Poverty thresholds table.
METHODOLOGY
Data for this study were gathered from ESRI.com and Census.gov. ESRI is one of the leading GIS software developers in the world. Using Microsoft Excel, the data were prepared by converting raw numbers into percentages for families, education, and foreign-born population. The files were saved in DBF format and opened with ArcView GIS. The data were converted to number format and joined to the shapefile attributes.
The maps are mapped in the demographic unit of a block group. Each block group typically consists of 3,000 – 4,000 people. It is less accurate than blocks but more accurate than census tracts. The study area is focused around Minneapolis – Saint Paul, and its suburbs. The far reaches of the agricultural areas of the seven counties are omitted in my results and conclusion as their results were insignificant to this study.
RESULTS
In Figure 1 is the map of poverty distribution. Nearly all block groups with more than 38 percent of families below the poverty thresholds are inside central and north Minneapolis and central Saint Paul. For simplification, we call these zones with a high percentage of impoverished families the poverty zones. This distribution showed high disparities of families in poverty and families not in poverty.
Figure 2: Percentage of families living in poverty.
Interstate Highways Water
Minneapolis - Saint Paul Percentage 0 - 0.04 0.04 - 0.13 0.13 - 0.24 0.24 - 0.38 0.38 - 0.76
The distribution of high percentage of families consisting of single-mom with children below age of 18 is almost identical to the distribution of impoverished families as shown in Figure 3. The study of these first two maps shows a strong correlation between poverty and female head-of-household with children.
Figure 3: Percentage of families consisting of single mom with children 18 years old or younger.
Interstate Highways Water
Minneapolis - Saint Paul Percentage 0 - 0.07 0.07 - 0.15 0.15 - 0.25 0.25 - 0.37 0.37 - 0.63
Figure 4 maps the distribution of percentage of the population 25 years or older with a post-secondary degree. This map shows a vacuum of this educated population inside the poverty-stricken areas when compared to the poverty distribution map. The correlation here is that with post-secondary degree, a person is not bound to live in poverty.
Figure 4: Percentage of population 25 years or older with a post-secondary degree.
Interstate Highways Water
Minneapolis - Saint Paul Percentage 0 - 0.24 0.24 - 0.37 0.37 - 0.51 0.51 - 0.66 0.66 - 0.95
Figure 5 maps the percentage of the population 25 years or older without a post-secondary degree. The impoverished zones carry a high percentage of population 25 years or older without a post-secondary degree, but the interesting part of this map is that there are also high percentages living outside of the poverty zones who do not have post-secondary degrees. How were these people without post-secondary degrees able to move out into the suburbs?
Figure 5: Percentage of population 25 years or older without a post-secondary degree.
Interstate Highways Water
Minneapolis - Saint Paul Percentage 0.05 - 0.33 0.33 - 0.49 0.49 - 0.63 0.63 - 0.76 0.76 - 1
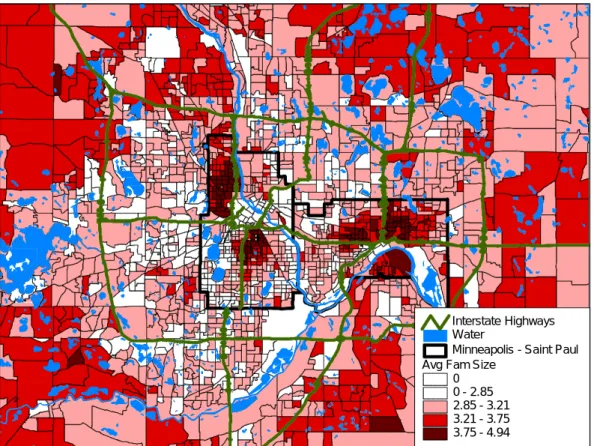
The families with an average size greater than 3.75 are highly concentrated within the poverty zones as seen in Figure 6. Larger families with more mouths to feed can be prone to a life of poverty. There are distinct correlations between family size and poverty.
Figure 6: Average family size.
Interstate Highways Water
Minneapolis - Saint Paul Avg Fam Size
0 0 - 2.85 2.85 - 3.21 3.21 - 3.75 3.75 - 4.94
Figure 7 maps the distribution of four major minority groups in the Twin Cities. These groups are African American, Native American, Asian American, and Hispanics. While there are strong concentrations of these minorities within the poverty zones, there are also concentrations living in the wealthier northern and eastern metro suburban areas. The map still shows high disparities in terms of ethnic diversity, but it confirms that race cannot completely be blamed for poverty.
Figure 7: African American, Native American, Asian American, and Hispanic populations.
Interstate Highways Water
Minneapolis - Saint Paul Major Minorities 0 - 99 100 - 266 267 - 554 555 - 1081 1082 - 2922
Figure 8 maps the percentage of the population that is foreign-born living in the Twin Cities. There is high concentration of this population within the poverty zones, but there are scattered high percentages of foreign-born inhabitants outside of the poverty zones. These are perhaps the populations of foreign-born that arrived at an earlier time and have worked themselves out of any poverty lifestyles. Being foreign-born may be a correlation to poverty at an early stage of immigration.
Figure 8: Percentage of population that are foreign-born.
Interstate Highways Water
Minneapolis - Saint Paul Percentage 0 - 0.05 0.05 - 0.14 0.14 - 0.25 0.25 - 0.39 0.39 - 0.73
Figure 9 maps the percentage of housing units that are affordable to households earning just 50% of the regional median income. It holds a very strong correlation to poverty. The affordable housings are highly concentrated inside the poverty zones shown in Figure 2. The blue regions are where families living in poverty are forced to live.
Figure 9: Percentage of housings affordable to households at 50% of the regional median income. Map Source: Institute on Race & Poverty.
CONCLUSIONS
Poverty, while quite low in the Twin Cities when compared nationwide statistics, is as highly disparitized as can be found nationwide. Single-mothers with children under the age of 18 are very likely to be stuck in poverty. Education can get a person out of poverty, but lack of education can be compensated for with good paying and low skill jobs. In today’s economy, the most likely means of getting out of poverty is to get an education than to rely on hard work as an unskilled worker. The bigger a family is, the higher the chance a family will be in poverty. Race is not a strong factor to poverty, although racial discriminations may still exist. Figure 7 clearly shows that anyone can get out of poverty regardless of race. Recent immigrations are contributing to some poverty, but as time goes on, immigrants are able to get out of poverty. Lastly, families living in poverty are trapped in city neighborhoods because that is where the affordable housing units are located.
REFERENCES
ESRI.
<http://www.esri.com>
United States Census Bureau. <http://www.census.gov>
Metropolitan Council.
<http://www.metropolitancouncil.gov>
Morgan Quitno Press. 2004. Results of the 2004 most livable state award. State and City Ranking Publications.
The Brookings Institution. 2005. Mind the gap: reducing disparities to improve regional competitiveness in the Twin Cities.
Institute on Race & Poverty. 2000. Percentage of Twin Cities housing units affordable to households at 50% of the regional median income by census block group, 1999.