Determinants of the Performance of Small Scale Irrigation in
Improving Household Farm Income in Hadiya Zone, Ethiopia
MAMO ESAYAS AMBE
Lecturer, Department of Economics, Wolaita Sodo University, P.o.Box 138, Wolaita Sodo, Ethiopia Abstract
This study was mainly aimed to investigate the determinants of the performance of small scale irrigation in improving household farm income in hadiya zone, Ethiopia. Both Descriptive statistics and binary logistic regression analysis were used for analyzing quantitative data. From the total included five determinant factors, education level of respondents’, household labor and land holding size, household income had significant positive effect on the use of irrigation water at 5% significance level. However, age of respondents and farm distance from river had significant negative effect on the use of irrigation water at 10% and 5% significance level respectively. From the total Irrigation user respondents’ household the majority (96.2%) have use irrigation water from the rivers and which are common resources and major sources of irrigation water in the area. Out of the total irrigation user respondents (79.7%) have harvested perennial crops more than two times and grown annual crops two times per year from the same farm. While out of the total irrigation non-user respondents’ household depended on only rain fed agriculture (56.4%) have grown annual crops only one time per year from the same farm. Consequently, the independent sample test result showed that the irrigation user respondents’ household obtained significantly larger mean annual gross farm income than irrigation non-user respondents’ household at 1% significance level. As a result, the irrigation user respondents’ household obtained excess of 17067.98 birr of mean annual gross farm income that obtained by irrigation non-user respondents’ household. According to these findings, in addition to river water it should be better to initiate farmers to develop and use spring water at community level and shallow wale at household level. It is likely to be valuable for future irrigation development. Governmental and non-governmental organizations should give emphasis on the adult education for farmers and that improves farmers’ awareness about adoption of technologies and increases their access to use irrigation water in the study area. And also should give emphasis for provision of credit for farmers and that improves their financial capital to purchase irrigation technologies and to hire labor which fills the gap of family labor shortage.
Keywords: logistic regression, irrigation, food security, economic growth 1. INTRODUCTION
1.1 Background of the Study
Ethiopia is predominantly an agrarian country with the vast majority of it population directly or indirectly involved in agriculture. Agriculture in the country is mostly small-scale rainfall dependent, traditional and subsistence farming with limited access to technology and institutional support services (Desta, 2004).
Ethiopia has untapped resource bases for agriculture development. The major resource bases for agriculture development are land, diverse agro-ecology, water resources, bio- diversity and human resources. The agriculture sector has promising opportunities to transform itself from subsistence to a level of modern and commercial sector. Nevertheless, the sector faces several challenges to produce adequate food supply for domestic consumption and export earnings. Furthermore, the agriculture sector is largely depends on rain fed production and is dominated by smallholder farming systems (Mutsvangwa et al, 2006).
The development of small-scale irrigation is also one of the major intervention to increase agricultural production in the rural parts of a country. This helps farmers to overcome rainfall constraint by providing a sustainable supply of water for cultivation and livestock production (FAO, 2003). Irrigation development is being suggested as a key strategy to improve agricultural productivity and to encourage economic development (Bhattarai et al., 2002). Irrigation in Ethiopia contributes to increase farmers’ income, household resilience and buffering livelihoods against shocks and stresses by producing higher value crops for sale at market and to harvest more than once per year. In turn, this provided them to build up their assets, buy more food and non-food household items, educate their children, and reinvest in further increasing their production by buying farm inputs or livestock. However, the benefits are very unevenly distributed among households (Eshetu et al, 2010).
Irrigation can benefit the poor specifically through higher production, higher yields, lower risks of crop failure, and higher and all year round farm and non-farm employment (Hussain and Hanjra 2004). Farmers in poor areas have suffered from chronic poverty and severe food insecurity being vulnerable to climatic changes and dependant on variable rainfall. This is mainly attributed to a low level of agricultural productivity. Such low productivity areas are characterized by persistent rural poverty, and increasing population pressure has often resulted in a vicious circle of poverty and environmental degradation (Von Braun et al., 2008).
suggested as a key strategy to enhance agricultural productivity and to stimulate economic development (Bhattarai et al., 2002). In the contemporary literature, irrigated farming is recognized as central in increasing land productivity, enhancing food security, earning higher and more stable incomes and increasing prospects for multiple croping and crop diversification (Hussain et al., 2001; Smith, 2004). Further investment in complementary infrastructures (credits, extension and markets) can produce a spillover effects to neighboring farmers (Abonesh et al., 2006).
1.2. Statement of the Problem
Agricultural production in Ethiopia is primarily rain-fed, so it depends on erratic and often insufficient rainfall. As a result, there are frequent failures of agricultural production. Irrigation has the potential to stabilize agricultural production and mitigate the negative impacts of variable or insufficient rainfall. Irrigation plays a great role in agricultural production through increasing crop yields, and enabling farmers to increase cropping intensity and switch to high-value crops (Zhou et al., 2008).
The irrigation development, particularly small-scale irrigation is one of the major programs to improve agricultural production in the rural households of a country. It helps poor households to overcome shortage of rainfall by giving optimal water for irrigation agriculture and livestock, strengthen the base for sustainable agriculture, provide increased food security to poor communities through irrigated agriculture and contribute to the improvement of human nutrition (FAO, 2003).
Even if Ethiopia has a huge potential in terms of surface and ground water availability and land which are in most cases suitable for irrigation the adoption of small-scale irrigation is in its infant stage. The major constraints that slow down the adoption of the sub-sector among others are predominantly primitive nature of the overall existing production system, shortage of agricultural inputs and low level of users‟ participation in the development and management of irrigated agriculture, limited trained manpower and inadequate extension services.
Use of irrigation also demonstrated a change in the livestock holding capacity of irrigators than pre- irrigation and it also signified that higher food availability, accessibility and better income for irrigators than no irrigation beneficiary households Azemer (2006).The study area Eastern Badewacho woreda is one of the food insecure areas in southern Ethiopia. Because of that the government is implementing different agricultural development program in order to achieve food security in rural households. Among these programs, irrigation development is primarily taken by the government. In this program, government organizations, international and local NGOs, micro-finance institutions, private sectors and farmers are involved at different levels with different tasks.
But such interventions are encountering various social and technical problems that have challenged the strategy and implementation approaches (BoARD, 2016).Due to the availability of ground water as well as river water in some selected Kebeles of the area, Eastern badewacho Woreda is one of the Woredas with high irrigation potential in hadiaya Zone of SNNPR. Irrigation potential of the area is estimated about 4548 hectares (WBAD, 2016). Therefore, the government of hadiaya Zone and the administrative of the Woreda gave special attention on irrigation in irrigation potential Kebeles to increase agricultural production of the rural households.
However, the Woreda lacks in-depth studies on the determinats of the performance of small-scale irrigation in improving farm househould income . The program is also not well supported by complete research which is able to examine the cropping practice and farm income variation of irrigated and non-irrigated household in the Woreda. That is, it is not well known the role of irrigation on household farm income and to what extent the households using irrigation are better off than those who depend on rain-fed agriculture in the study area. Therefore, this study was tried to fill these gaps by studying factors affecting rural households’ participation in small-scale irrigation and role of small-scale irrigation on rural household farm income.
1.3. Objective of the Study 1.3.1 General objective
The general objective of this study was to investigate determinants of the performance of small scale irrigation on improving the household farm income in hadiya zone,Ethiopia .
1.3.2 Specific objectives
The specific objectives of the study is :-
To analysis the farmers status in the use of small-scale irrigation in the study area. To identify the factors that affects the farmers to use the small-scale irrigation in the area. 1.4 Research Questions
In this study the following research questions were addressed:
What looks like the farmers status in the use of small-scale irrigation in the study area? What are the factors that affect use of small-scale irrigation by households?
1.5 Sample and Sampling Design
In this study a multi- stage sampling procedure was employed. In the first stage, the study area is selected purposively as small-scale irrigation practice is available in the woreda. In the second stage, four Kebeles modern small-scale irrigation system were selected purposively. In the third stage, sampling frame (complete village household lists) was obtained from each Kebele administrative office.
In the fourth stage, the total households in the three sample Kebeles were stratified in to the two strata (irrigation water user and non-user households.
In the fifth stage, simple random sampling technique was applied to select the sample unit from each stratum at each kebele via probability proportionate to size procedure
From the total of 2625 households found in three samples Kebeles 118 respondent households were selected for this study by using the following formula: The following formulas of sample size determination adopted from (Yamane, 1967).
n = __N __
1+N (e)2 Where: n = Sample size; N= Total number of households in the selected Kebeles;
e = precision level or sampling of error 9% (0.09); n = __N __
1+N (e)2
n = 2625 = 118 1 + 2625(0.09)2
To identify the 118 participant’s a stratified random sampling technique was used.
Table 1: Sample Kebeles and Number of Sample Households for Two Strata from each Kebele 1.6 Data Source and Methods of Collection
The nature of the data was both qualitative and quantitative collected from primary and secondary sources. Primary data for the study was collected from selected sample households, focus group discussion, and interview with key informants (committee members of water user's associations, peasant association executive committee members, Women development army, development agents and Wereda irrigation development experts) and field observations.
Secondary data were also collected from written documents from Woreda agricultural and Natural Resource Management office and from other published and unpublished materials.
1.7 Methods of Data Analysis
The quantitative data was coded and entered into SPSSv16 and then analyzed by using descriptive statistics such as frequency, mean, chart and percentage. The statistical significance of the variables in the descriptive part was tested for both dummy and continuous variables using chi-square and t-test, respectively.
Econometric Model: To identify the determinants that influence the use of irrigation water, the binary logistic regression analysis was employed. It is selected because of the model relevance to deal with dependent variables that are dichotomous. According to G. Rodrguez (2007) a range of regression techniques have been developed for analyzing data with categorical dependent variable, including logistic regression and discriminate analysis. Logistical regression is regularly used rather than discriminate analysis when there are only two categories of the dependent variable. Logistic regression is also easier to use with SPSS than discriminate analysis when there is a combination of numerical and categorical independent variables, because it includes procedures for generating the necessary dummy variables automatically, requires fewer assumptions, and is more statistically forceful. Discriminate analysis strictly requires the continuous independent variables (though dummy variables can be used as in multiple regressions). Thus, where the independent variables are categorical, or a combination of continuous and categorical and the dependent variables are categorical, logistic regression is necessary. Logistic regression provides a coefficient ‘b’, which measures each independent variables partial contribution to variations in the dependent variables. The goal is to correctly predict the category of outcome for individual cases using the most parsimonious model. To accomplish this goal, a model (i.e. an equation) is created that includes all predictor variables that are useful in predicting the response variable. It determines the
no Sample
Kebeles Irrigation user household. Total HH Sample HH. Irrigation non-user household. Total HH. Sample HH. Total household. Sample
M F Total M F Total M F Total M F Total M F Total 1 Mazoreya 470 52 522 22 2 24 94 27 121 7 2 9 29 4 29 2 Wera lalo 741 34 775 33 2 35 201 22 223 9 1 10 41 3 45 3 Hamburse 385 56 441 17 3 20 380 163 543 14 6 20 32 9 44 Total 1596 142 1738 72 7 79 675 212 887 30 9 39 102 16 118
impact of multiple independent variables presented simultaneously to predict membership of one or other of the two dependent variable categories. The mathematical transformation (log transformation) is needed to normalize the distribution. Where log transformation and square root transformation moved skewed distribution closer to normality. This log transformation of the p values to a log distribution enables to create a link with the normal regression equation. The log distribution (logistic transformation of p) is also called the logit of p or logit (p). Logit (p) is the log (to base e) of the odds ratio or likelihood ratio that the dependent variable is 1. In symbols it is defined as:
logit (p) = log [p / (1− p)] = ln [p / (1− p)]
Whereas p can only range from 0 to 1, logit (p) scale ranges from negative infinity to positive infinity and is symmetrical around the logit of 0.5 (which is zero).
The logit model applied in this study to assists in estimating the probability of irrigation water use status of a household that can take one of the two values, use of irrigation and non- user.
According to Gujarati (1995), the functional form of the logit model is presented as follows:
P
i= E( )
Yi
Xi
=
1
( 0 1 )1
i Xe
−β +β+
( 1)P
i= E = Xi Yi i Ze
−+
1
1
Where Pi is a probability of a ith household being use of irrigation and ranges from 0 to 1; Zi is a functional form of m explanatory variables(X) which is expressed as:
Zi=
β
0+∑
= mi 1 i
β
Xi, i=1, 2, 3---m (2)
Where;
β
0is the intercept andβ
iare the slope parameters in the model. The slope tells how the log-odds infavor of a given household using irrigation water status change as independent variables change. If
P
i is theprobability of a household being use of irrigation, then 1-
P
iindicates the probability of a given household isnon- using irrigation water, which can be given as: 1-Pi= i Z
e
+
1
1
(3) Dividing equation (1) by equation (3) and simplifying gives
e
Zi= i iP
P
−
1
= i i Z Ze
e
−+
+
1
1
(4)Equation (4) indicates the odds ratio in favor/in terms of a given household using irrigation water. It is the ratio of the probability that a household will use irrigation water to the probability he will not use. Lastly, the logit model is obtained by taking the natural logarsim of equation (4) as follows:
Li = ln
−
i iP
P
1
=β
0+
β
1X
i (5)Where; Pi=the probability that Y=1 (that a given household is using irrigation water);
1-Pi=the probability that Y=0 (that a given household does not use irrigation water);
L=the natural log of the odds ratio or logit;
i
β
=the slope, measures the change in L (logit) for a unit change in explanatory variables (X);0
β
=the intercept. It is the value of the log odd ratio, ii
P
P
+
1
, when X or explanatory variable is zero.Thus, if the stochastic disturbance term (U
i
) is taken into consideration the logit model becomes Li =β
0+
β
1X
i+Ui1.8 Definitions of Variables and Hypotheses The Dependent Variable
Use of Irrigation Water (UIRRW): Is the dependent variable. It is a dummy variable, given a value of 1 if a household are user ofirrigation and 0 otherwise.
Independent Variables Independent variables are those variables which are expected to affect the dependent variable in one way or another. These variables are selected based on the available literature and previous research works related to this study and are discussed below:
Sex of the household (SEX):This is a dummy variable, which takes a value of 1 if the household is male and 0 otherwise. Male household heads are expected to have higher income compared to female household heads
because of better labor inputs used in male-headed households than the female headed ones. Land Size : it is
continuous variable and measured in hectare. Total cultivated land is the total sum of the house hold‟s own and/or rented in/out from/to other households and measured in hectares. This does not include the grazing land and fallowing land.
Farmland is the major input for agricultural production in rural households. Total cultivated land should have a positive relationship with income of a household (Kamara et al. 2001).
Household Labor : it is continuous variable and agriculture labor force is calculated by using the conversion factor. Households with large family size in adult equivalent will have more number of agricultural labors than households with small family size. Household family size in adult equivalent has a direct influence on use of irrigation. In rural households, family labor is the major input used in agricultural production. Households with large family size in adult equivalent have more labor for agricultural production. Previous research result reported by Tesfay and Alemu (2001) shows that family size influence adoption of technology positively and hence, it is hypothesized that larger family size in adult equivalent have positive relation with the use of irrigation. So agriculture labor is expected to positive relation with the use of irrigation water.
Education Level: Education has play crucial role on adoption of improved irrigation technologies and management of irrigation water. It is likely that educated farmers have more readily to adopt irrigation technologies and may be easier to train through extension support. It is expected to positive relationship with the use of irrigation water. This variable is continuous variable. In agreement with previous research results have also revealed that education would influence adoption positively (Adebabay, 2003). As a result it is expected that education has positive relation with use of irrigation. Therefore, the formal education increases the use of technologies.
Farmers age : Age is a continuous variable and measured in years. Household head is the decision maker for farm activities. Age of household head is hypothesized to have negative relationship with the use of irrigation water. Because of the elders have less interest to adopt improved irrigation technologies and also irrigation practices need high physical labor. However, the elders are physically weak and access to use irrigation water also decreases. In agreement with this, Morris et al., (2000) have reported that, age is one of the factors that determine decision making of a person. Advanced aged household heads are more reluctant to accept new technology than younger household heads. Even after controlling for key confounding variables identified in prior organizational behavior research i.e., income, occupation, and education levels, compared to older workers, younger workers' technology usage decisions were more strongly influenced by attitude toward using the technology.
The Farm Distance from the Rivers: It is continuous variable and measured in Km. when distance increases from rivers, it needs high amount of labor, money and time costs to use irrigation water from this source. Distance from water sources is one of the external factors that often influence small-scale irrigation. Therefore it is hypothesized that negatives effects on the use of irrigation.
Contact with Development Agents: It is a continuous variable and measured in number of contact per month. It is expected to have positive relationship with the use of irrigation water. Because of contact with agricultural development agents improves farmers’ participation in training and adoption of improved irrigation technologies and increases their access to use irrigation water. In agreement with this, EDRI (2012), (Freeman et al, 1996; Chilotet al, 1996; van Den Ban and Hawkins, 1996; Asfewet al, 1997; Habtemariam, 2004). has suggested in its study that, receiving advice from ADAs and the perceived usefulness of ADAs’ advice are major factors that explain the likelihood of technology adoption and rate of input use.
Attending on Training: This includes farmers’ attending on training that focused on improved irrigation technologies, irrigation water management practices and water shad development and management practices. It is a dummy variable, 1 for attended last one year and 0 otherwise. It is expected to have positive relationship with the use of irrigation water. Because of participation on training improves farmers’ knowledge and skills and then improves their interests to adopt improved irrigation technologies. In agreement with this, Tsion et al. (2010) the emphasis in extension education is on helping people to help themselves. Hence extension service is an on-going process of getting useful information and disseminate to people and assisting them to acquire the necessary knowledge, skills and attitudes.
Livestock holding: It is continuous variable and calculated by using the conversion factor. Livestock is the farmers 'important source of income, food and draft power for crop cultivation in Ethiopian agriculture. Hence, a household with large livestock holding can have good access for more draft to take its product market. Like many other similar studies, it was measured in terms of Tropical Livestock Units (TLU). Livestock ownership is hypothesized to be positively related to the adoption of agricultural technologies because it serves as a proxy for wealth status (Freeman et al, 1996; Chilotet al, 1996; van Den Ban and Hawkins, 1996; Asfewet al, 1997; Habtemariam, 2004).
Number of oxen: it is continuous variable and measured in number. It is expected to have positive relationship with the use of irrigation water. Oxen provide manure and draught power to crop cultivation, therefore used to boost crop production. Teressa and Heidhues (1996) reported that adoption of improved technology is positively influenced by oxen ownership .Particularly more oxen owner has more probability to use irrigation and ploughing more land on time. As a result, it is expected that number of oxen owned and use of irrigation are positively related. Therefore having more oxen number increases their access to use irrigation water.
Use of credit: it is a dummy variable, which takes a value of 1 if the farm household had access to credit and 0 otherwise. Access to credit is an important source of investment. Those households who have access to credit have a better possibility of getting farm inputs. Therefore, it is hypothesized that access to credit determines farmers’ decision to participate in small scale irrigation and income positively. According to Norton et al. (1970), credit helps farmers purchase inputs such as seeds, fertilizers and chemicals and others.Also Previous research result reported by (Tesfaye and Alemu, 2001) confirmed that access to credit positively influence adoption of technology.
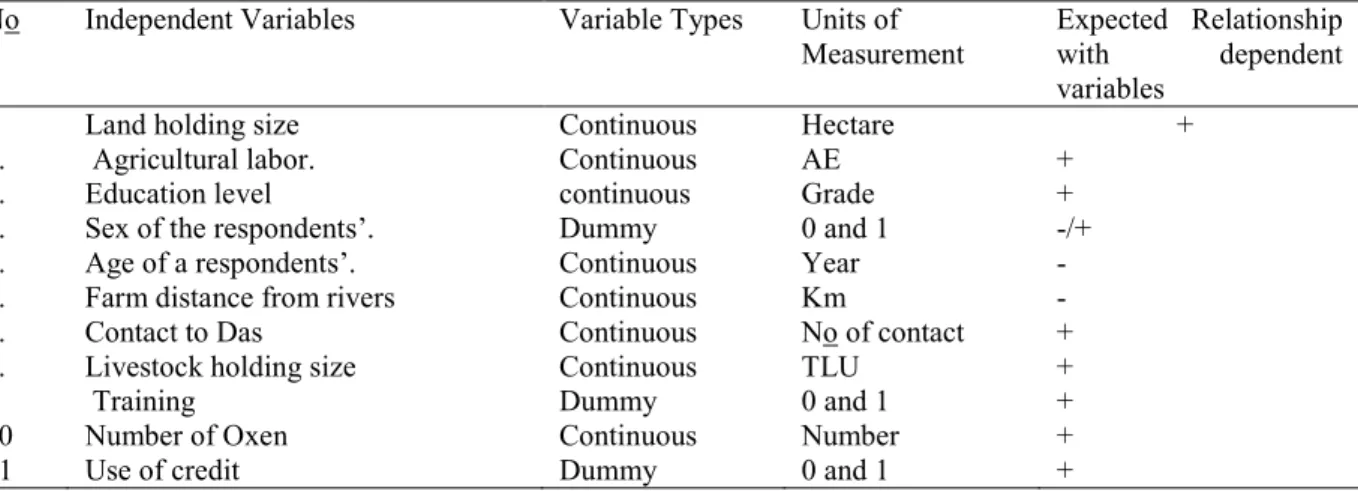
Table 2: The summary of independent variables, description their measurements and expected relationship with dependent variable:
No Independent Variables Variable Types Units of
Measurement Expected Relationship with dependent variables
1 Land holding size Continuous Hectare +
2. Agricultural labor. Continuous AE +
3. Education level continuous Grade +
4. Sex of the respondents’. Dummy 0 and 1 -/+
5. Age of a respondents’. Continuous Year -
6. Farm distance from rivers Continuous Km -
7. Contact to Das Continuous No of contact +
8. Livestock holding size Continuous TLU +
9 Training Dummy 0 and 1 +
10 Number of Oxen Continuous Number +
11 Use of credit Dummy 0 and 1 +
1.9. Multi-Co linearity Diagnosis
It was important to running the logistic regression model; both the continuous and dummy explanatory variables were checked for the existence of multi-co linearity problem. The problem arises when at least one of the independent variables is a linear combination of the others. The existence of multi-co linearity might cause the estimated regression coefficients to have the wrong signs and smaller T-ratios that might lead to wrong conclusion.
According to Gujarati (2004) has suggested that the two techniques are conducted to test the existence of linearity problem. Variance inflation factor (VIF) was employed to detect the problem of multi-co-linearity among the continuous variables. VIF can be defined as:
VIF(X = Where:
Ri2 is the square of multiple correlation coefficients that results when one explanatory variable (Xi) is regressed against all other explanatory variables. The larger the value of VIF (Xi) the more “troublesome” or collinear the variable Xi is. As a rule of thumb, if the VIF of a variable exceeds 10, there is a multi-co-linearity problem. Likewise to test multi-co linearity problem of dummy variables, correlation command was applied and the correlation coefficients were used to test the correlation between the variables. When the value of the correlation coefficient >0.8, there is a multi-co-linearity problem.
CHAPTER FOUR
4.1 RESULT AND DISCUSSION
objectives of the study. The section also describes four core points. This includes the status of irrigation practices; descriptive and inferential statistics results of explanatory variables; interpretation and discussions of model results; discussions on cropping livestock practices and annual gross farm income.
4.1.1 The Farmers’ Status on Irrigation Practices in the Study Area
A Small-Scale Irrigation practice in the Woreda has a recent history. However, the information gathered from FGD participants revealed that “in the area the Small-Scale Irrigation practices begun a decade ago. During previous period, small holder farmers had been used irrigation water to produce only field crops especially Maize, Tef , Taro , surgum and Sweet Potato. Now a day, the Small-Scale Irrigation practices in the area dramatically expanded and the farmers’ cropping practices also changed from depending on production of field crops in to mostly depending on production of vegetables especially cabbage, tomato and pepper. The expansions of Small-Scale Irrigation practice also increase farmers’ cropping frequencies; use of other farm inputs (improved seeds and chemical fertilizer) and also increased farm productivity.”
4.1.2. Small-Scale Irrigation Performance of the Woreda
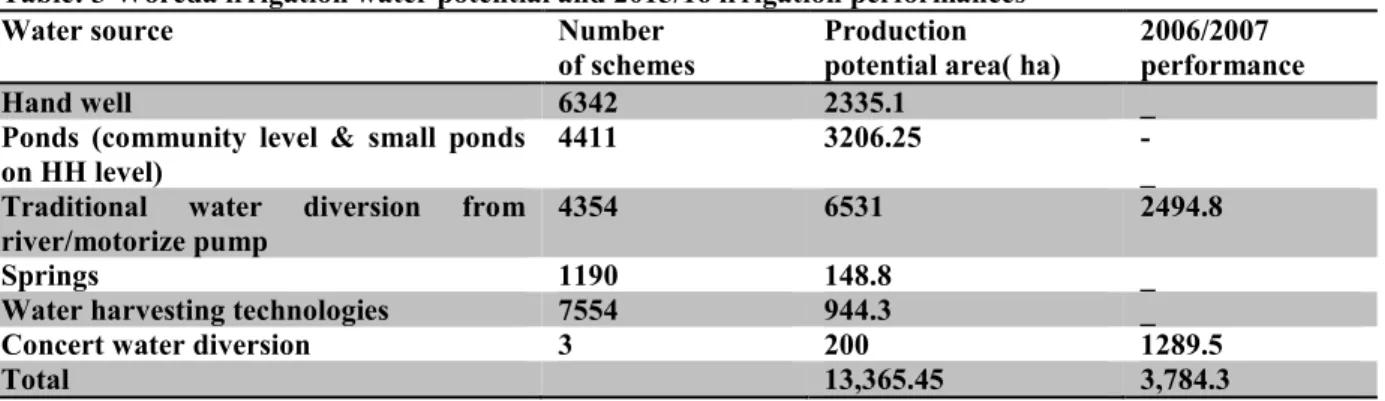
The study area has a great potential for small-scale irrigation. Information gathered from Woreda farm and natural resource office and water development office hs been shown in the table below:
Table: 3 Woreda irrigation water potential and 2015/16 irrigation performances
Water source Number
of schemes Production potential area( ha) 2006/2007 performance
Hand well 6342 2335.1 _
Ponds (community level & small ponds
on HH level) 4411 3206.25 - _
Traditional water diversion from river/motorize pump
4354 6531 2494.8
Springs 1190 148.8 _
Water harvesting technologies 7554 944.3 _
Concert water diversion 3 200 1289.5
Total 13,365.45 3,784.3
Source: data from zone , 2017.
However, since 2014 there are 3,784.3 hectares of land was covered with irrigation (irrigated) and 582,782 Quintal of production had benefited 15,137 Households. This is because of most of schemes are not functional ; due to problem of farmers attitude especially on water harvesting technology very low due to forced apply of the previous decades and less attention is given from some stockholders. So, irrigation user farmers uses water only from river by three water diversion methods such as concrete water diversion from river ,traditional water diversion from river and using motorized pumps water diversion from river.
4.1.3. Sources of Irrigation Water for Irrigation Users’ Household
The results in Table 4 show that from the total irrigation user respondents’ households (3.8%) have used their irrigation water from springs whereas (96.2%) have used their irrigation water from rivers. This result also shows that there were other sources of water for irrigation practice was poor and most of irrigation user respondents’ household depends up on rivers to irrigate their farm. Additional information gathered from FGD participants revealed that, “in the area, rivers are a common resource and major source of irrigation water. However, in the study area the irrigation water especially in rainy season is available and accessible for all irrigation user farmers. But during dry season the volume of irrigation water from the rivers decrease and that farm land located far from these sources have less access to use irrigation water when compared with that farm land located nearest to the rivers”
Table 4 sources of water
Sources of water N %
Springs 3 3.8
Rivers 76 96.2
Source: own field survey,2017.
4.1.4. Irrigation Water Diversion and Lifting Mechanisms in the Study Area
Farmers in the study area use irrigation water through diverting from Rivers and lifting from other sources through different types of water diverting and lifting mechanisms. The results in Table 5 below show that out of the total irrigation user respondents (3.8%) divert irrigation water through traditional diversion mechanism, (60.8%) divert irrigation water through concrete canal river diversion mechanism and the remaining (35.4%) lift irrigation water through used Motorized Water Pump. This result also revealed that from the total irrigation user respondents’ household (35.4%) use improved irrigation technology (Motorized Water Pump) to lift water from rivers and other sources. This improved irrigation technology, creates them access to use irrigation water from different sources. When there is difficult to divert water through gravity force from irrigation water sources and a
farm located at sloppy area, through using Motorized Water Pump farmers lift water from those sources and apply on their farm.
Table 5. Water diversion and lifting methods Water diversion and lifting
methods N %
Traditional diversion 3 3.8
Concrete canal river diversion 48 60.8
Lifting through motorized water
pump 28 35.4
Source: own field survey, 2017
According to information gathered from FGD participants revealed that, “in the Kebeles irrigation users apply irrigation water through furrow irrigation method for crops which are planted in row system like: Maize, Root crops and Vegetables are appropriate for furrow irrigation method. On the other hand, Crops like Teff, farmers had sow in the broadcasting system. So farmers apply water for Tef through using flood irrigation method and also fruit crops like: Mango and avocado were appropriate for basin irrigation method.”
4.1.5. Irrigation Water Management Practices in the Study Area
The information gathered from FGD participants revealed that, “Rivers are a common resource and major source of irrigation water for irrigation users. These common resources are managed in the Kebeles by the Irrigation Water Users’ Committees. The roles of irrigation water users’ committees are: distributing the irrigation water for users through scheduled manner and monitor it and mobilizing irrigation water user members to cleaning the existing irrigation canals.
On the other hand, the influential persons have use irrigation water disorderly, on the night time out of the command area farmers used by seep age and over using from main canals. However, the responsibility for running management of the irrigation systems was delegated to water uses committees in the hope of enhancing effectiveness, equity and responsiveness in irrigation management and to ensure sustainability of the practices. Nonetheless, they were not organized in such a way they cannot ensure these objectives of decentralized management, although good organization is one of the social requirements for good irrigation governance. They have deficiencies in their management structures. They have no recognized legal power, responsibilities and authorities of the different positions along the management structure are not clearly defined and even it is totally missing from the by-laws of the water users association in the study area. The committee lacks transparent and accountability to users. Constituencies (water users) accuse committee members for power abuse, selfishness, lack of commitment, and for not observing the internal bylaws. Consequently, case drying of crops, conflicts among users living far from the head decided to exclude them from irrigation user membership. On the other hand, loss of water through seepage: this is caused by non-durability of the physical structure of diversion canals. Some users involuntary to clean irrigation canal and they give cleaning for productive safety net program beneficiaries.”
4.1.6. Constraints that Affect the Use of Irrigation Water in the Study Area
The information gathered from FGD participants revealed that, “in the study area both irrigation users and non-users’ household live within the Kebele have equal right to adopt irrigation technology like to adoption of any other agricultural technologies. However, there are different factors that constrained farmers’ access to use of irrigation water. The finding indicates that factors such as: have no irrigable land, distance from irrigation water sources and shortage of family labor”. Discussed below:
First, they have no irrigable land: This is related with those farmers’ farm lands are located at sloppy towards irrigation water sources and main irrigation canals. These farm lands are difficult to apply water through gravity force except using other water lifting mechanisms and improved irrigation technologies. However, due to high purchasing costs, maintenance cost, fuel cost, cost of spare parts and those cost of motorized water pump, it was not affordable by most farmers in the area.
Second, distance from irrigation water sources: Farmers’ farm lands are even if irrigable or potential area, due to far distance from water sources they didn’t use irrigation water. Because of it needs high amount of financial, time and labor cost to construct sub-canals and to apply irrigation water on their farm. This distance also adversely affects the volume of irrigation water due to high infiltration in to the soil on the way of flowing through the canals. This is the special case during dry season.
Third, shortage of family labor: This is common for women headed households and other households who have small size of agricultural labor force. This constraint also linked with distance from water sources and main irrigation canals. Because of when distance increases from the irrigation water sources and main irrigation canals needs high amount labor to use irrigation water.
4.2. Descriptive Statistics Result of Independent Variables
understand the various characteristics among the study households. Such analysis is essential to ensure an understanding of the context in which results were obtained.
4.2.1. Sex of Respondents
The results presented in Table 6 show that from the total respondents 86.4% were males and 13.6% were females. However, out of the total irrigation user respondents (91.1%) were males and (8.9%) were females. From the total non-user respondents (76.9%) were males and (23.1%) were females. The proportion of males in the case of irrigation user respondents was more than that of irrigation non-user respondents. The Chi-square value below shows that, at 5% significant level, sex of respondents’ had significant relationship with the use of irrigation water. This significance relationship shows that when the variation in sex between two groups has its own implications on the use of irrigation. Therefore, male farmers have better chance to use of irrigation water. Table 6: Sex of respondents
Sex of
respondents’.
User Non-user Total Chi-square value
N % N % N %
Female 7 8.9 9 23.1 16 13.6
Male 72 91.1 30 76.9 102 86.4 4.502**
Source: Own field survey 2017. P-value = 0.046 **, Significant at 5% level. 4.2.2. Age of Respondents
The results in Table 7 show that from the total respondents 66.9% were aged ranges from 20-40 years old. But out of the total irrigation user respondents (69.6%) were aged ranges from 20-40 years old while from the total non-user (61.5%) were aged ranges from 20-40 years old. The mean age of total respondents was 38.55. However, the mean age of irrigation user respondents’ was 38.31years old and non-user respondents’ was 39.05 years old. The t-value shows that the mean age of the two groups were not significantly different at 10% level. Table 7: Age of respondents’
Age of Respondents’. User Non-user Total
N % N % N % 20 – 40 55 69.6 24 61.5 79 66.9 41 – 60 23 29.1 13 33.3 36 30.5 61 – 80 1 1.3 2 5.1 3 2.5 Mean 38.31 39.05 38.55 SD 9.36 10.85 9.84 t-value -0.38
Source: Own field survey of 2017. P-value = 0.705 4.2.3. Education Level of Respondents’
The results in Table 8 show that out of the total respondents 24.6% did attended primary education whereas 38.1% didn’t attended. However, out of the total user respondents (41.8%) did attended secondary education while out of the total irrigation non-user respondents (28.2%) did not attended secondary education. The t- value shows that there was significant mean variation in education level of two groups at 1% significant level. This significance variation shows that the variation in the education level of farmers between two groups has its own implications on the utilization of irrigation water. Therefore, better educated farmers have better chance to use irrigation.
Table 8. Education level of respondents’
Education Level User Non-user Total
N % N % N % Not attended 22 27.8 23 59 45 38.1 1-8 24 30.4 5 12.8 28 24.6 9-12 33 41.8 11 28.2 44 37.3 Mean 4.77 3.39 2.56 3.41 4.04 3.54 SD t-value 3.32***
Source: Own field survey of 2017. P-value =0.001 ***, Significant at 1% level. 4.2.4. Land holding Size
The result in Table 9 reveals that from the total respondents 52.5% have land holding size >0.5 hectare. However, 35.4% of irrigation user respondents have land holding size >0.5 hectare while 87.2% of non-user respondents have land holding size >0.5 hectare. The mean land holding size of total respondents was 0.58 hectare. But irrigation user respondents’ was 0.68 hectares and that of non-user respondents’ was 0.36 hectares. The t-value shows that there was significant mean difference of the land holding size between irrigation user and non-user respondents’ household at 1% significance level. This significance mean variation shows that the variation in the land holding size between two groups has its own implications on the utilization of irrigation water. Therefore,
better land holder farmers have better chance to use irrigation. Table 9: Land holding size of respondents’ household.
Land size User Non-user Total
N % N % N % ≤0.5 28 35.4 34 87.2 62 52.5 0.51-1 45 57 5 12.8 50 42.4 1.1-1.5 6 7.6 - - 6 5.1 Mean 0.68 0.36 0.58 SD 0.34 0.26 0.35 t-value 5.17***
Source: Own field survey of 2017. P-value = 0.000 ***, Significant at 1% level. 4.2.5. Household Labor
The results in Table 10 show that from the total respondent house holds(64.4%) have labor force between 2.1-4 adults equivalent. However, more than half (64.6%) of irrigation user respondents ’household had labor between 2.1-4 adults equivalent while (64.1%) of non-user respondents’ household labor between 2.1-4adults equivalent. While, the mean of user respondents’ household labor was equal to 3.22adults equivalent and that of non-user respondents’ household was equal to 2.4adults’ equivalent. The t-value shows that at 1% significance level, there was significant mean difference in labor between user and non-user respondents’ household. This significance mean variation shows that the variation in household labor between two groups has its own implications on the utilization of irrigation water. Therefore, farmers who have larger agricultural labor size have better chance to use irrigation.
Table 10: household labor in adult equivalent
Labor User Non-user Total
N % N % N % 0-2 11 13.9 14 35.9 25 21.2 2.1 –4 51 64.6 25 64.1 76 64.4 >4 17 21.5 - - 17 14.4 Mean 3.22 2.4 2.29 SD 1.48 0.49 1.29 t-value 3.34***
Source: Own field survey of 2017. P-value = 0.001 ***, Significant at 1% level. 4.2.6. Farm Distance from Rivers
The results in Table 11 show that out of the total respondents household50.8% have farm distance from rivers is <0.5Km. However, out of the total user respondents (74.7%) have farm distance from rivers is <0.5Km while from the total non-user respondents (64.1%) have farm distance from rivers is >1.5Km. The mean of user respondents’ farm distance from rivers is 0.45Km and the mean of non-user respondents’ farm distance from rivers is 1.94Km. The t-value shows that, at 1% significance level there was significant difference in mean farm distance from river between user and non-user household. This significance mean variation shows that the variation in distance from river between two groups has its own implications on the utilization of irrigation water. Therefore, farmers’ farms near to the river have better chance to use irrigation.
Table 11: Respondents’ household farm distance from Rivers.
Farm Distance User Non-user Total
N % N % N % <0.5 59 74.7 1 2.6 60 50.8 0.51-1 19 24.1 10 25.6 29 24.6 1.1-1.5 - - 3 7.7 3 2.5 >1.5 1 1.3 25 64.1 26 22 Mean 0.45 1.94 0.94 SD 0.27 0.89 0.89 t-value -13.66***
Source: Own field survey of 2017. P-value = 0.000 ***, Significant at 1% level. 4.2.7. Livestock Holding
The survey results obtained from respondents’ household in Table 12 show that the majority (72%) of total respondents had hold livestock between 3.1-6TLU. Out of the total irrigation user respondents’ household (69.6%) had hold livestock between 3.1-6TLU while (76.9%) of non-user respondents’ household had hold livestock between 3.1-6TLU. The irrigation user respondents’ household mean livestock holding in TLU 3.8 and that of non-user respondents’ household mean livestock holding in TLU is 3.69. The t-value shows that, there was no significant mean difference of livestock holding in TLU between user and non-user.
Table 12: Number of livestock holding in TLU by the respondents’ household.
Livestock Holding User Non-user Total
N % N % N % <3 4 5.1 - - 4 3.4 3.1-6 55 69.6 30 76.9 85 72 >6 20 25.3 9 23.1 29 24.6 Mean 3.8 3.69 3.77 SD 1.67 1.67 1.67 t-value 0.32
Source: Own field survey of 2017. P-value = 0.747 4.2.10. Use of Credit
The survey results in Table 15 show that in 2016/17 out of the total respondents 71.2% did used credit. However, out of the total irrigation user respondents (79.7%) and from the total non-user respondents (53.8%) did use credit last year. The Chi-square value shows that there was significant relationship between the use of credit and irrigation water use at 1% significance level. This significance relationship shows that the variation in the credit use between two groups has its own implications on the utilization of irrigation water. Therefore, more credit used farmers have better chance to use irrigation.
Table 15: Use of credit by the respondents’ household in 2016/17.
Use of credit User Non-user Total Chi-square value
N % N % N %
No 16 20.3 18 46.2 34 28.8
Yes 63 79.7 21 53.8 84 71.2 8.54***
Source: Own field survey 2017. P-value = 0.005 ***, Significant at 1% level. 4.2.13. Factors that Affect the Use of Irrigation water in the Study Area
In the binary logit model result, the maximum likelihood estimates reveals that the use of irrigation water was affected by the interaction of different factors: demographic, socio-economic and physical.
To test the measure of goodness of fit in logistic regression analysis, the likelihood ratio test (LR) that says chi-square distribution with degree of freedom (DF) equal to number of independent variables included in the model (Gujarat, 2004); consequently, the chi-square computed indicated, as the model was significant at 1% significance level.
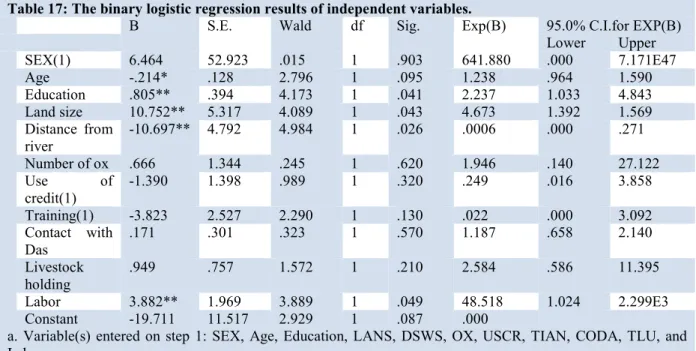
The other measure of goodness-of-fit in the logistic regression model is by observing the value in the prediction table as the model correctly predicted it or not. The fit is said to be good if the overall correct prediction rate exceeds 50% (Callet, 1991 as cited in Abebaw, 2003). Accordingly, the prediction table shows that correctly predicted irrigation user was 98.7% whereas correctly predicted irrigation non-user was 93.3%. However, the overall prediction was 96.6%. The model results in Table 17 shows that, among the 11 independent variables included in the model, five variables were significantly affects the use of irrigation water. Briefly discussed below:
Age of respondent: had significant negative effect on the use of irrigation water at 10% significance level. The odds ratio disfavors the use of irrigation by a factor of 1.238 for the respondents’ age increased by 1 year. Therefore, a farmer who was large age group has less chance to use irrigation water. Because of the elders have less interest to adopt improved irrigation technologies and also irrigation practices need high physical labor. However, the elders are physically weak and access to use irrigation water also decreases. In agreement with this finding, Morris et al., (2000) have reported that, age is one of the factors that determine decision making of a person. Advanced aged household heads are more reluctant to accept new technology than younger household heads. Even after controlling for key confounding variables identified in prior organizational behavior research i.e., income, occupation, and education levels, compared to older workers, younger workers' technology usage decisions were more strongly influenced by attitude toward using the technology.
Household labor: had significant positive effect on the use of irrigation water at 5% significance level. The odds ratio favors the use of irrigation by a factor of 48.5 for the respondents’ household labor force increased by 1 adult equivalent. Therefore, the respondents’ household who has large labor size has better chance to use irrigation water. The information gathered from FGD participants revealed that, “in the study area, irrigation is labor intensive practice and it needs high labor for construction of canals, diversion of water from rives and application of water on the farm.”
Education level: had significant positive effects on the use of irrigation water at 5% significance level. The odds ratio favors the use of irrigation by a factor of 2.237 when the education level of respondent increased by 1 grade. Therefore, educated respondents have more chance to use irrigation water. The result obtained from key informants interview revealed that in the study area the educated farmers easily understood the operation and adopt improve irrigation technologies which is increase their access to use of irrigation water through lifting with
irrigation technologies (motorized water pump) from the sources even if their farm is not accessible to irrigate through gravity force. In agreement with this finding, Riddell, et al., (2012) have reported in their study that highly educated workers tend to adopt new technologies faster than those with less education workers.
Farm distance from the rivers: had significant negative effect on the use of irrigation water at 5% significance level. The odds ratio disfavors the use of irrigation by a factor of 0.0006 for the respondents’ farm distance from Rivers increased by 1 Km.Therefore, the respondents’ household farm located far from the rivers has less chance to use irrigation water and vice versa. Because, in the study area the major water source for irrigation is rivers. When the farm distance far from main irrigation canals which was constructed from the rivers, it needs high labor, financial and time costs to construct sub-canals towards individual farm and minimize the chances to use irrigation water.
Land holding size: had significant positive effect on the use of irrigation water at 5% significant level. The odds ratio favors the use of irrigation by a factor of 4.673 for the farmers’ farm land increased by 1hectar.Therefore, for the better land holder respondents’ household have more chance to use irrigation water.
Table 17: The binary logistic regression results of independent variables.
B S.E. Wald df Sig. Exp(B) 95.0% C.I.for EXP(B)
Lower Upper SEX(1) 6.464 52.923 .015 1 .903 641.880 .000 7.171E47 Age -.214* .128 2.796 1 .095 1.238 .964 1.590 Education .805** .394 4.173 1 .041 2.237 1.033 4.843 Land size 10.752** 5.317 4.089 1 .043 4.673 1.392 1.569 Distance from river -10.697** 4.792 4.984 1 .026 .0006 .000 .271 Number of ox .666 1.344 .245 1 .620 1.946 .140 27.122 Use of credit(1) -1.390 1.398 .989 1 .320 .249 .016 3.858 Training(1) -3.823 2.527 2.290 1 .130 .022 .000 3.092 Contact with Das .171 .301 .323 1 .570 1.187 .658 2.140 Livestock holding .949 .757 1.572 1 .210 2.584 .586 11.395 Labor 3.882** 1.969 3.889 1 .049 48.518 1.024 2.299E3 Constant -19.711 11.517 2.929 1 .087 .000
a. Variable(s) entered on step 1: SEX, Age, Education, LANS, DSWS, OX, USCR, TIAN, CODA, TLU, and Labor.
*, And ** represent significant at 10% and 5% level respectively. Source: Computed from field survey data, 2017.
4.3 Role of small scale irrigation 4.3.1 Crop production
The results obtained from key informant interview and respondents’ household revealed that in the area farmers engaged in both rain feed and rain feed + irrigated agriculture and grown different types of annual and perennial crops. The major crops grown by using small-scale irrigation schemes in the study areas are: Maize, Teff, Root crops and dominant vegetables (Pepper, Cabbage and Tomato).
4.3.2. Cropping Frequency of the Respondents’ Household
The results in Table 18 show that out of the total respondents’ household 53.5% have been grown two times annual crops (Maize, Tef, Vegetables and Root Crops) and harvesting more than twice from perennial crops (Mango and Avocado) per year. However, from the total irrigation user respondents’ household (79.7%) have
been grown two times annual crops (Maize, Tef, Vegetables and Root Crops) and harvesting more than twice
from perennial crops (Mango and Avocado) per year and (12.7%) of irrigation user respondents’ household and (43.6) irrigation non user have been grown two times annual crop per year from the same farm. On the other side, more than half (56.4%) of irrigation non-user respondents’ household have been grown only one time annual crops (Maize, Tef, Vegetables and Root Crops)per year from the same farm.
Additionally, this result also shows that, the respondent farmers’ engagement in growing of perennial crops mostly depends up on access to use of irrigation water.
Table 18: Cropping frequency (growing and harvesting) from the same farm per year.
Growing and harvesting frequency User Non user Total
N % N % N %
Only one time annual crops. 6 7.6 22 56.4 28 23.7
Two times annual crops. 10 12.7 17 43.6 27 22.8
Two times annual crops and perennial crops more. 63 79.7 - - 63 53.5
Source: Own field survey, 2017.
Additionally, the results obtained from key informant interview revealed that, most of irrigation non-use farmers live in the sample Kebeles have refused and hesitated to use of improved seeds and chemical fertilizer due to lack of access to use of irrigation water. However, the use of improved seeds and chemical fertilizer are crucial to improve the farm productivity and then maximize total farm production. Therefore, the use of irrigation increases the farmers’ interest to use improved seeds and chemical fertilizer as well as improve the farm productivity and then maximize total farm production. In agreement with this finding, Nhundu et al. (2010) have reported that use of irrigation water supplements moisture, which enables farmers to maximize agricultural production and improves gross farm income of a household.
4.4. The Role of Irrigation for Livestock Production
Information gathered from key informant revealed that in the Woreda farmers practicing mixed farming system (growing of crops and rearing of livestock). Under the livestock production farmers practicing fatting of cattle especially oxen in addition to use it for tiling of their farm and supply for the local markets. Especially, farmers live in the dry area highly depend up on irrigation water and it playing the crucial role on rearing of livestock in addition to crop production. The practical reason behind this is irrigation water uses for watering livestock and production of fodder crops. In agreement with this finding, Berhanu and Peden (2000), in mixed crop-livestock system the opportunity that irrigation provides is not only enabling intensified crop production, but also increase animal feed through increased crop residues of food-feed crops, which may reduce the pressure on grazing lands. If farmers well manage and utilize fodder that can be grown by the use of irrigation, livestock productivity can increase hence household income can be increased.
Obviously, livestock production is one of the very important aspects of income generation for households in both irrigation systems. They are closely integrated with the range of purposes such as direct production, draught power, transport, and manure production to sustain soil fertility and as a store of wealth.
4.5. Farm Income
4.5.1. Annual Gross Income Obtained from crop production in 2016/17.
The results in Table 19 show that out of the total respondents household (48.3%) had obtained annual gross income from crop production between 1000-10,000birr.However, irrigation user respondents’ household (24.1%) had obtained annual gross income from crop production >30,000birr while out of the total irrigation non-user respondents’ household (84.6%) had obtained annual gross income from crop production between 1000-10,000birr. The mean annual gross income obtained from crop production by irrigation user and non-user respondents’ household was 20719 and 3455.6 respectively.
The t-value also shows that at 1% significance level, the mean of annual gross income obtained from crop production by irrigation user respondents’ household was significantly differs and better from that was obtained by irrigation non-user respondents’ household. As a result, the irrigation user respondents’ household obtained excess of 17263.85 birr of mean annual gross income from crop production that was obtained by irrigation non-user respondents’ household.
Table 19: Annual gross income obtained from crop production by the respondents’ household in 2016/17.
Income User Non-user Total
N % N % N % <1000 1 1.3 6 15.4 7 5.9 1000 – 10000 24 30.4 33 84.6 57 48.3 10001 – 20000 22 27.8 - - 22 18.6 20001 – 30000 13 16.5 - - 13 11 >30000 19 24.1 - - 19 16.1 Mean 20719 3455.6 15014 SD 15811 1870 15307 t- value 6.78***
Source: Own field survey, 2017. P-value = 0.000 ***, Significant at 1% level. 4.5.2. Annual Gross Income Obtained from livestock production in 2016/17.
income from livestock production<1000birr.However, irrigation user respondents’ household (94.9%) had obtained annual gross income from livestock production<1000birr while out of the total irrigation non-user respondents’ household (89.7%) had obtained annual gross income from livestock production<1000birr. The mean annual gross income obtained by irrigation user and non-user respondents’ household was 297.47 and 493.3 respectively.
Income User Non-user Total
Table 20: Annual gross livestock income obtained by the respondents’ household in 2016/17.
N % N % N % <1000 75 94.9 35 89.7 110 93.2 1000 – 10000 4 5.1 4 10.3 8 6.8 10001 – 20000 - - - 20001 – 30000 - - - - >30000 - - - - Mean 297.47 493.3 15376 SD 135.9 154.5 15211 t- value -0.703
Source: Own field survey, 2017. P-value = 0.483
4.5.1. Annual Gross Farm Income Obtained by the Respondents’ Household
The results in Table 21 show that out of the total respondents household (44.9%) had obtained annual gross farm income between 1000-10,000birr.However, irrigation user respondents’ household (32.9%) had obtained annual gross farm income between 10001-20,000 birr while out of the total irrigation non-user respondents’ household (84.6%) had obtained annual gross farm income between 1000-10,000birr. The mean annual gross farm income obtained by irrigation user and non-user respondents’ household was 21017 and 3949 respectively. The t-value also shows that at 1% significance level, the mean of annual gross farm income obtained by irrigation user respondents’ household was significantly differs and better than that was obtained by irrigation non-user respondents’ household. As a result, the irrigation user respondents’ household obtained excess of 17067.98 birr of mean annual gross farm income that was obtained by irrigation non-user respondents’ household. In agreement with this finding, the study conducted by Ayele et al (2013) at Lake Tana basin has reported that access to irrigation has a significant positive role on the mean income of a household (3353birr per year) a 27% increase over the mean income for non-irrigating households and Kinfe (2012) at Central Tigray has also reported that irrigation user households with one hectare irrigable land are better-off in well-being by 23,327.8birr than non-user households.
Table 21: Annual gross income obtained by the respondents’ household in 2016/17.
Income User Non-user Total
N % N % N % <1000 1 1.3 5 11.4 6 5.1 1000 – 10000 20 25.3 33 84.1 53 44.9 10001 – 20000 26 32.9 1 4.5 27 22.9 20001 – 30000 13 16.5 - - 14 11 >30000 19 24.1 - - 19 16.1 Mean 21017 3949 15376 SD 1766 2470 15211 t- value 6.73***
Source: Own field survey, 2017. P-value = 0.000 ***, Significant at 1% level.
In the study area, irrigation user respondents’ household has grown annual crops two times and harvesting perennial crops more than twice from the same farm per year. The use of irrigation increases the farmers’ interest to use improved seeds and chemical. The use of improved seeds and chemical fertilizer are crucial to improve the farm productivity and then maximize total farm production. Therefore, these are its own implication on the mean annual incomes obtained from crop production. Consequently, these implications show that, the use of irrigation water might be made the significant difference on the mean annual gross farm income between irrigation user and non-user respondents’ household.
CHAPTER FIVE
5. CONCLUSION AND RECOMMENDATION 5.1. Conclusions
In the study area one of main constraints for irrigation non-user respondents’ household was distance from rivers. These factors had significant negative effect on the use of irrigation water at 5% significant level. The major sources of irrigation water in the study area are rivers. The availability of water from rivers is decreases during
dry season so it was not reliable even for irrigation users’ farm that located far distance from the rivers. Moreover, in the study area there is an opportunity to use Shallow Wale due to favorable agro-ecological location.
Some farmers in the study area have used Motorized Water Pumps for irrigation purposes and it creates access to them to use irrigation water through lifting from water sources even if their farms are not accessible to irrigate through gravity force. However, the access to use such equipment is limited due to high purchasing, maintenance, fuel and house cost.
The Committees and DAs have high responsibility to manage irrigation water used from rivers. However, these committees have not function their responsibilities properly. Therefore, it was negatively affects the fair distribution of irrigation water for the users in sample Kebele.
5.2. Recommendation
Small-scale irrigation is important development effort to ensure farm income if properly implemented. Based on the empirical findings the following recommendations are forwarded.
Distance from rivers had significantly negative effect on the use of irrigation water at 5% significance level and the major sources of irrigation water in the study area are rivers. Therefore, in addition to river water it should be better to initiate farmers to develop and use springs at community level and shallow wale at household level. It is likely to be valuable for future irrigation development.
Education level had significant positive effect on the use of irrigation water. Therefore, governmental and non-governmental organizations should give emphasis on the adult education for farmers and that improves farmers’ awareness about adoption of technologies and increases their access to use irrigation water in the study area.
Household labor had significant positive effect on the use of irrigation water. Therefore, governmental and non-governmental organizations should give emphasis on provision of credit for farmers and that improves their financial capital to purchase improved irrigation technologies like motorized water pump and hire labor and that fill the gap of family labor shortage. Consequently, creates an opportunity to shift non-users to use irrigation water in the study area.
Expanding the capacity of the micro irrigation users and creating additional access through integrated water investment is important to increase agricultural income and hence leads to improve household’s welfare. The policy and strategy should help the households to increase production and productivity which in turn leads to increase their total annual income through organizing the farmers and providing training on income generating activities.
REFERENCES
Abebaw,S., 2003. Dimension and determinants of food insecurity among rural households in Dire Dawa area, Eastern Ethiopia. Unpublished master’s thesis, School ofGraduate Studies, Alemaya University.
Abonesh T, Ayalneh B, Dereje B, Regassa N (2006). Impact of small- scale irrigation on households‟ food security: Evidence from Godino and Filtino irrigation schemes in Ada Liven district, Ethiop. J. Irrig. Drain. Syst. 22:145-158
Asayehegn, K.,(2012). Negative impact of small-scale irrigation schemes: A case study of Central Tigray regional state, Ethiopia. Agricultural Research and Reviews Vol. 1(3).
Awulachew SB, Merrey DJ, Kamara AB, Van Koppen B, Boelee E, Makombe G (2005) Experiences and opportunities for promoting small-scale/micro irrigation and rainwater harvesting for food security in Ethiopia. Colombo, Sri Lanka: IWMI. Working paper no. 98:86.
Awulachew SB, Yilma A, Loulseged D, Loiskandl W, Ayana M, Alamirew T, (2007). Water Resources and Irrigation Development in Ethiopia. Colombo, Sri Lanka: International Water Management Institute. pp. 78 Ayele, G. K., Nicholson, C.F., Collick, A. S., Tilahun, S. A. and Steenhuis, T.S. 2013. Impact of small-scale
irrigation schemes on household income and the likelihood of poverty in the Lake Tana basin of Ethiopia: In Wolde Mekuria. (ed). Rainwater management for resilient livelihoods in Ethiopia: Proceedings of the Nile Basin Development Challenge science meeting, Addis Ababa, 9–10 July 2013. Technical Report 5. International Livestock Research Institute. Nairobi, Kenya: 17-18.
Bacha D, Regasa N, Ayalneh B, Abonesh T (2011). Impact of Small-Scale Irrigation on Household Poverty: Empirical Evidence from the Ambo District In Ethiopia. Irrigation and Drainage. 60: 1–10.
Bhattarai M, Sakthivadivel R, Hussein I (2002). Irrigation impacts on income inequality and poverty alleviation: Policy issues and options for improved management of irrigation systems. Colombo, Sri Lanka: International Water Management Institute (IWMI) Working Paper No.39.
Mekelle.CSA (2012).Agricultural Sample Survey for Strategic Planning: Annual Report Federal Democratic Republic of Ethiopia Central Statistical Authority of Ethiopia: Annual Report, Addis Ababa, Ethiopia. http://www.csa.gov.et
CSA (2012).Agricultural Sample Survey for Strategic Planning: Annual Report Federal Democratic Republic of Ethiopia Central Statistical Authority of Ethiopia: Annual Institute, Research Inspired Policy and Practice Learning in Ethiopia and the Nile Region (Ripple), Working Paper 14, Ethiopia.
C.R. Kothari. 2004. Research Methodology, Methods and Techniques. 2nded. New Age International: University
of Rajasthan, Jaipur.418pp.
Desta F. 2004. Impact of Community Managed Irrigation on Farm Production Efficiency and Household Income. M.Sc. Thesis. Alemaya University, Ethiopia: 61PP.
Dhawan, B. D. (1988). Irrigation in India‘s Agricultural Development: Productivity, Stability, Equity. New Delhi, India: Sage Publications India.
Eshetu, S., Belete, B., Goshu, D., Kassa, B., Tamiru, D., Worku, E., Lema, Z., Delelegn,A., Tucker, J. and Abebe, Z. (2010). Income Diversification through Improved Irrigation in Ethiopia: Impacts, Constraints and rospects for Poverty Reduction. Evidence from
FAO, (2001). The state sof food and agriculture. World Review Part I. Rome. Italy. 18-20p. G. Rodrguez. (2007). Logit Models for Binary Data. [Internet
Gujarati, D. N. 2004. Basic Econometrics. 4thed. the McGraw-HillBook Co., New York. 1003pp.
Hagos F, Makombe G, Namara RE, Awulachew SB (2009). Importance of irrigated agriculture to the Ethiopian economy: Capturing the direct net benefits of irrigation. Colombo, Sri Lanka: International Water Management Institute. 37p. (IWMI Research Report 128).
Haile, T., (2008).Impact of irrigation development on poverty reduction in Northern Ethiopia.PhD thesis, National University of Ireland, Cork.
Hussain, I. and Hanjra, MA., (2004). Irrigation and Poverty Alleviation: Review of the Empirical Evidence, Irrigation and Drainage. 53: 1-15.
Kamara A, Van Koopen B, Magin L. 2001. Economic viability of small-scale irrigation systems in the context of state withdrawal: the Arabie Scheme in the Northern Province of South Africa. 2nd WARSFA/WaterNet Symposium: Integrated Water Resources Management: Theory, Practice, Cases; Cape Town, 30 – 31 October 2001. International Wate